Home > Comparison > Consumer Cyclical > PDD vs TSCO
The strategic rivalry between PDD Holdings Inc. and Tractor Supply Company shapes the consumer cyclical sector’s evolution. PDD Holdings operates a dynamic, digitally focused e-commerce platform, while Tractor Supply Company leads as a traditional rural lifestyle retailer. This analysis pits digital innovation against established retail strength, exploring their divergent growth models. I will evaluate which company’s trajectory presents the superior risk-adjusted return potential for a diversified portfolio in today’s competitive landscape.
Table of contents
Companies Overview
PDD Holdings and Tractor Supply Company both command significant positions in the specialty retail market, shaping consumer habits in distinct ways.
PDD Holdings Inc.: Digital Commerce Powerhouse
PDD Holdings operates primarily as a multinational e-commerce group centered on Pinduoduo and Temu platforms. Its core revenue stems from online sales across diverse categories like apparel, electronics, and groceries. In 2026, the company emphasizes expanding its digital economy footprint by integrating businesses and consumers through innovative online marketplaces.
Tractor Supply Company: Rural Retail Leader
Tractor Supply Company stands as a leading rural lifestyle retailer in the US, focusing on products for farmers, ranchers, and pet owners. It generates revenue through a vast network of physical stores and e-commerce, offering branded merchandise in agricultural and outdoor living categories. Its 2026 strategy prioritizes enhancing customer experience across both store and digital channels.
Strategic Collision: Similarities & Divergences
Both firms rely on specialty retail, yet PDD embraces a digital-first, broad-category marketplace model, whereas Tractor Supply anchors its growth in physical stores serving rural communities. Their main battleground is customer reach—urban digital consumers versus niche rural markets. Investors face contrasting profiles: PDD’s tech-driven scalability versus Tractor Supply’s resilient brick-and-mortar presence.
Income Statement Comparison
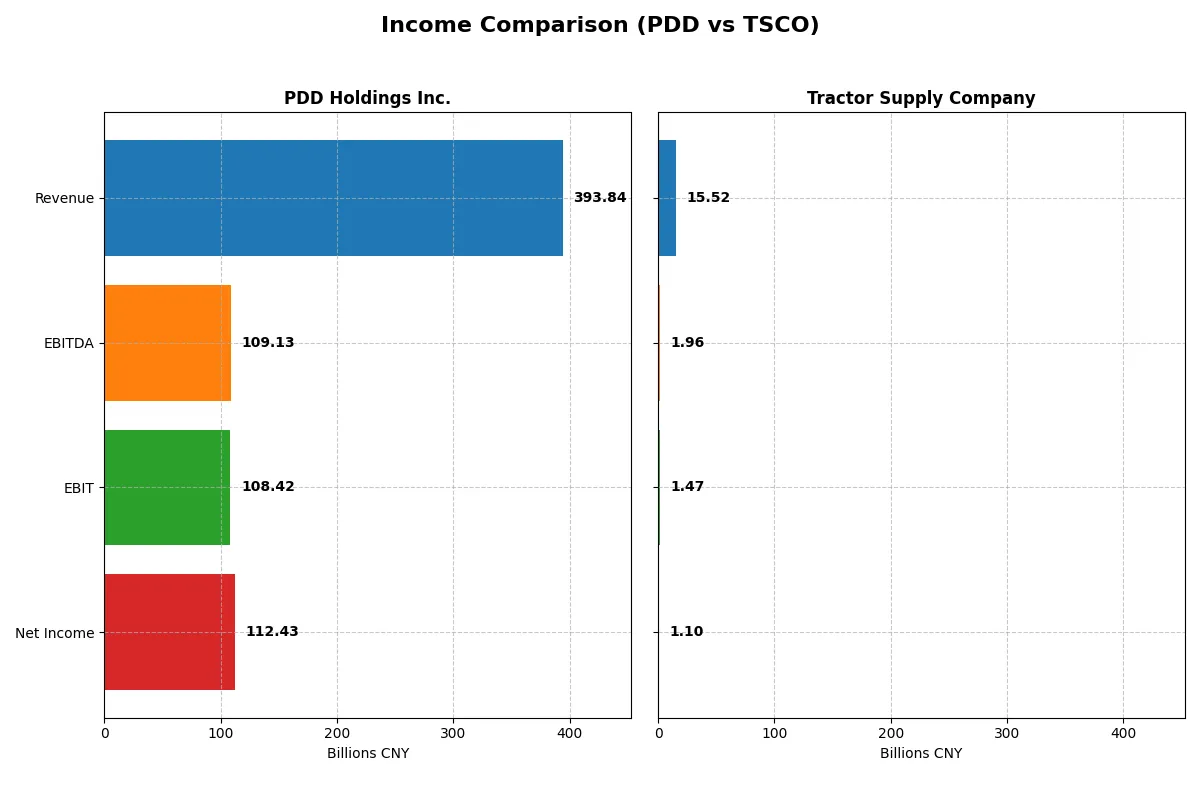
This data dissects the core profitability and scalability of both corporate engines to reveal who dominates the bottom line:
| Metric | PDD Holdings Inc. (PDD) | Tractor Supply Company (TSCO) |
|---|---|---|
| Revenue | 394B CNY | 15.5B USD |
| Cost of Revenue | 154B CNY | 10.4B USD |
| Operating Expenses | 132B CNY | 3.7B USD |
| Gross Profit | 240B CNY | 5.2B USD |
| EBITDA | 109B CNY | 2.0B USD |
| EBIT | 108B CNY | 1.5B USD |
| Interest Expense | 0 | 69M USD |
| Net Income | 112B CNY | 1.1B USD |
| EPS | 81.24 CNY | 2.07 USD |
| Fiscal Year | 2024 | 2025 |
Income Statement Analysis: The Bottom-Line Duel
This income statement comparison reveals which company runs the more efficient and profitable corporate engine from top to bottom.
PDD Holdings Inc. Analysis
PDD shows explosive revenue growth, surging from 59B CNY in 2020 to nearly 394B CNY in 2024. Net income follows suit, leaping impressively to 112B CNY in 2024. Margins remain robust with a gross margin above 60% and a net margin near 29%, reflecting strong operational leverage and efficiency gains in the most recent year.
Tractor Supply Company Analysis
TSCO reports steady revenue growth, climbing from 12.7B USD in 2021 to 15.5B USD in 2025. Net income remains stable around 1.1B USD, but margins are thinner, with gross margin at 33% and net margin just over 7%. Recent years show slight declines in profitability despite consistent revenue expansion, signaling margin pressure.
Verdict: High-Growth Margin Mastery vs. Steady Retail Resilience
PDD dominates with superior growth rates and much higher margins, showcasing a powerful expansion trajectory and operational efficiency. TSCO offers stable but modest profit gains with significantly lower margins. For investors prioritizing growth and margin expansion, PDD presents a more compelling profile, while TSCO suits those favoring steady, lower-risk retail exposure.
Financial Ratios Comparison
These vital ratios act as a diagnostic tool to expose the underlying fiscal health, valuation premiums, and capital efficiency of the companies compared below:
| Ratios | PDD Holdings Inc. (PDD) | Tractor Supply Company (TSCO) |
|---|---|---|
| ROE | 35.9% | 42.5% |
| ROIC | 28.4% | 13.1% |
| P/E | 8.7x | 24.2x |
| P/B | 3.13x | 10.3x |
| Current Ratio | 2.21 | 1.34 |
| Quick Ratio | 2.20 | 0.16 |
| D/E (Debt to Equity) | 0.03 | 3.73 |
| Debt-to-Assets | 2.1% | 88.1% |
| Interest Coverage | 0 | 21.2 |
| Asset Turnover | 0.78 | 1.42 |
| Fixed Asset Turnover | 66.3 | 2.23 |
| Payout ratio | 0% | 44.5% |
| Dividend yield | 0% | 1.84% |
| Fiscal Year | 2024 | 2025 |
Efficiency & Valuation Duel: The Vital Signs
Financial ratios serve as a company’s DNA, uncovering hidden risks and revealing operational strengths investors must understand.
PDD Holdings Inc.
PDD displays robust profitability with a 35.9% ROE and a strong 28.6% net margin, signaling efficient capital use. Its P/E ratio of 8.7 suggests undervaluation compared to peers. The firm reinvests earnings into growth and R&D, as it pays no dividend, underscoring a focus on long-term expansion.
Tractor Supply Company
TSCO posts an impressive 42.5% ROE but a modest 7.1% net margin, reflecting lower profitability efficiency. The P/E ratio at 24.2 marks the stock as fairly valued yet stretched against broader market averages. TSCO offers a 1.8% dividend yield, balancing shareholder returns with moderate leverage risks.
Valuation and Efficiency: Growth Reinvestment vs. Dividend Stability
PDD combines superior profitability with favorable valuation and conservative debt, offering a strong risk-return profile. TSCO’s high ROE contrasts with weaker margins and heavier debt, reflecting a trade-off between income and growth. Growth-focused investors may prefer PDD; income seekers might lean toward TSCO’s dividend profile.
Which one offers the Superior Shareholder Reward?
PDD Holdings Inc. pays no dividends, reinvesting heavily in growth and R&D, supported by strong free cash flow (87.4 per share in 2024). Its buyback program is minimal or absent. Tractor Supply Company delivers a 1.84% dividend yield with a 43-44% payout ratio, balancing dividends with buybacks that enhance total shareholder return. Despite TSCO’s higher leverage (debt/equity ~3.7) and lower free cash flow conversion (~45%), its consistent dividends and buybacks provide steady income and capital return. I find TSCO’s model more sustainable for long-term value and superior for income-focused investors in 2026.
Comparative Score Analysis: The Strategic Profile
The radar chart reveals the core financial DNA and trade-offs shaping the strategic profiles of PDD Holdings Inc. and Tractor Supply Company:
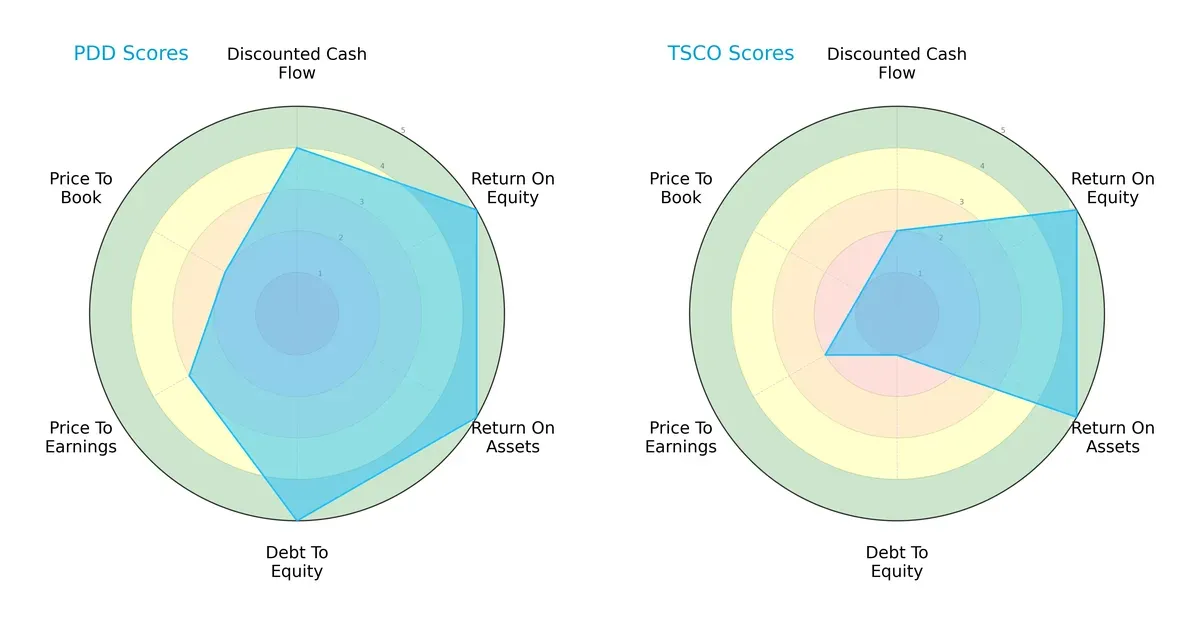
PDD holds a more balanced profile, excelling in discounted cash flow (4 vs. 2), debt-to-equity (5 vs. 1), and strong returns (ROE and ROA both 5). TSCO matches PDD’s operational efficiency but suffers from high leverage and weaker valuation metrics (PE 2 vs. 3, PB 1 vs. 2). PDD’s diversified strengths suggest a resilient growth model; TSCO relies heavily on operational returns but faces balance sheet risks.
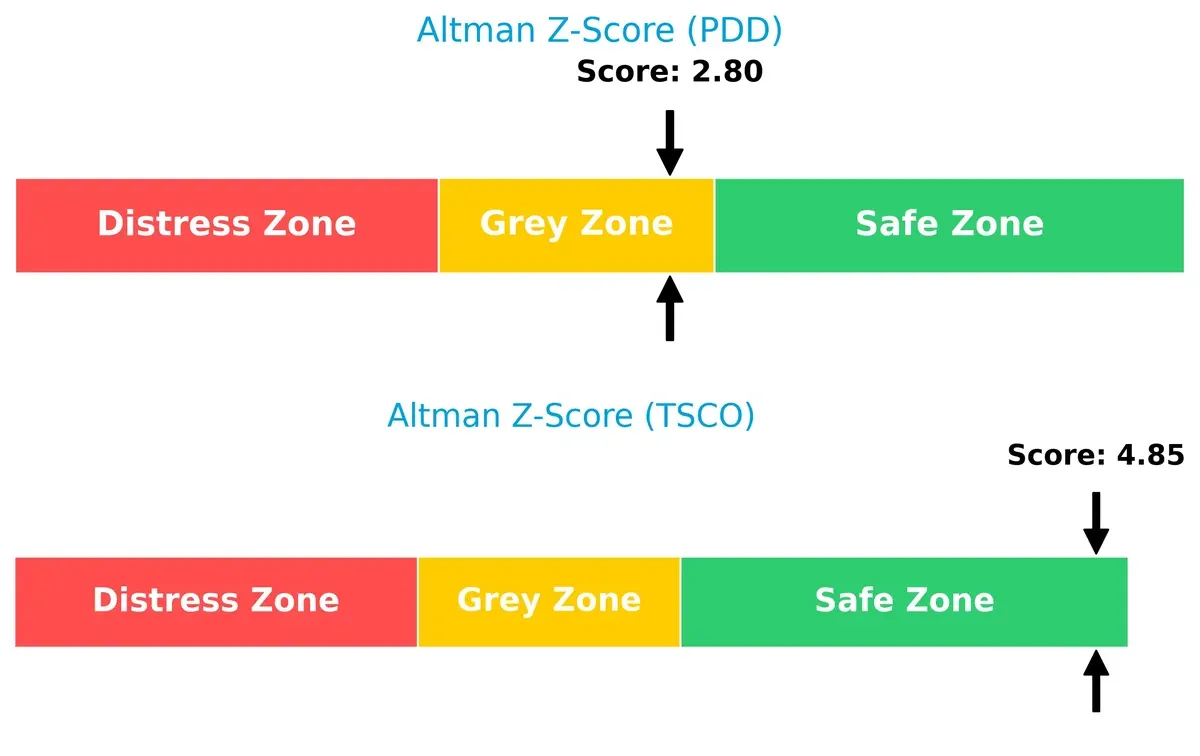
Bankruptcy Risk: Solvency Showdown
PDD’s Altman Z-Score of 2.8 places it in the grey zone, indicating moderate bankruptcy risk. TSCO’s 4.85 score securely positions it in the safe zone, signaling stronger long-term solvency in this cycle:
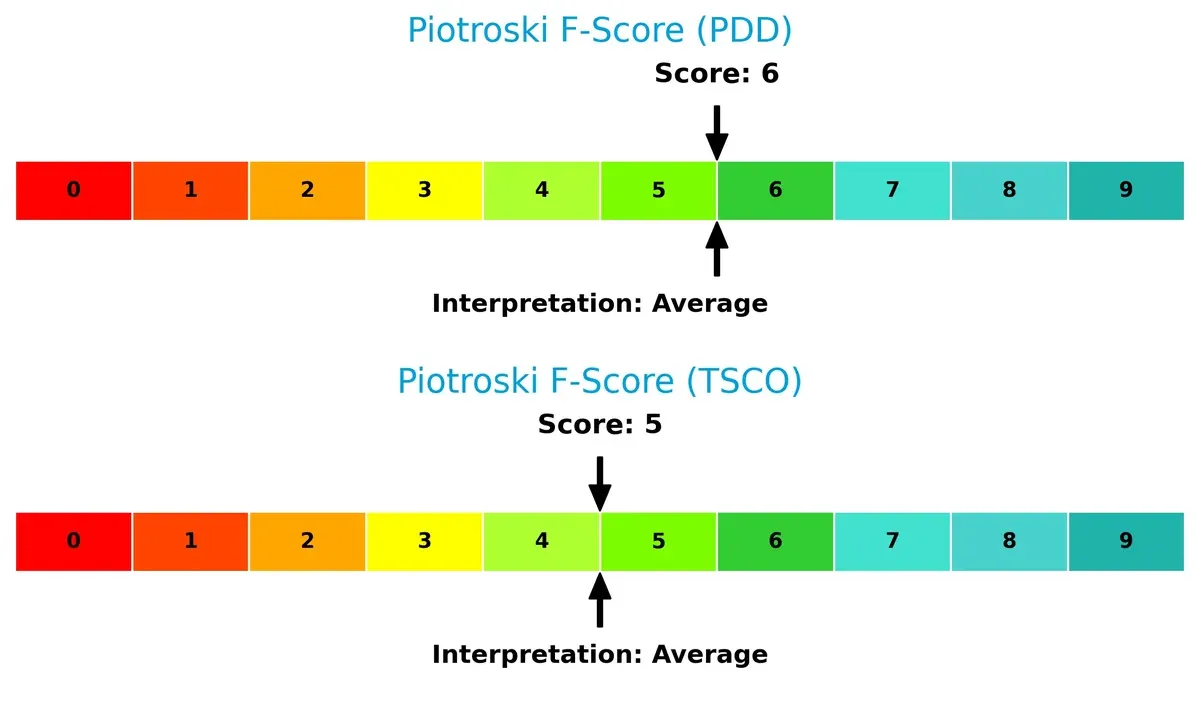
Financial Health: Quality of Operations
Both firms exhibit average Piotroski F-Scores, with PDD slightly ahead at 6 versus TSCO’s 5. Neither shows critical red flags, but PDD’s marginally higher score reflects a more robust internal financial health:
How are the two companies positioned?
This section dissects the operational DNA of PDD and TSCO by comparing their revenue distribution and internal dynamics. The goal is to confront their economic moats and identify which model offers the most resilient competitive advantage today.
Revenue Segmentation: The Strategic Mix
This visual comparison dissects how PDD Holdings Inc. and Tractor Supply Company diversify income streams and where their primary sector bets lie:
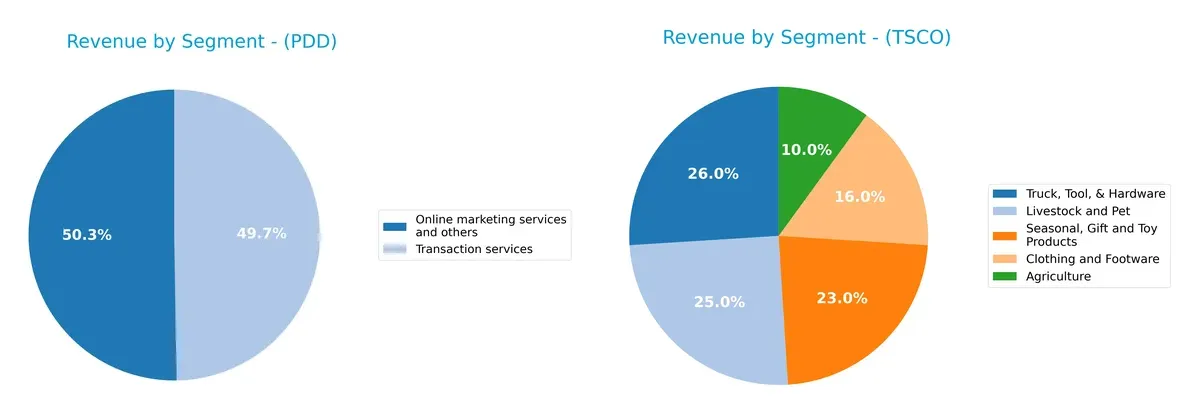
PDD anchors revenue in two dominant segments: Online marketing services (198B CNY) and Transaction services (196B CNY) in 2024, showing a concentrated ecosystem approach. Tractor Supply spreads revenue more evenly across five segments, with Truck, Tool, & Hardware leading at 3.87B, followed by Livestock and Pet at 3.72B. TSCO’s diversification reduces concentration risk, while PDD leverages platform dominance to fuel growth.
Strengths and Weaknesses Comparison
This table compares the Strengths and Weaknesses of PDD Holdings Inc. and Tractor Supply Company:
PDD Strengths
- Very favorable profitability ratios with net margin 28.55% and ROIC 28.35%
- Strong liquidity indicated by current ratio 2.21 and quick ratio 2.2
- Low leverage with debt-to-assets 2.1% and interest coverage infinite
TSCO Strengths
- High ROE at 42.46% and favorable ROIC of 13.11%
- Strong asset turnover at 1.42 indicating operational efficiency
- Favorable interest coverage ratio at 21.22
PDD Weaknesses
- Unfavorable price-to-book ratio at 3.13
- No dividend yield, indicating lack of shareholder returns
- Neutral asset turnover suggests moderate asset efficiency
TSCO Weaknesses
- High leverage with debt-to-assets 88.12% and D/E ratio 3.73
- Low quick ratio at 0.16 signals liquidity risk
- Neutral net margin of 7.06% and neutral P/E at 24.18
PDD demonstrates robust profitability and liquidity with very low leverage, supporting a strong financial base. TSCO shows operational efficiency and high returns on equity but faces risks from high leverage and weaker liquidity, which could constrain flexibility.
The Moat Duel: Analyzing Competitive Defensibility
A structural moat is the only reliable barrier protecting long-term profits from relentless competitive erosion. Let’s dissect the moats of two specialty retailers:
PDD Holdings Inc.: Network Effects Powerhouse
PDD’s moat stems from strong network effects on its e-commerce platforms, driving high ROIC (23.6%) and margin stability (28.6% net margin). Its rapid revenue growth signals expanding digital dominance in 2026.
Tractor Supply Company: Brand Loyalty in Rural Retail
TSCO relies on deep customer loyalty and localized inventory, supporting positive ROIC (6.9%) but showing signs of margin compression and a declining ROIC trend, risking moat erosion without innovation.
Network Effects vs. Brand Loyalty: The Moat Showdown
PDD’s network-driven moat is wider and deepening, fueled by scalable digital platforms and accelerating profitability. TSCO’s brand loyalty moat remains valuable but weaker and shrinking. PDD is better positioned to defend and grow its market share.
Which stock offers better returns?
The past year shows a clear divergence in stock performance between PDD Holdings Inc. and Tractor Supply Company, with notable shifts in price levels and trading volumes shaping their trajectories.
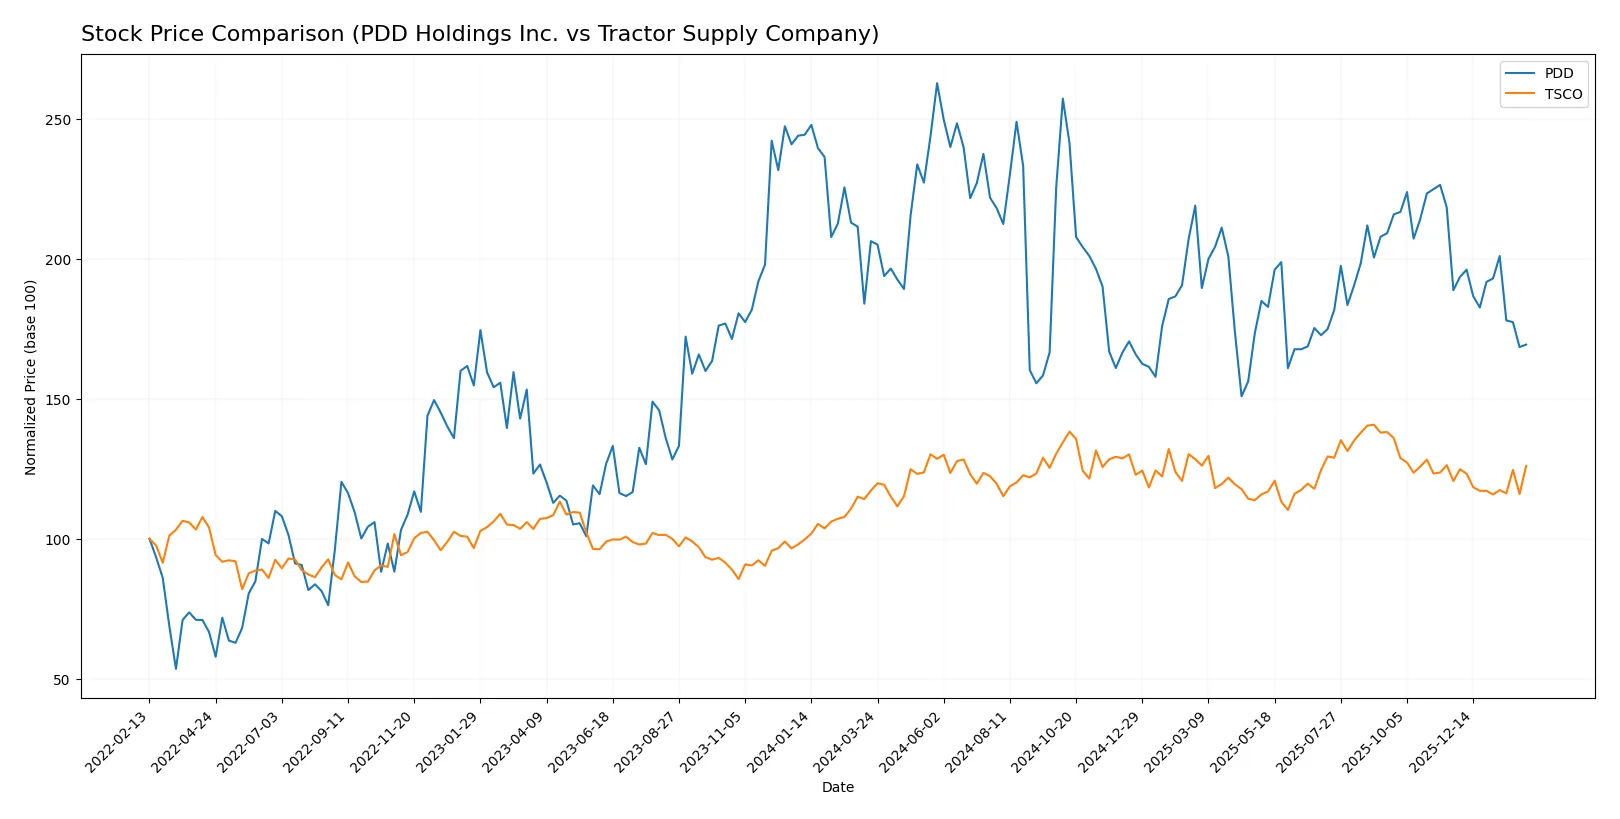
Trend Comparison
PDD Holdings Inc. displays a bearish trend with a 17.9% price decline over the past year, accompanied by decelerating losses and high volatility, from a high of 157.57 to a low of 90.5.
Tractor Supply Company shows a bullish trend with a 7.57% price gain over the past year, despite deceleration and low volatility, moving between 48.4 and 61.76 per share.
Tractor Supply outperforms PDD with positive returns, contrasting PDD’s significant depreciation in market value over the same period.
Target Prices
Analysts present a cautiously optimistic outlook based on current target price consensus.
| Company | Target Low | Target High | Consensus |
|---|---|---|---|
| PDD Holdings Inc. | 120 | 170 | 147.38 |
| Tractor Supply Company | 50 | 67 | 59 |
PDD’s consensus target stands roughly 45% above its current 102 price, signaling growth potential. Tractor Supply’s 59 target suggests a modest upside of about 7%, reflecting stable but limited near-term gains.

Don’t Let Luck Decide Your Entry Point
Optimize your entry points with our advanced ProRealTime indicators. You’ll get efficient buy signals with precise price targets for maximum performance. Start outperforming now!
How do institutions grade them?
Here is a comparison of recent institutional grades for PDD Holdings Inc. and Tractor Supply Company:
PDD Holdings Inc. Grades
Below are the latest grades from recognized financial institutions for PDD Holdings Inc.:
| Grading Company | Action | New Grade | Date |
|---|---|---|---|
| Freedom Capital Markets | Maintain | Buy | 2026-01-06 |
| B of A Securities | Maintain | Neutral | 2025-11-19 |
| New Street Research | Downgrade | Neutral | 2025-08-26 |
| B of A Securities | Maintain | Neutral | 2025-08-26 |
| Barclays | Maintain | Overweight | 2025-08-26 |
| Benchmark | Maintain | Buy | 2025-08-26 |
| Benchmark | Maintain | Buy | 2025-05-28 |
| JP Morgan | Maintain | Neutral | 2025-05-28 |
| China Renaissance | Downgrade | Hold | 2025-05-28 |
| Jefferies | Maintain | Buy | 2025-05-27 |
Tractor Supply Company Grades
Presented here are recent grades from established financial firms for Tractor Supply Company:
| Grading Company | Action | New Grade | Date |
|---|---|---|---|
| Argus Research | Maintain | Buy | 2026-02-02 |
| Goldman Sachs | Maintain | Buy | 2026-01-30 |
| DA Davidson | Maintain | Buy | 2026-01-30 |
| TD Cowen | Maintain | Hold | 2026-01-30 |
| JP Morgan | Maintain | Neutral | 2026-01-30 |
| Telsey Advisory Group | Maintain | Outperform | 2026-01-30 |
| Piper Sandler | Maintain | Overweight | 2026-01-30 |
| Jefferies | Maintain | Buy | 2026-01-30 |
| Mizuho | Maintain | Outperform | 2026-01-30 |
| Morgan Stanley | Maintain | Equal Weight | 2026-01-30 |
Which company has the best grades?
Tractor Supply Company holds generally stronger grades, including multiple Buy and Outperform ratings. PDD Holdings shows a mix, with several Neutral and Hold grades. Investors may interpret Tractor Supply’s higher consistency in positive ratings as greater institutional confidence.
Risks specific to each company
The following categories identify the critical pressure points and systemic threats facing both firms in the 2026 market environment:
1. Market & Competition
PDD Holdings Inc.
- Faces intense competition in global e-commerce with fast innovation cycles.
Tractor Supply Company
- Competes in a niche rural retail market with steady but limited growth potential.
2. Capital Structure & Debt
PDD Holdings Inc.
- Maintains a very low debt-to-equity ratio of 0.03, indicating strong financial stability.
Tractor Supply Company
- Exhibits high leverage with debt-to-equity at 3.73, raising financial risk concerns.
3. Stock Volatility
PDD Holdings Inc.
- Beta near zero (-0.014) suggests low stock volatility and market risk sensitivity.
Tractor Supply Company
- Beta at 0.726 implies moderate stock volatility relative to the market.
4. Regulatory & Legal
PDD Holdings Inc.
- Subject to complex international e-commerce regulations and data privacy laws.
Tractor Supply Company
- Faces U.S. retail regulatory compliance, generally stable but subject to local changes.
5. Supply Chain & Operations
PDD Holdings Inc.
- Relies on global supply chains vulnerable to geopolitical tensions and logistics disruptions.
Tractor Supply Company
- Operates domestic supply chains with exposure to regional weather and transportation risks.
6. ESG & Climate Transition
PDD Holdings Inc.
- Increasing pressure to improve sustainability in sourcing and carbon footprint.
Tractor Supply Company
- Faces growing demand for sustainable products and operational energy efficiency.
7. Geopolitical Exposure
PDD Holdings Inc.
- High exposure to China and international markets with geopolitical tensions.
Tractor Supply Company
- Primarily U.S.-focused, less exposed to global geopolitical risks.
Which company shows a better risk-adjusted profile?
PDD’s greatest risk lies in its complex global supply chain and geopolitical exposure. Tractor Supply’s highest risk centers on its heavy debt load, which increases financial vulnerability. Despite PDD’s international uncertainties, its robust balance sheet and low leverage give it a superior risk-adjusted profile. Notably, PDD’s Altman Z-score in the grey zone contrasts with TSCO’s safe zone, but TSCO’s debt-to-assets ratio near 88% flags significant risk. Thus, I favor PDD for a more balanced risk-return stance in 2026.
Final Verdict: Which stock to choose?
PDD Holdings Inc. excels as a cash-generating powerhouse with a striking ability to convert invested capital into robust profits. Its rapidly growing ROIC signals a sustainable competitive edge. However, investors should monitor valuation multiples, which appear stretched relative to its fundamentals. PDD suits aggressive growth portfolios seeking dynamic value creation.
Tractor Supply Company leverages a resilient retail moat with steady returns on equity and consistent free cash flow. Its conservative capital structure offers a safer harbor amid economic uncertainty compared to PDD. TSCO fits well in GARP portfolios that prioritize stability combined with moderate growth prospects.
If you prioritize high-growth opportunities with strong capital efficiency, PDD outshines due to its expanding moat and superior profitability. However, if you seek better stability with a proven dividend history and lower leverage, TSCO offers a safer profile for risk-averse investors. Both present viable analytical scenarios depending on your risk tolerance and growth horizon.
Disclaimer: Investment carries a risk of loss of initial capital. The past performance is not a reliable indicator of future results. Be sure to understand risks before making an investment decision.
Go Further
I encourage you to read the complete analyses of PDD Holdings Inc. and Tractor Supply Company to enhance your investment decisions: