Home > Comparison > Financial Services > V vs PYPL
The strategic rivalry between Visa Inc. and PayPal Holdings defines the evolving landscape of financial credit services. Visa, a global payments technology powerhouse, operates a vast transaction processing network, while PayPal focuses on digital payment innovation across multiple platforms and currencies. This analysis explores their competing business models and investment profiles to determine which offers superior risk-adjusted returns for a diversified portfolio in today’s dynamic financial sector.
Table of contents
Companies Overview
Visa Inc. and PayPal Holdings, Inc. dominate the global digital payments landscape with distinct scale and innovation strategies.
Visa Inc.: Global Payment Network Leader
Visa Inc. stands as a payments technology giant, generating revenue by facilitating digital transactions across consumers, merchants, and financial institutions. Its core engine is VisaNet, a robust transaction processing network that handles authorization, clearing, and settlement worldwide. In 2026, Visa sharpens its focus on enhancing payment experiences through strategic partnerships, such as with Ooredoo in Qatar, reinforcing its global footprint.
PayPal Holdings, Inc.: Digital Payments Innovator
PayPal Holdings, Inc. operates a technology-driven payments platform enabling seamless digital payments for merchants and consumers in 200 markets. It earns revenue from transaction fees across its diversified brands, including Venmo and Braintree. PayPal’s 2026 strategy centers on expanding multi-currency support and enhancing user convenience to capture growing e-commerce demand and digital wallet adoption.
Strategic Collision: Similarities & Divergences
Both companies thrive in financial services but diverge in approach: Visa leverages a closed, network-driven ecosystem, while PayPal builds an open, platform-based infrastructure. Their fiercest competition unfolds in digital transaction volume and cross-border payments. Visa’s scale offers stability, while PayPal’s innovation signals growth potential, defining contrasting investment profiles rooted in market dominance versus rapid adaptation.
Income Statement Comparison
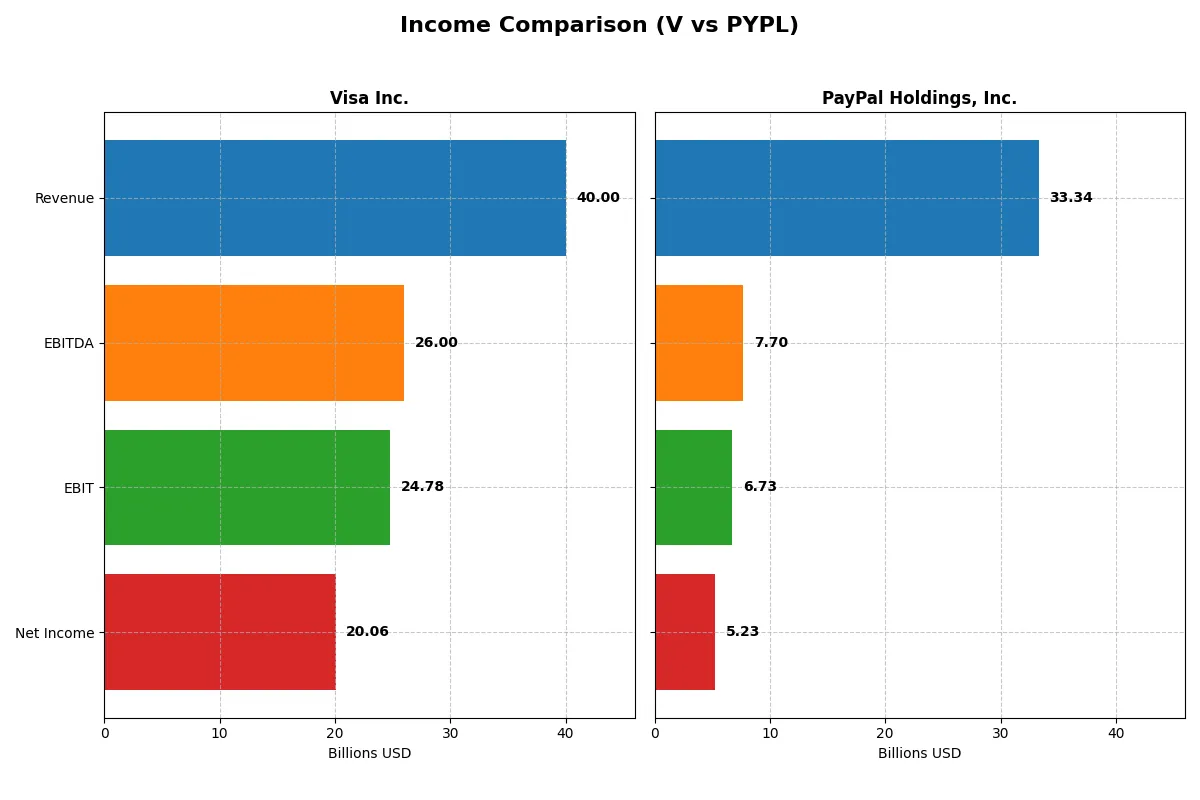
This data dissects the core profitability and scalability of both corporate engines to reveal who dominates the bottom line:
| Metric | Visa Inc. (V) | PayPal Holdings, Inc. (PYPL) |
|---|---|---|
| Revenue | 40B | 33.3B |
| Cost of Revenue | 7.9B | 17.7B |
| Operating Expenses | 8.2B | 9.1B |
| Gross Profit | 32.1B | 15.7B |
| EBITDA | 26B | 7.7B |
| EBIT | 24.8B | 6.7B |
| Interest Expense | 589M | 441M |
| Net Income | 20.1B | 5.2B |
| EPS | 10.22 | 5.46 |
| Fiscal Year | 2025 | 2025 |
Income Statement Analysis: The Bottom-Line Duel
This income statement comparison reveals the true efficiency and profitability of Visa and PayPal’s corporate engines over recent years.
Visa Inc. Analysis
Visa’s revenue grew steadily from $24B in 2021 to $40B in 2025, with net income rising from $12.3B to nearly $20B. The company maintains a strong gross margin above 80% and a net margin over 50%, demonstrating exceptional profitability. Despite slight margin compression recently, Visa’s earnings per share grew by 4.8% last year, reflecting solid operational momentum.
PayPal Holdings, Inc. Analysis
PayPal’s revenue increased from $25.4B in 2021 to $33.3B in 2025, with net income climbing from $4.2B to $5.2B. The firm sustains a healthy gross margin around 47% and a net margin near 16%. PayPal showed strong earnings growth last year, with net margin expanding 20% and EPS surging 35.6%, signaling improving operational efficiency and accelerating profitability.
Margin Dominance vs. Growth Momentum
Visa dominates with superior margins and higher absolute profits, boasting a 50% net margin vs. PayPal’s 16%. However, PayPal exhibits faster earnings growth and margin expansion on a smaller base. Visa’s profile suits investors seeking robust profitability; PayPal appeals to those prioritizing growth potential.
Financial Ratios Comparison
These vital ratios act as a diagnostic tool to expose the underlying fiscal health, valuation premiums, and capital efficiency:
| Ratios | Visa Inc. (V) | PayPal Holdings, Inc. (PYPL) |
|---|---|---|
| ROE | 52.9% | 25.8% |
| ROIC | 28.4% | 15.0% |
| P/E | 33.1 | 10.7 |
| P/B | 17.5 | 2.8 |
| Current Ratio | 1.08 | 1.29 |
| Quick Ratio | 1.08 | 1.29 |
| D/E | 0.66 | 0.49 |
| Debt-to-Assets | 25.3% | 12.5% |
| Interest Coverage | 40.7 | 0 |
| Asset Turnover | 0.40 | 0.41 |
| Fixed Asset Turnover | 9.44 | 19.5 |
| Payout Ratio | 23.1% | 2.5% |
| Dividend Yield | 0.70% | 0.23% |
| Fiscal Year | 2025 | 2025 |
Efficiency & Valuation Duel: The Vital Signs
Financial ratios act as a company’s DNA, revealing hidden risks and operational excellence that shape investment decisions.
Visa Inc.
Visa dominates profitability with a stellar 52.9% ROE and a commanding 50.1% net margin, signaling operational excellence. However, its valuation appears stretched, with a high P/E of 33.05 and P/B of 17.49, reflecting premium pricing. Visa rewards shareholders modestly via a 0.7% dividend yield, prioritizing stability over aggressive buybacks or growth investments.
PayPal Holdings, Inc.
PayPal shows solid profitability with a 25.8% ROE and 15.8% net margin, indicating efficient operations but at a more moderate level. Its valuation is attractive, with a P/E of 10.7 and a reasonable P/B of 2.76. Despite a low 0.23% dividend yield, PayPal favors reinvestment, allocating substantial resources to R&D for future growth prospects.
Premium Valuation vs. Growth Efficiency
Visa commands a premium valuation justified by exceptional profitability but offers limited shareholder returns. PayPal balances a more appealing valuation with solid operational efficiency and growth-oriented reinvestment. Investors seeking stability may lean toward Visa, while growth-focused profiles align better with PayPal’s reinvestment strategy.
Which one offers the Superior Shareholder Reward?
Visa Inc. and PayPal Holdings adopt contrasting shareholder reward strategies. Visa delivers a consistent dividend yield near 0.7% with a moderate payout ratio around 23%, backed by strong free cash flow coverage above 90%. Its robust buyback program further enhances total returns. PayPal’s dividend yield remains negligible, reflecting a near-zero payout ratio as it prioritizes reinvestment in growth and acquisitions, supported by substantial cash reserves. However, PayPal’s lower operating and net margins constrain rapid free cash flow growth, limiting buyback capacity. I find Visa’s balanced dividend and buyback approach more sustainable and compelling for 2026 investors seeking both income and capital appreciation.
Comparative Score Analysis: The Strategic Profile
The radar chart reveals the fundamental DNA and trade-offs of Visa Inc. and PayPal Holdings, Inc., highlighting their financial strengths and valuation differences:
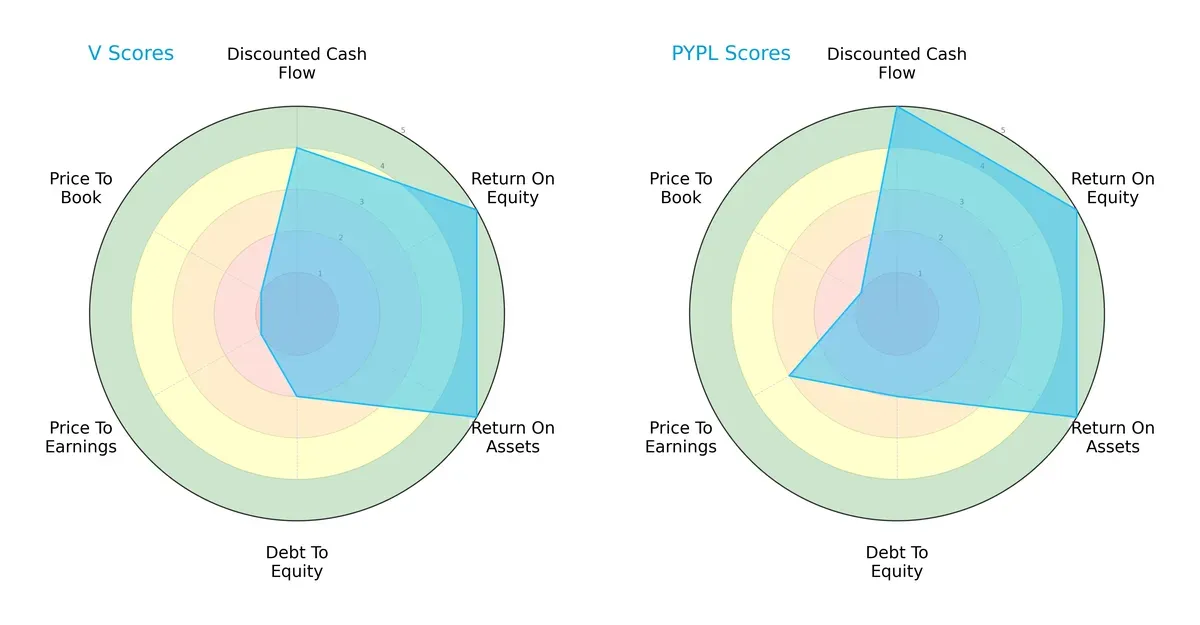
Visa shows a balanced operational efficiency with top ROE and ROA scores (5 each), but weak valuation metrics (P/E and P/B scores at 1). PayPal matches Visa’s operational excellence but has a superior DCF score (5 vs. 4) and a better P/E valuation (3 vs. 1), indicating a more favorable pricing environment. Both share moderate debt-to-equity risk (score 2), but PayPal’s overall profile leans more favorably due to valuation advantages.
Bankruptcy Risk: Solvency Showdown
Visa’s Altman Z-Score of 8.21 places it firmly in the safe zone, while PayPal’s 1.84 situates it in the grey zone, implying higher bankruptcy risk:
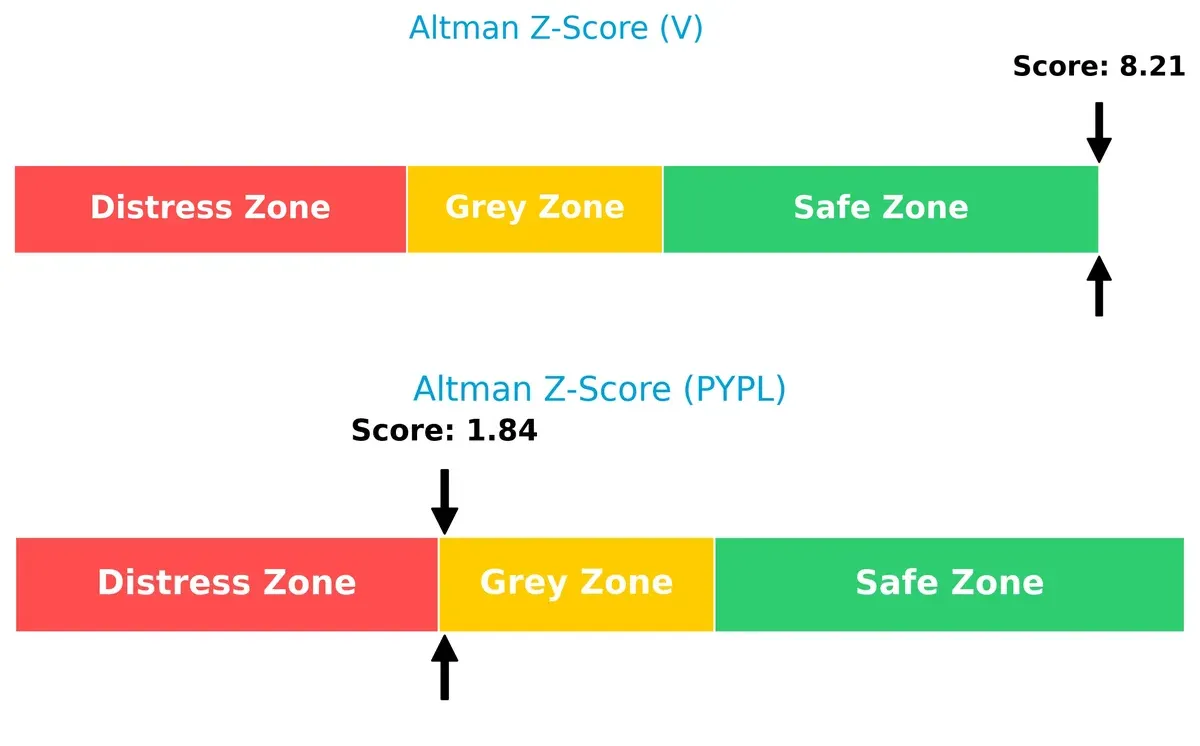
Visa’s strong solvency signals robust financial health and resilience across the current market cycle. PayPal, though operationally sound, faces moderate long-term survival risk due to weaker balance sheet stability.
Financial Health: Quality of Operations
Both companies achieve a Piotroski F-Score of 7, indicating strong internal financial health with no immediate red flags:
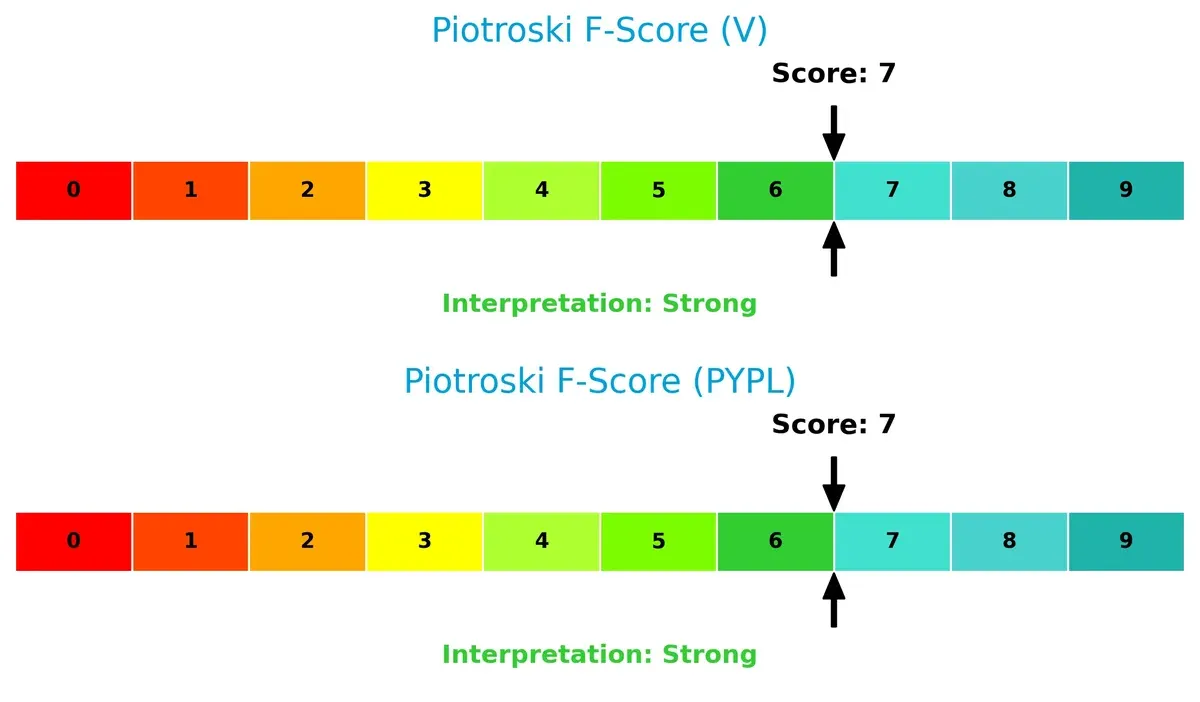
This parity suggests both firms maintain solid profitability, liquidity, and efficiency metrics. Investors should note that while PayPal’s financial quality is strong, its higher bankruptcy risk warrants caution compared to Visa’s safer profile.
How are the two companies positioned?
This section dissects Visa and PayPal’s operational DNA by comparing revenue distribution and internal strengths and weaknesses. The goal is to confront their economic moats to identify which model offers the most resilient competitive advantage today.
Revenue Segmentation: The Strategic Mix
This visual comparison dissects how Visa Inc. and PayPal Holdings diversify their income streams and where their primary sector bets lie:
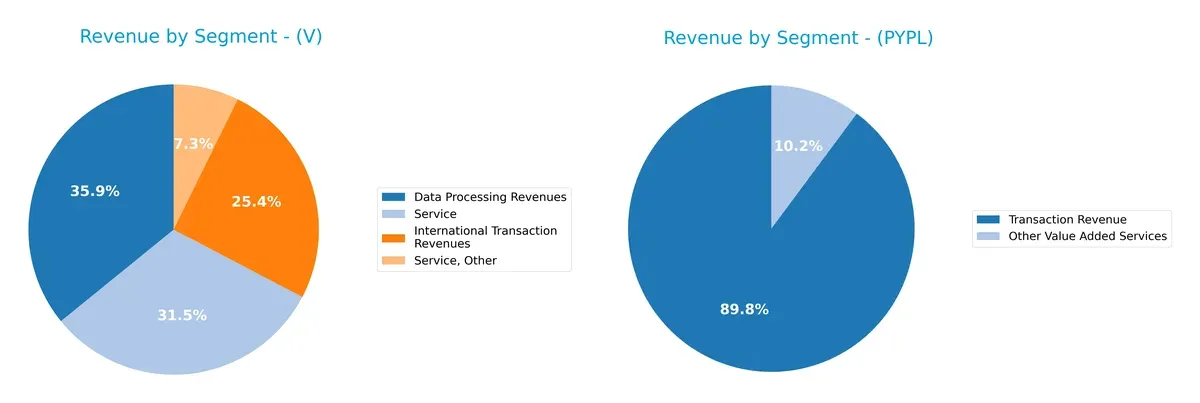
Visa anchors its revenue in Data Processing ($20B) and International Transactions ($14B), with Service segments adding $17.5B, showing a multi-faceted model. PayPal pivots heavily on Transaction Revenue ($30B), with a smaller contribution from Other Value Added Services ($3.4B). Visa’s diversified mix reduces concentration risk, leveraging infrastructure dominance. PayPal’s reliance on a single segment poses higher risk but reflects focused fintech ecosystem lock-in.
Strengths and Weaknesses Comparison
This table compares the strengths and weaknesses of Visa and PayPal across key financial and strategic metrics:
Visa Strengths
- Higher net margin at 50.14%
- Strong ROE at 52.91%
- ROIC well above WACC at 28.36%
- Significant international revenue with $24.4B Non-US sales
- Favorable debt-to-assets at 25.27%
- High interest coverage ratio at 42.08
PayPal Strengths
- Favorable net margin at 15.78%
- Good ROE at 25.83%
- ROIC at 14.95% above WACC
- Lower debt-to-assets at 12.46%
- Strong fixed asset turnover at 19.51
- Growing transaction revenue at $29.8B
Visa Weaknesses
- Unfavorable P/E of 33.05 and P/B of 17.49 indicating expensive valuation
- Asset turnover low at 0.4
- Dividend yield low at 0.7%
- Moderate current ratio at 1.08
- Revenue concentrated in payments with less diversification
PayPal Weaknesses
- Lower net margin relative to Visa
- WACC neutral at 9.14%
- Dividend yield very low at 0.23%
- Asset turnover also low at 0.41
- Revenue heavily reliant on U.S. market with $18.9B sales
Visa demonstrates superior profitability and international diversification, supported by strong capital efficiency and leverage management. PayPal shows solid operational efficiency and lower leverage but lags in profitability and geographic diversification. Both face valuation and asset utilization challenges relevant to their competitive strategies.
The Moat Duel: Analyzing Competitive Defensibility
A structural moat protects long-term profits from relentless competition and market entry pressures. Here’s how Visa and PayPal defend their turf:
Visa Inc.: Network Effects Powerhouse
Visa’s dominant network effects lock in merchants and consumers, reflected in a stellar 50% net margin and 21% ROIC above WACC. Its expanding global footprint, especially outside the U.S., deepens this moat in 2026.
PayPal Holdings, Inc.: Platform Ecosystem with Growth Potential
PayPal’s moat stems from its broad digital payment platform and diverse product suite. Though its 15.7% net margin lags Visa, it maintains a positive ROIC spread and pursues market expansion via innovative services like Venmo and Honey.
Verdict: Network Effects vs. Platform Ecosystem
Visa’s wider moat benefits from entrenched global payment rails and higher capital efficiency. PayPal’s ecosystem is growing but faces tougher margin pressure. Visa remains better positioned to defend its market share long term.
Which stock offers better returns?
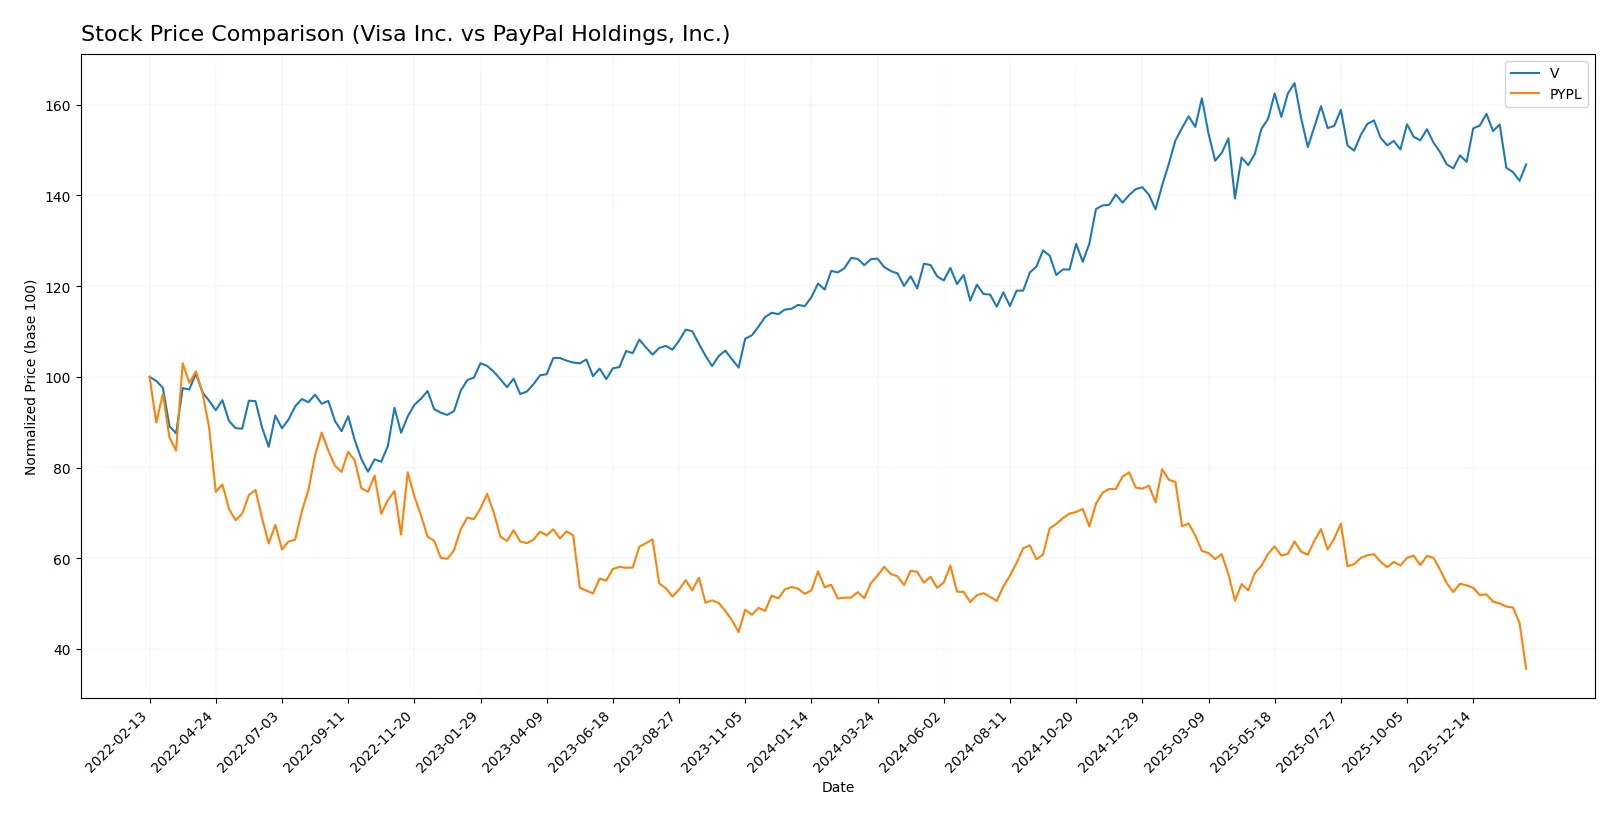
The past year reveals Visa’s strong 16.57% price gain despite decelerating momentum. PayPal’s stock shows a sharp 34.72% decline, with steady deceleration and weaker buyer interest.
Trend Comparison
Visa Inc.’s stock exhibits a bullish trend over 12 months with a 16.57% increase, though momentum slows. Its price fluctuated between 259.46 and 370.22, showing notable volatility with a 32.79 standard deviation.
PayPal Holdings, Inc. shows a bearish trend with a 34.72% loss over the past year, decelerating in decline. Price ranged from 41.03 to 91.81, exhibiting lower volatility at a 9.48 standard deviation.
Visa outperforms PayPal significantly over the analyzed period, delivering the highest market returns despite recent slight deceleration.
Target Prices
Analysts present a mixed but cautiously optimistic target price consensus for Visa Inc. and PayPal Holdings, Inc.
| Company | Target Low | Target High | Consensus |
|---|---|---|---|
| Visa Inc. | 160 | 425 | 378 |
| PayPal Holdings, Inc. | 34 | 87 | 53.95 |
Visa’s target consensus at 378 suggests upside from its current 330 price, reflecting confidence in its durable moat and steady cash flow. PayPal’s consensus near 54 implies potential growth, but also highlights higher volatility relative to its 41 current price.

Don’t Let Luck Decide Your Entry Point
Optimize your entry points with our advanced ProRealTime indicators. You’ll get efficient buy signals with precise price targets for maximum performance. Start outperforming now!
How do institutions grade them?
The following tables summarize recent institutional grades for Visa Inc. and PayPal Holdings, Inc.:
Visa Inc. Grades
This table shows current grades from several reputable grading firms for Visa Inc.
| Grading Company | Action | New Grade | Date |
|---|---|---|---|
| Macquarie | Maintain | Outperform | 2026-01-30 |
| Cantor Fitzgerald | Maintain | Overweight | 2026-01-30 |
| RBC Capital | Maintain | Outperform | 2026-01-30 |
| Morgan Stanley | Maintain | Overweight | 2026-01-30 |
| B of A Securities | Upgrade | Buy | 2025-12-11 |
| HSBC | Upgrade | Buy | 2025-12-08 |
| UBS | Maintain | Buy | 2025-10-29 |
| Raymond James | Maintain | Outperform | 2025-10-29 |
| Baird | Maintain | Outperform | 2025-10-06 |
PayPal Holdings, Inc. Grades
This table details current grades from recognized grading firms for PayPal Holdings, Inc.
| Grading Company | Action | New Grade | Date |
|---|---|---|---|
| Macquarie | Maintain | Outperform | 2026-02-04 |
| Wells Fargo | Maintain | Equal Weight | 2026-02-04 |
| Citigroup | Maintain | Neutral | 2026-02-04 |
| Goldman Sachs | Maintain | Sell | 2026-02-04 |
| Morgan Stanley | Maintain | Underweight | 2026-02-04 |
| Needham | Maintain | Hold | 2026-02-04 |
| Evercore ISI Group | Maintain | In Line | 2026-02-04 |
| Canaccord Genuity | Downgrade | Hold | 2026-02-04 |
| Citizens | Downgrade | Market Perform | 2026-02-04 |
| JP Morgan | Maintain | Neutral | 2026-02-04 |
Which company has the best grades?
Visa Inc. consistently receives superior grades, including multiple “Outperform” and “Buy” ratings. PayPal shows mixed reviews, including “Sell” and “Underweight” grades. Investors may perceive Visa as the more favored stock by analysts, potentially influencing demand and valuation.
Risks specific to each company
The following categories identify the critical pressure points and systemic threats facing both firms in the 2026 market environment:
1. Market & Competition
Visa Inc.
- Dominates the traditional card payments market with a vast global network but faces fintech disruption risks.
PayPal Holdings, Inc.
- Faces fierce competition from emerging digital wallets and crypto payment platforms, challenging its market share.
2. Capital Structure & Debt
Visa Inc.
- Maintains moderate leverage (D/E 0.66) with strong interest coverage (42x), signaling low financial risk.
PayPal Holdings, Inc.
- Lower leverage (D/E 0.49) but weaker interest coverage (15x), indicating manageable but higher debt risk.
3. Stock Volatility
Visa Inc.
- Beta of 0.78 reflects lower volatility relative to the market, offering stability to investors.
PayPal Holdings, Inc.
- Beta of 1.42 implies higher stock volatility, increasing risk for investors in turbulent markets.
4. Regulatory & Legal
Visa Inc.
- Faces ongoing scrutiny on transaction fees and data privacy but benefits from regulatory experience.
PayPal Holdings, Inc.
- Subject to regulatory changes in digital payments and cross-border transfers, posing compliance challenges.
5. Supply Chain & Operations
Visa Inc.
- Operates a resilient, proprietary network (VisaNet) with strong operational control and scale advantages.
PayPal Holdings, Inc.
- Relies on third-party platforms and partnerships, which may introduce operational vulnerabilities.
6. ESG & Climate Transition
Visa Inc.
- Increasingly integrates ESG factors but faces pressure to reduce carbon footprint across global operations.
PayPal Holdings, Inc.
- Actively advances ESG initiatives but must enhance transparency and impact reporting to satisfy investors.
7. Geopolitical Exposure
Visa Inc.
- Global presence exposes it to geopolitical risks, but diversified markets mitigate regional shocks.
PayPal Holdings, Inc.
- Broad international reach with reliance on emerging markets adds geopolitical uncertainty and currency risks.
Which company shows a better risk-adjusted profile?
Visa’s dominant market position and low stock volatility offer a more stable risk profile. PayPal faces higher market and operational risks, reflected in its elevated beta and regulatory challenges. Visa’s superior Altman Z-Score (8.2 vs. 1.8) signals stronger financial safety. However, PayPal’s lower valuation metrics and solid profitability suggest growth potential but with higher risk. The most impactful risk for Visa is regulatory scrutiny on fees, while PayPal’s crucial risk is elevated stock volatility and geopolitical exposure. Overall, Visa shows a better risk-adjusted profile in 2026’s complex environment.
Final Verdict: Which stock to choose?
Visa Inc. wields unmatched efficiency as a global payments powerhouse, generating strong returns well above its cost of capital. Its main point of vigilance is a relatively high valuation, which might compress future upside. Visa suits investors seeking steady, long-term growth with a premium on quality.
PayPal’s strategic moat lies in its recurring revenue from digital wallets and e-commerce integration, offering more attractive valuation metrics. It carries somewhat higher financial risk but provides a compelling growth profile at a reasonable price. PayPal fits portfolios focused on growth at a reasonable price with moderate risk tolerance.
If you prioritize durable economic moats and superior capital efficiency, Visa outshines as a compelling choice, commanding a premium for stability. However, if you seek growth opportunities with better valuation and can tolerate higher volatility, PayPal offers superior upside potential. Both present distinct analytical scenarios aligned with different investor profiles.
Disclaimer: Investment carries a risk of loss of initial capital. The past performance is not a reliable indicator of future results. Be sure to understand risks before making an investment decision.
Go Further
I encourage you to read the complete analyses of Visa Inc. and PayPal Holdings, Inc. to enhance your investment decisions: