Home > Comparison > Financial Services > PYPL vs SYF
The strategic rivalry between PayPal Holdings, Inc. and Synchrony Financial shapes the evolution of the financial services sector. PayPal excels as a technology-driven digital payments platform, while Synchrony operates as a consumer credit services powerhouse. This analysis pits PayPal’s innovation and scale against Synchrony’s credit expertise and retail partnerships. I will determine which company’s strategy delivers a superior risk-adjusted return for a diversified investment portfolio.

Table of contents
Companies Overview
PayPal and Synchrony Financial are key players shaping the U.S. financial credit services landscape.
PayPal Holdings, Inc.: Digital Payments Pioneer
PayPal dominates digital payments, operating a technology platform that facilitates transactions for merchants and consumers globally. Its revenue primarily stems from transaction fees across brands like PayPal, Venmo, and Braintree. In 2026, PayPal focuses on expanding cross-border payment capabilities and enhancing its multi-currency wallet to capture global e-commerce growth.
Synchrony Financial: Consumer Credit Specialist
Synchrony leads in consumer financial services, specializing in credit cards and installment loans tailored for retail and healthcare sectors. It generates income through interest and fees on diverse credit products, including private label and co-brand cards. Its 2026 strategy centers on deepening partnerships with retail and healthcare providers while diversifying deposit offerings to broaden its consumer base.
Strategic Collision: Similarities & Divergences
Both firms excel in credit services but differ fundamentally in approach. PayPal emphasizes an open digital payments ecosystem enabling global transaction flow. Synchrony prioritizes closed-loop credit solutions embedded in retail and healthcare. Their competitive battleground lies in consumer financing innovation. Investors face distinct profiles: PayPal offers tech-driven growth potential, while Synchrony provides stable credit income with sector-specific focus.
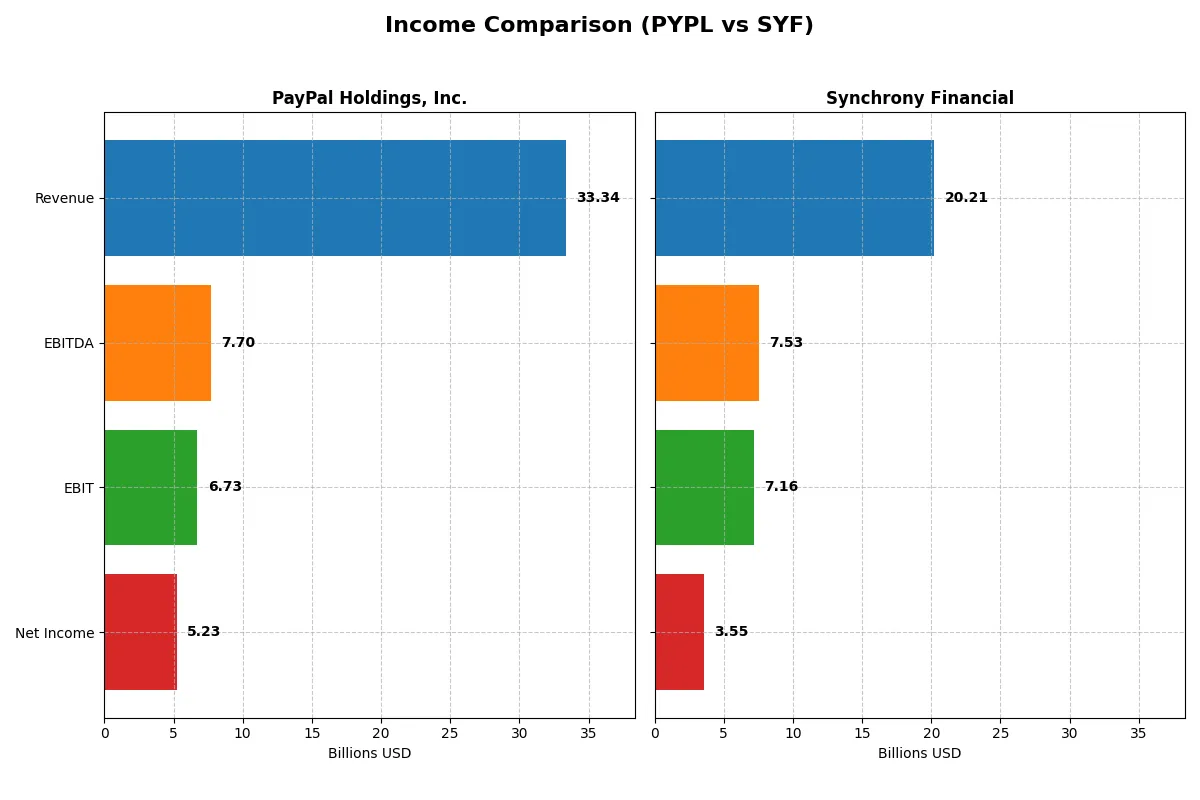
Income Statement Comparison
The following data dissects the core profitability and scalability of both corporate engines to reveal who dominates the bottom line:
| Metric | PayPal Holdings, Inc. (PYPL) | Synchrony Financial (SYF) |
|---|---|---|
| Revenue | 33.3B | 20.2B |
| Cost of Revenue | 17.7B | 7.9B |
| Operating Expenses | 9.1B | 5.1B |
| Gross Profit | 15.7B | 12.3B |
| EBITDA | 7.7B | 7.5B |
| EBIT | 6.7B | 7.2B |
| Interest Expense | 441M | 4.1B |
| Net Income | 5.2B | 3.5B |
| EPS | 5.46 | 9.35 |
| Fiscal Year | 2025 | 2025 |
Income Statement Analysis: The Bottom-Line Duel
This income statement comparison reveals which company operates its financial engine with greater efficiency and momentum over recent years.
PayPal Holdings, Inc. Analysis
PayPal’s revenue rose steadily from $25.4B in 2021 to $33.3B in 2025, a 31% growth over five years. Net income expanded from $4.17B to $5.23B, demonstrating solid bottom-line progress. Gross margin hovered near 47%, with a net margin of 15.7% in 2025, signaling healthy profitability. Efficiency improved in 2025 with EBIT growing 18%, highlighting strong operational momentum.
Synchrony Financial Analysis
Synchrony’s revenue climbed sharply by 80% from $11.2B in 2021 to $20.2B in 2025 but dipped 2.6% in the latest year. Net income, however, dropped by nearly 16% over five years to $3.55B in 2025. Gross margin was robust at 60.8%, with an impressive EBIT margin of 35.4%, but interest expense weighed heavily at over 20% of revenue. EBIT surged 57% in 2025, indicating operational leverage despite margin pressures.
Margin Power vs. Revenue Scale
PayPal delivers consistent revenue and net income growth with balanced margins and improving efficiency. Synchrony boasts higher gross and EBIT margins, fueled by a strong revenue jump but suffers from elevated interest costs and net income declines. PayPal’s profile favors steady profit expansion, appealing to investors valuing sustainable earnings growth.
Financial Ratios Comparison
These vital ratios act as a diagnostic tool to expose the underlying fiscal health, valuation premiums, and capital efficiency of the companies compared below:
| Ratios | PayPal Holdings, Inc. (PYPL) | Synchrony Financial (SYF) |
|---|---|---|
| ROE | 25.8% | 21.2% |
| ROIC | 14.95% | -91.6% |
| P/E | 10.7 | 8.41 |
| P/B | 2.76 | 1.78 |
| Current Ratio | 1.29 | 0 |
| Quick Ratio | 1.29 | 0 |
| D/E (Debt to Equity) | 0.49 | 0.91 |
| Debt-to-Assets | 12.5% | 12.7% |
| Interest Coverage | 0 | 1.73 |
| Asset Turnover | 0.41 | 0.17 |
| Fixed Asset Turnover | 19.5 | 0 |
| Payout Ratio | 2.5% | 11.6% |
| Dividend Yield | 0.23% | 1.38% |
| Fiscal Year | 2025 | 2025 |
Efficiency & Valuation Duel: The Vital Signs
Financial ratios act as a company’s DNA, exposing hidden risks and operational strengths crucial for investment decisions.
PayPal Holdings, Inc.
PayPal demonstrates strong profitability with a 25.8% ROE and a solid 15.8% net margin, reflecting operational excellence. Its valuation appears reasonable at a 10.7 P/E and 1.75 EV/Sales, indicating the stock is fairly priced. Shareholders receive modest dividends (0.23%), while the company prioritizes reinvestment through R&D, supporting growth and innovation.
Synchrony Financial
Synchrony posts a decent 21.2% ROE and an even higher net margin of 17.6%, signaling good profitability. The stock trades at a lower 8.4 P/E and 1.49 EV/Sales, suggesting it is attractively valued. Dividend yield at 1.38% offers steady income, but a negative ROIC and weak interest coverage raise caution about capital efficiency and financial stability.
Balanced Profitability vs. Capital Efficiency Concerns
PayPal offers a better balance of robust profitability and sound valuation, with strong returns on equity and invested capital. Synchrony’s attractive valuation and dividends come with notable risks in capital returns and liquidity. Investors favoring growth and operational strength may lean toward PayPal, while income seekers might consider Synchrony despite its financial challenges.
Which one offers the Superior Shareholder Reward?
I see PayPal (PYPL) offers a minimal dividend yield of 0.23%, with a very low payout ratio of 2.5%, signaling a growth reinvestment focus. Its free cash flow comfortably covers distributions, but buybacks remain modest. Synchrony Financial (SYF) yields a stronger 1.38% dividend with a 11.6% payout ratio, supported by consistent buybacks that enhance total returns. SYF’s distribution combines income and capital return, but its higher financial leverage and lower operating cash flow raise sustainability concerns. For 2026, I favor SYF’s balanced model, delivering superior total shareholder reward through dividends and buybacks, despite slightly higher risk.
Comparative Score Analysis: The Strategic Profile
The radar chart reveals the fundamental DNA and trade-offs of PayPal Holdings and Synchrony Financial, highlighting their strategic financial positioning:
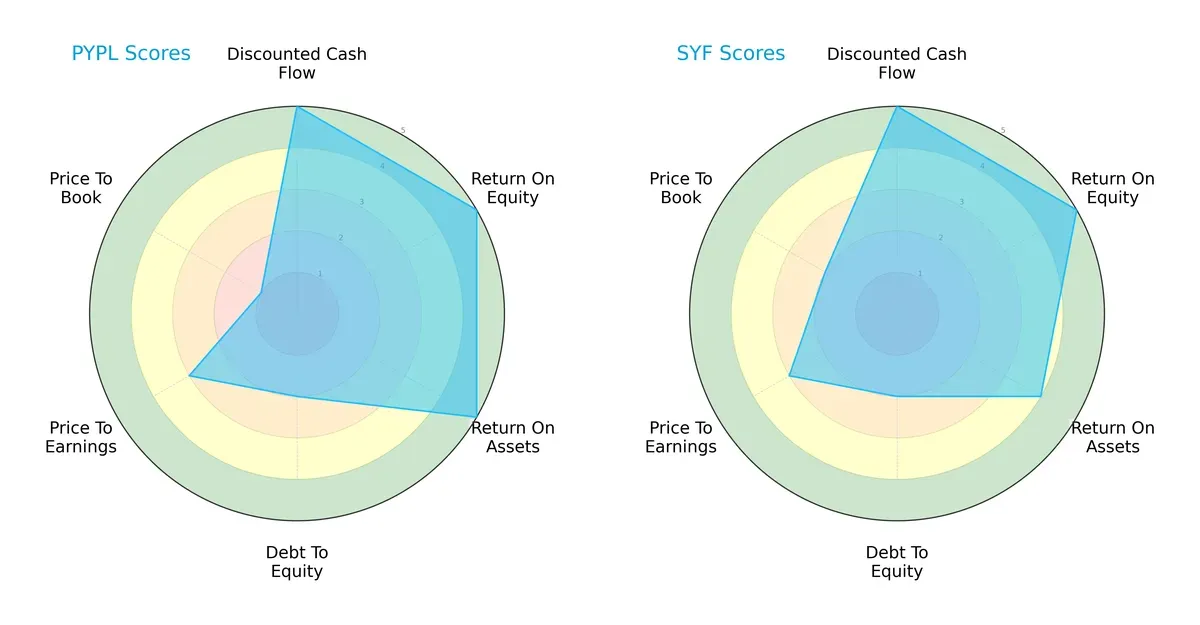
Both firms exhibit strong discounted cash flow and return on equity scores at 5, signaling robust profitability. PayPal edges out with a perfect return on assets score of 5, while Synchrony trails slightly at 4. Both share a moderate debt-to-equity score of 2, indicating comparable leverage risk. PayPal’s valuation scores lag with a price-to-book of 1, suggesting potential overvaluation or asset concerns, whereas Synchrony fares better at 2. Overall, PayPal has a more pronounced operational efficiency edge, while Synchrony presents a slightly more balanced valuation profile.
Bankruptcy Risk: Solvency Showdown
The Altman Z-Score difference underscores a clear solvency gap between the two companies:
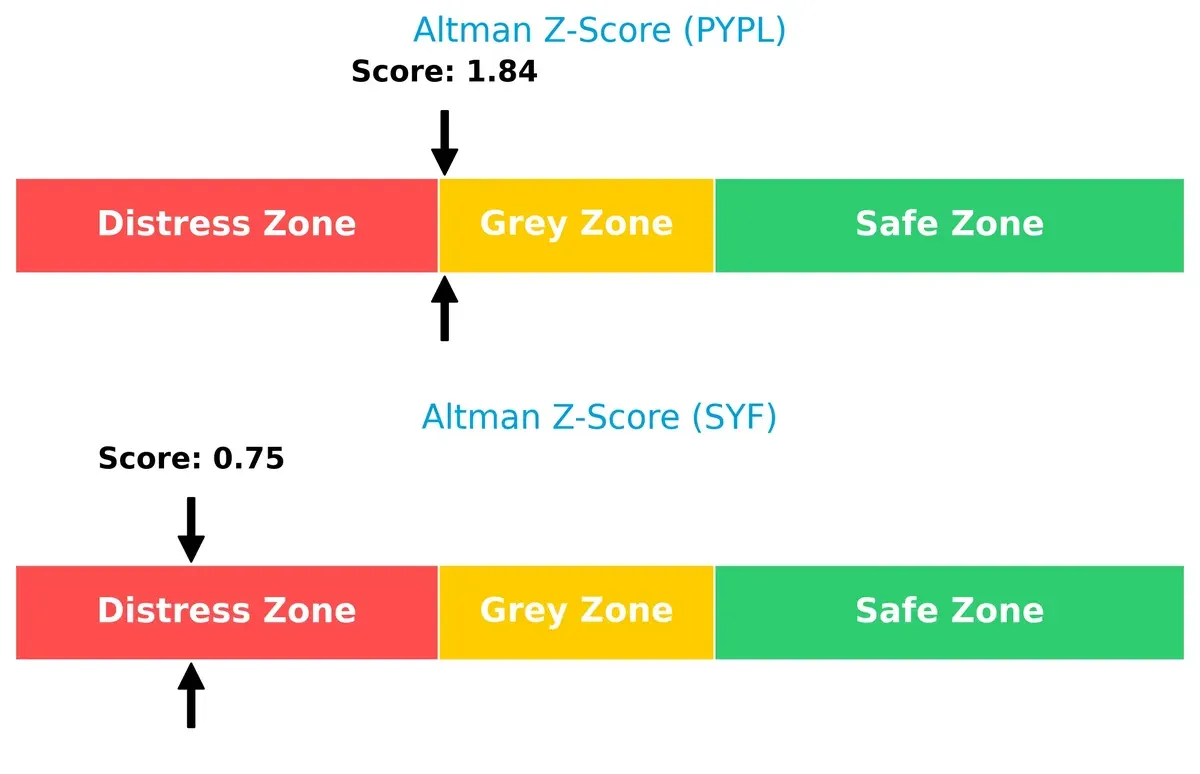
PayPal’s Z-Score sits at 1.84 in the grey zone, indicating moderate bankruptcy risk in this cycle. Synchrony’s 0.75 score places it firmly in distress territory, signaling a higher probability of financial distress or default under stress conditions.
Financial Health: Quality of Operations
Piotroski F-Scores highlight the comparative financial strength and operational quality:
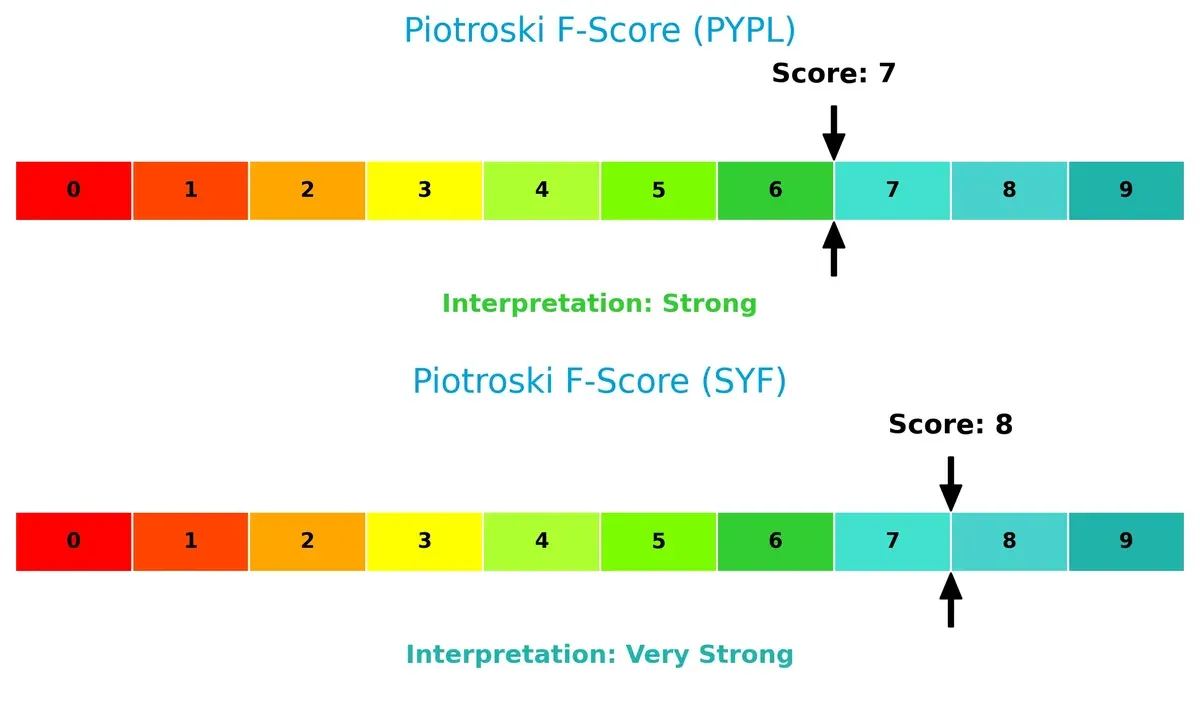
Synchrony scores an 8, reflecting very strong financial health with superior internal metrics. PayPal’s 7 is strong but reveals slight weaknesses relative to Synchrony. The higher score suggests Synchrony maintains better profitability, liquidity, and efficiency fundamentals, providing a more resilient operational base.
How are the two companies positioned?
This section dissects the operational DNA of PayPal and Synchrony by comparing their revenue distribution and internal dynamics. The goal is to confront their economic moats and identify which model delivers the most resilient, sustainable advantage today.
Revenue Segmentation: The Strategic Mix
This visual comparison dissects how PayPal Holdings, Inc. and Synchrony Financial diversify their income streams and where their primary sector bets lie:
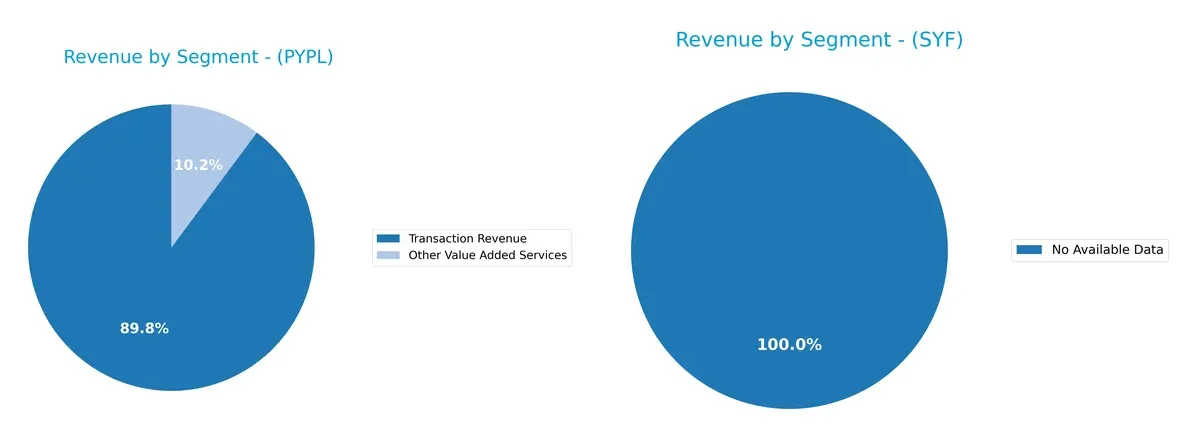
PayPal anchors its revenue in Transaction Revenue, hitting $29.8B in 2025, dwarfing Other Value Added Services at $3.4B. This concentration signals reliance on payment processing but also highlights ecosystem lock-in. Synchrony Financial lacks available data, preventing segmentation comparison. PayPal’s focused mix boosts operational leverage but carries concentration risk if transaction volumes falter. Historically in fintech, such dominance underpins durable competitive moats through network effects.
Strengths and Weaknesses Comparison
This table compares the Strengths and Weaknesses of PayPal Holdings, Inc. and Synchrony Financial:
PayPal Strengths
- Diverse revenue streams with growing transaction and value-added services
- Favorable net margin at 15.78% and ROE at 25.83%
- Strong leverage metrics with low debt-to-assets at 12.46%
- Solid interest coverage ratio at 15.27 supports debt servicing
Synchrony Financial Strengths
- Higher net margin at 17.58% indicates pricing power
- Favorable PE ratio at 8.41 suggests market undervaluation
- Favorable debt-to-assets ratio at 12.75% provides moderate leverage control
- Dividend yield at 1.38% may appeal to income investors
PayPal Weaknesses
- Asset turnover is low at 0.41, indicating less efficient asset use
- Dividend yield of 0.23% is minimal for income-focused investors
- WACC neutral at 9.14%, limiting capital cost advantage
- Current ratio at 1.29 only marginally covers short-term liabilities
Synchrony Financial Weaknesses
- Negative ROIC at -91.64% signals poor capital returns
- WACC high at 14.22%, increasing capital costs
- Current and quick ratios at 0 reveal liquidity risks
- Interest coverage low at 1.73, raising default concerns
- Fixed asset turnover at 0 shows poor fixed asset utilization
Overall, PayPal demonstrates stronger profitability, efficient capital use, and healthier liquidity. Synchrony Financial shows better net margin but faces significant capital return and liquidity challenges. These factors are critical for their strategic financial positioning.
The Moat Duel: Analyzing Competitive Defensibility
A structural moat protects long-term profits from relentless competitive pressures. Without it, profits erode swiftly, leaving only fleeting gains:
PayPal Holdings, Inc.: Network Effects Powerhouse
PayPal’s primary moat lies in powerful network effects linking millions of consumers and merchants. This delivers stable margins around 20% EBIT and growing ROIC. Expansion into new payment solutions in 2026 should deepen this advantage.
Synchrony Financial: Cost-Efficient Credit Platform
Synchrony relies on cost advantages in consumer credit and private label cards, contrasting PayPal’s network moat. However, its declining ROIC signals weakening efficiency. New financing products offer potential, but competition and rising costs threaten growth.
Verdict: Network Effects vs. Cost Advantage in Financial Services
PayPal’s widening moat, demonstrated by its growing ROIC and margin stability, trumps Synchrony’s shrinking value creation. PayPal stands better equipped to defend market share amid intensifying competition.
Which stock offers better returns?
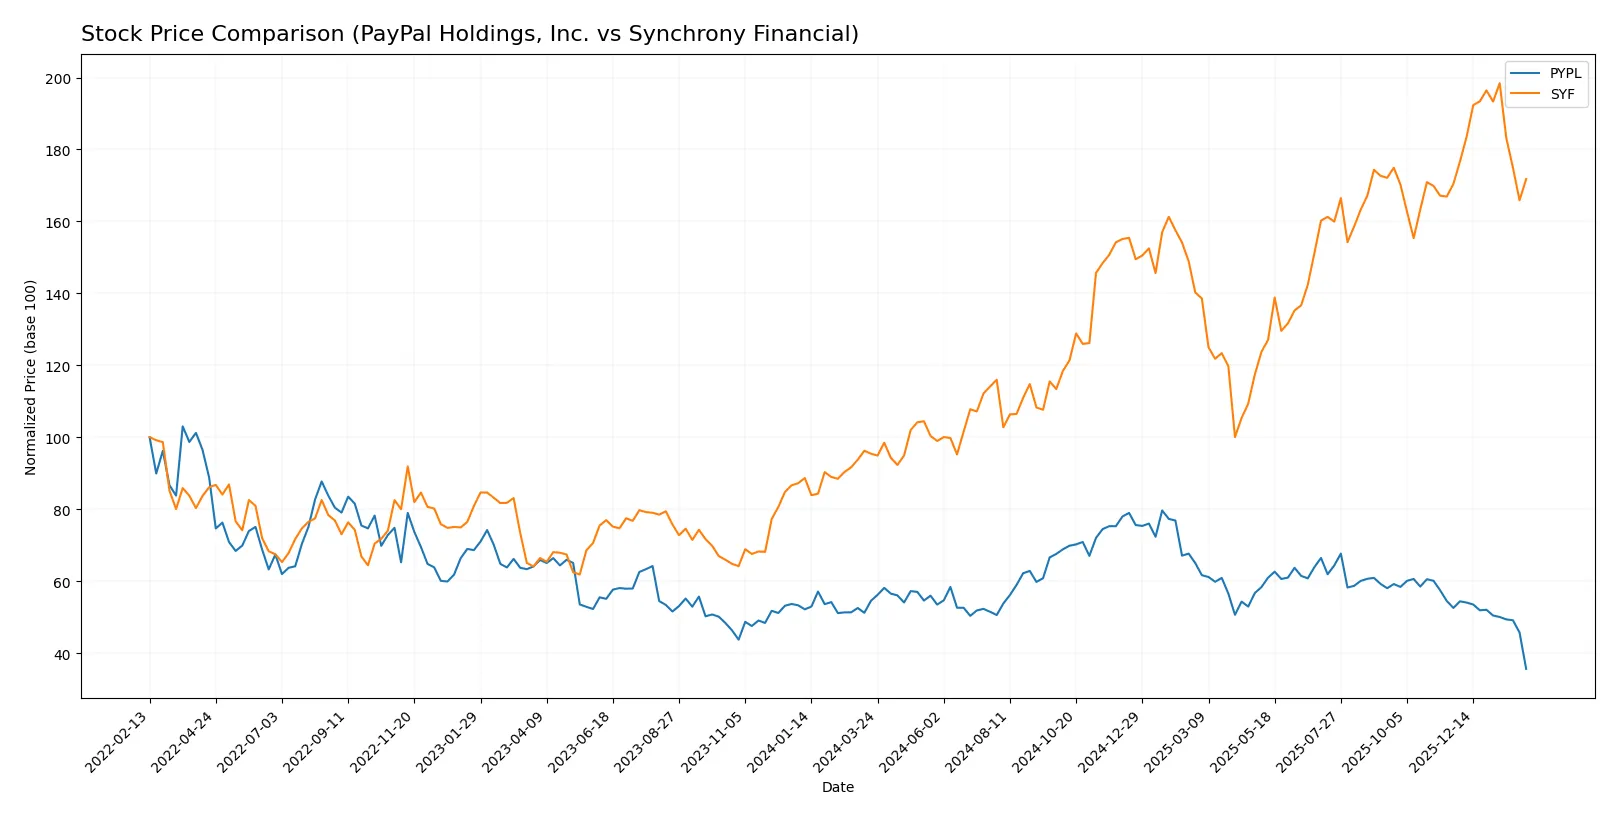
The past year reveals contrasting price dynamics: PayPal’s stock declined sharply, while Synchrony Financial surged significantly before recent stabilization.
Trend Comparison
PayPal Holdings, Inc. shows a bearish trend with a -34.72% price drop over 12 months, decelerating after hitting highs near 92 and lows around 41.
Synchrony Financial exhibits a bullish 80.04% gain over the same period, also decelerating but maintaining price support between 40 and 87.
Synchrony’s strong performance surpasses PayPal’s decline, delivering the highest market return despite recent near-neutral momentum.
Target Prices
Analysts present a mixed but constructive target consensus for PayPal Holdings and Synchrony Financial.
| Company | Target Low | Target High | Consensus |
|---|---|---|---|
| PayPal Holdings, Inc. | 34 | 87 | 53.95 |
| Synchrony Financial | 81 | 100 | 90 |
PayPal’s target consensus exceeds its current price of 41.03 by over 30%, signaling upside potential despite recent volatility. Synchrony’s consensus target of 90 is around 20% above its current 75.22, reflecting analyst confidence in its credit services growth.

Don’t Let Luck Decide Your Entry Point
Optimize your entry points with our advanced ProRealTime indicators. You’ll get efficient buy signals with precise price targets for maximum performance. Start outperforming now!
How do institutions grade them?
The following tables summarize the latest grades assigned to each company by reputable financial institutions:
PayPal Holdings, Inc. Grades
This table lists recent analyst grades for PayPal Holdings, Inc. from leading firms.
| Grading Company | Action | New Grade | Date |
|---|---|---|---|
| JP Morgan | Maintain | Neutral | 2026-02-04 |
| Citizens | Downgrade | Market Perform | 2026-02-04 |
| Morgan Stanley | Maintain | Underweight | 2026-02-04 |
| Goldman Sachs | Maintain | Sell | 2026-02-04 |
| Citigroup | Maintain | Neutral | 2026-02-04 |
| Needham | Maintain | Hold | 2026-02-04 |
| Wells Fargo | Maintain | Equal Weight | 2026-02-04 |
| Canaccord Genuity | Downgrade | Hold | 2026-02-04 |
| Evercore ISI Group | Maintain | In Line | 2026-02-04 |
| BTIG | Maintain | Neutral | 2026-02-03 |
Synchrony Financial Grades
This table displays recent analyst grades for Synchrony Financial from established grading firms.
| Grading Company | Action | New Grade | Date |
|---|---|---|---|
| Truist Securities | Maintain | Hold | 2026-01-29 |
| RBC Capital | Maintain | Sector Perform | 2026-01-28 |
| JP Morgan | Maintain | Neutral | 2026-01-28 |
| BTIG | Maintain | Buy | 2026-01-28 |
| Barclays | Maintain | Overweight | 2026-01-28 |
| JP Morgan | Maintain | Neutral | 2026-01-12 |
| TD Cowen | Maintain | Buy | 2026-01-08 |
| Barclays | Maintain | Overweight | 2026-01-06 |
| Wells Fargo | Maintain | Overweight | 2026-01-05 |
| Keefe, Bruyette & Woods | Maintain | Outperform | 2026-01-02 |
Which company has the best grades?
Synchrony Financial holds a stronger consensus with multiple Buy and Overweight ratings. PayPal’s grades skew Neutral to Sell. This contrast may influence investors favoring higher conviction in Synchrony.
Risks specific to each company
The following categories identify critical pressure points and systemic threats facing both PayPal Holdings, Inc. and Synchrony Financial in the 2026 market environment:
1. Market & Competition
PayPal Holdings, Inc.
- Faces intense competition in digital payments from fintech disruptors and traditional banks expanding digital services.
Synchrony Financial
- Competes in consumer credit with major banks and fintech lenders; growth depends on retail partnerships in a tightening credit environment.
2. Capital Structure & Debt
PayPal Holdings, Inc.
- Maintains moderate leverage with D/E of 0.49 and strong interest coverage at 15.27, indicating financial flexibility.
Synchrony Financial
- Higher leverage with D/E near 0.91 and weak interest coverage of 1.73 raises concerns about debt service capacity under stress.
3. Stock Volatility
PayPal Holdings, Inc.
- Beta of 1.42 suggests higher volatility relative to the S&P 500, reflecting sensitivity to market swings.
Synchrony Financial
- Beta of 1.40 also indicates elevated volatility, typical of financial credit services with economic cycle exposure.
4. Regulatory & Legal
PayPal Holdings, Inc.
- Subject to evolving digital payments regulations globally, including data privacy and anti-money laundering rules.
Synchrony Financial
- Faces regulatory scrutiny on consumer lending practices and compliance with banking regulations impacting credit products.
5. Supply Chain & Operations
PayPal Holdings, Inc.
- Operational risks include platform security, technology disruptions, and maintaining seamless payment processing.
Synchrony Financial
- Reliant on retail partners and third-party brokers; operational risks involve credit underwriting and loan servicing efficiency.
6. ESG & Climate Transition
PayPal Holdings, Inc.
- Increasing pressure to enhance ESG disclosures and integrate climate risk into business strategy, given tech sector scrutiny.
Synchrony Financial
- Faces growing demand for sustainable lending practices and managing credit risk linked to climate-related economic shifts.
7. Geopolitical Exposure
PayPal Holdings, Inc.
- Global digital footprint exposes it to geopolitical risks including cross-border data laws and currency fluctuations.
Synchrony Financial
- Primarily US-focused, limiting direct geopolitical risks but exposed to domestic policy changes and economic cycles.
Which company shows a better risk-adjusted profile?
PayPal’s strongest risk is competitive pressure in a rapidly evolving digital payments landscape. Synchrony’s largest vulnerability lies in its weak capital structure and debt service capacity, indicated by poor interest coverage and low liquidity ratios. PayPal’s healthier leverage and robust interest coverage tilt the risk-adjusted profile in its favor. Notably, Synchrony’s Altman Z-Score of 0.75 signals distress risk, while PayPal remains in the grey zone at 1.84. This financial fragility in Synchrony demands cautious positioning despite its strong Piotroski score.
Final Verdict: Which stock to choose?
PayPal’s superpower lies in its ability to create sustained value through a robust and growing ROIC that outpaces its cost of capital. Its efficient capital allocation fuels innovation in a competitive fintech landscape. A point of vigilance is its modest asset turnover, which could temper growth in capital-intensive environments. This name suits an Aggressive Growth portfolio focused on scalable digital payments.
Synchrony Financial’s strategic moat centers on its strong net margins and steady earnings yield, supported by recurring revenue streams in consumer finance. Compared to PayPal, Synchrony carries more financial risk and a shrinking competitive advantage, reflected in its declining ROIC. It fits well within a GARP (Growth at a Reasonable Price) portfolio where income stability matters more than growth velocity.
If you prioritize sustainable value creation and innovation in digital payments, PayPal outshines Synchrony due to its very favorable moat and solid income growth. However, if you seek higher income yield and are comfortable with greater risk, Synchrony offers better stability in earnings and an attractive valuation. Both choices require careful risk monitoring given market and operational challenges.
Disclaimer: Investment carries a risk of loss of initial capital. The past performance is not a reliable indicator of future results. Be sure to understand risks before making an investment decision.
Go Further
I encourage you to read the complete analyses of PayPal Holdings, Inc. and Synchrony Financial to enhance your investment decisions: