In the dynamic landscape of enterprise software, Workday, Inc. (WDAY) and Paycom Software, Inc. (PAYC) stand out as influential players specializing in cloud-based human capital management and financial applications. Both companies target overlapping markets with innovative SaaS solutions that streamline business operations and workforce management. This comparison will help you understand which company presents a more compelling investment opportunity in 2026. Let’s explore their strengths and growth potential together.
Table of contents
Companies Overview
I will begin the comparison between Workday and Paycom by providing an overview of these two companies and their main differences.
Workday Overview
Workday, Inc. delivers enterprise cloud applications internationally, focusing on financial management, human capital management (HCM), and analytics. Its solutions enable organizations to manage business operations, financial processes, and workforce lifecycle through integrated cloud software. Workday serves diverse industries including professional services, healthcare, education, and retail, positioning itself as a comprehensive platform for business and HR management with a market cap near 50B USD.
Paycom Overview
Paycom Software, Inc. offers cloud-based human capital management software primarily for small to mid-sized U.S. companies. Its SaaS platform covers talent acquisition, payroll, time and labor management, and compliance functionalities. With a market cap of about 8.3B USD, Paycom emphasizes automation and analytics to streamline the entire employment lifecycle, focusing on user-friendly interfaces and mobile accessibility to enhance workforce management efficiency.
Key similarities and differences
Both Workday and Paycom operate in the software application industry with cloud-based human capital management solutions, targeting workforce lifecycle management. Workday provides a broader enterprise platform including financial management and analytics for various industries, while Paycom specializes in HCM for smaller U.S. businesses with a strong payroll and compliance focus. Workday’s scale and diverse offerings contrast with Paycom’s niche market and feature-specific approach, reflected in their differing market caps and employee counts.
Income Statement Comparison
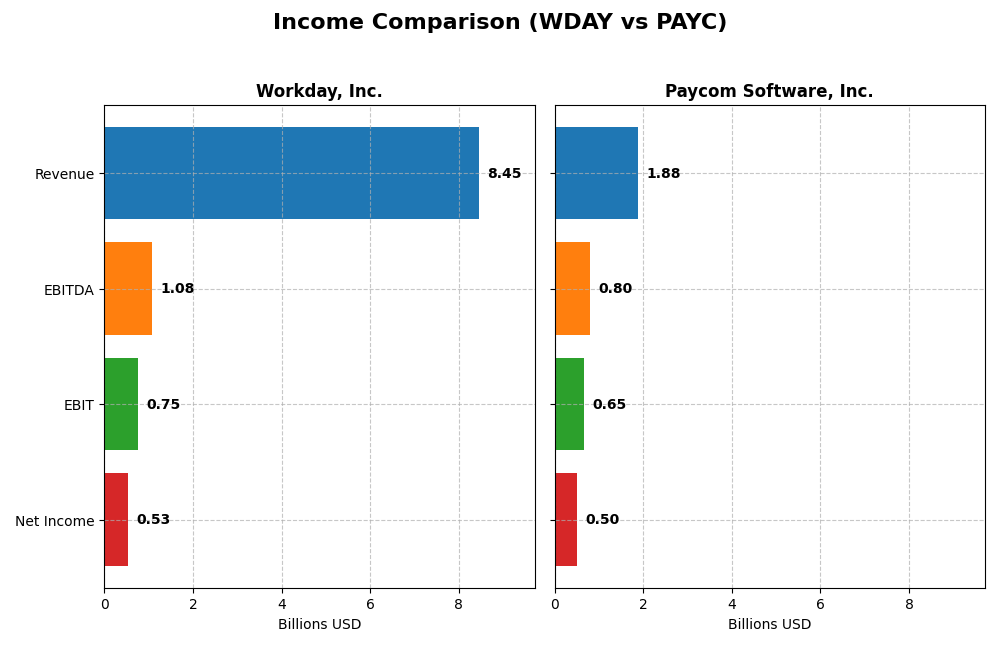
This table presents a side-by-side comparison of key income statement metrics for Workday, Inc. and Paycom Software, Inc. for their most recent fiscal years.
| Metric | Workday, Inc. (WDAY) | Paycom Software, Inc. (PAYC) |
|---|---|---|
| Market Cap | 49.9B | 8.3B |
| Revenue | 8.45B | 1.88B |
| EBITDA | 1.08B | 798M |
| EBIT | 752M | 652M |
| Net Income | 526M | 502M |
| EPS | 1.98 | 8.93 |
| Fiscal Year | 2025 | 2024 |
Income Statement Interpretations
Workday, Inc.
Workday’s revenue nearly doubled from 4.3B in 2021 to 8.4B in 2025, with net income showing a strong rebound from losses in early years to 526M in 2025. Gross margins remained favorable at 75.5%, while EBIT margins were neutral at 8.9%. Despite a 16.4% revenue increase in 2025, net margin declined sharply, indicating margin pressures or cost increases.
Paycom Software, Inc.
Paycom exhibited consistent revenue growth, rising from 841M in 2020 to 1.88B in 2024, with net income growing steadily to 502M. Gross and net margins were robust at 82.2% and 26.7%, respectively, while EBIT margins improved to 34.6%. The latest year showed solid growth in revenue and net margin, with a 51.7% rise in EPS, underscoring operational efficiency gains.
Which one has the stronger fundamentals?
Paycom demonstrates stronger fundamentals with consistently higher margins and fully favorable income statement evaluations, including net margin and EPS growth. Workday shows impressive top-line growth but faces margin compression and mixed earnings performance in the latest year. Overall, Paycom’s stable profitability and margin expansion suggest more favorable income statement health.
Financial Ratios Comparison
The table below presents a side-by-side comparison of key financial ratios for Workday, Inc. (WDAY) and Paycom Software, Inc. (PAYC) based on their most recent fiscal year data.
| Ratios | Workday, Inc. (WDAY) FY 2025 | Paycom Software, Inc. (PAYC) FY 2024 |
|---|---|---|
| ROE | 5.82% | 31.85% |
| ROIC | 2.73% | 24.86% |
| P/E | 132.15 | 22.95 |
| P/B | 7.69 | 7.31 |
| Current Ratio | 1.85 | 1.10 |
| Quick Ratio | 1.85 | 1.10 |
| D/E (Debt-to-Equity) | 0.37 | 0.05 |
| Debt-to-Assets | 18.70% | 1.42% |
| Interest Coverage | 3.64 | 186.56 |
| Asset Turnover | 0.47 | 0.32 |
| Fixed Asset Turnover | 5.36 | 2.93 |
| Payout ratio | 0 | 16.89% |
| Dividend yield | 0 | 0.74% |
Interpretation of the Ratios
Workday, Inc.
Workday shows a mixed ratio profile with favorable liquidity and leverage metrics, including a solid current ratio of 1.85 and debt-to-equity at 0.37, but unfavorable profitability ratios such as a low ROE of 5.82% and ROIC of 2.73%. Its valuation ratios, including a high P/E of 132.15, also raise concerns. The company does not pay dividends, likely focusing on reinvestment and growth.
Paycom Software, Inc.
Paycom exhibits strong profitability ratios, with a net margin of 26.66%, ROE of 31.85%, and ROIC of 24.86%, alongside favorable leverage indicators like a low debt-to-assets ratio of 1.42%. Although its P/B ratio is somewhat high at 7.31, the overall assessment is positive. Paycom pays dividends with a modest 0.74% yield, supported by stable free cash flow.
Which one has the best ratios?
Paycom Software presents a more favorable ratio set overall, particularly in profitability and leverage, compared to Workday’s mixed results with weaker returns and expensive valuation. While both companies have some unfavorable metrics, Paycom’s stronger earnings and dividend support contribute to its more positive financial profile.
Strategic Positioning
This section compares the strategic positioning of Workday, Inc. and Paycom Software, Inc. across market position, key segments, and exposure to technological disruption:
Workday, Inc.
- Large market cap near 50B; faces significant competitive pressure in enterprise cloud applications.
- Focuses on enterprise cloud apps with strong financial management and HCM suites driving subscription revenue.
- Incorporates machine learning and augmented analytics to enhance application insights and automation.
Paycom Software, Inc.
- Smaller market cap around 8.3B; competes in SaaS HCM mainly for small to mid-sized US companies.
- Concentrated on cloud-based HCM SaaS solutions with payroll, talent management, and labor management.
- Uses proprietary Bluetooth tech and analytics but limited indication of broader technological disruption.
Workday, Inc. vs Paycom Software, Inc. Positioning
Workday has a diversified product suite serving multiple industries with a strong subscription base, while Paycom concentrates on cloud HCM for smaller firms. Workday’s broader approach offers scale but faces intense competition; Paycom’s niche focus may limit market size but enhances specialization.
Which has the best competitive advantage?
Paycom demonstrates a very favorable moat with ROIC exceeding WACC and growing profitability, indicating a durable competitive advantage. Workday, however, shows a slightly unfavorable moat, shedding value despite improving returns, suggesting weaker competitive durability.
Stock Comparison
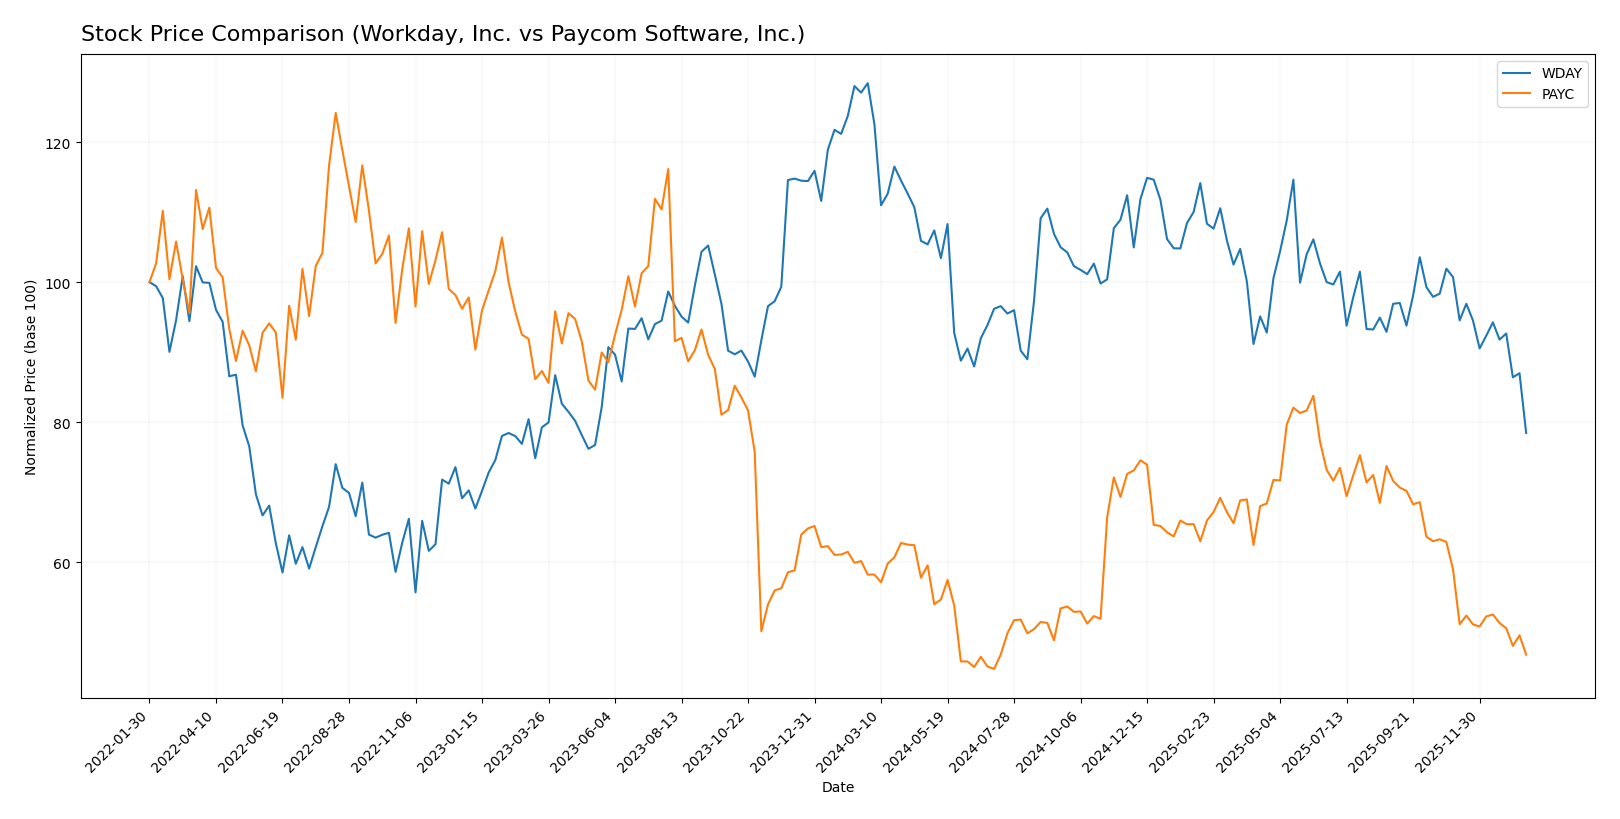
The past year has seen significant declines in both Workday, Inc. (WDAY) and Paycom Software, Inc. (PAYC) stocks, with persistent bearish trends and decelerating price movements highlighting challenging trading dynamics.
Trend Analysis
Workday, Inc. (WDAY) experienced a bearish trend over the past 12 months with a price decrease of -38.91%. The trend shows deceleration, with notable volatility at a standard deviation of 20.22, and prices ranging from 186.86 to 305.88.
Paycom Software, Inc. (PAYC) also showed a bearish trend over the last year, falling -19.64%. The trend is decelerating, with higher volatility at 31.92 standard deviation, and prices fluctuated between 141.96 and 265.71.
Comparing the two, PAYC delivered a smaller decline than WDAY, indicating better market performance during the period despite both trends being bearish and decelerating.
Target Prices
Here is the current analyst target price consensus for selected software companies.
| Company | Target High | Target Low | Consensus |
|---|---|---|---|
| Workday, Inc. | 320 | 235 | 274.47 |
| Paycom Software, Inc. | 290 | 165 | 215 |
Analysts expect Workday’s stock to appreciate significantly from the current 186.86 USD, while Paycom’s consensus target also suggests notable upside potential from 148.41 USD. This indicates a generally positive market outlook.
Analyst Opinions Comparison
This section compares analysts’ ratings and grades for Workday, Inc. (WDAY) and Paycom Software, Inc. (PAYC):
Rating Comparison
WDAY Rating
- Rating: B-, considered very favorable overall.
- Discounted Cash Flow Score: 4, indicating a favorable valuation based on cash flow projections.
- ROE Score: 3, a moderate measure of profit efficiency from shareholders’ equity.
- ROA Score: 3, moderate effectiveness in asset utilization for earnings.
- Debt To Equity Score: 2, moderate financial risk with some reliance on debt.
- Overall Score: 2, reflecting moderate overall financial standing.
PAYC Rating
- Rating: A, considered very favorable overall.
- Discounted Cash Flow Score: 5, indicating a very favorable valuation.
- ROE Score: 5, a very favorable indicator of profit generation efficiency.
- ROA Score: 5, very favorable asset utilization for earnings.
- Debt To Equity Score: 4, favorable balance sheet with relatively lower debt risk.
- Overall Score: 4, indicating a favorable overall financial health.
Which one is the best rated?
Based on the provided data, PAYC holds superior ratings and scores across all key financial metrics, including overall score, DCF, ROE, ROA, and debt-to-equity, compared to WDAY’s moderate ratings.
Scores Comparison
Here is a comparison of the financial health scores of Workday and Paycom Software:
WDAY Scores
- Altman Z-Score: 4.41, indicating a strong safety zone from bankruptcy risk.
- Piotroski Score: 6, reflecting average financial strength and value potential.
PAYC Scores
- Altman Z-Score: 3.84, also in the safe zone, showing low bankruptcy risk.
- Piotroski Score: 5, indicating average financial health and investment quality.
Which company has the best scores?
Based strictly on the data, WDAY has a higher Altman Z-Score and Piotroski Score than PAYC, suggesting comparatively stronger financial stability and health.
Grades Comparison
Here is a detailed comparison of recent grades from reputable grading companies for both Workday, Inc. and Paycom Software, Inc.:
Workday, Inc. Grades
This table summarizes the latest analyst grades and actions for Workday, Inc.:
| Grading Company | Action | New Grade | Date |
|---|---|---|---|
| Barclays | maintain | Overweight | 2026-01-12 |
| RBC Capital | maintain | Outperform | 2026-01-05 |
| TD Cowen | maintain | Buy | 2025-11-26 |
| DA Davidson | maintain | Neutral | 2025-11-26 |
| Wells Fargo | maintain | Overweight | 2025-11-26 |
| Barclays | maintain | Overweight | 2025-11-26 |
| Keybanc | maintain | Overweight | 2025-11-26 |
| Citigroup | maintain | Neutral | 2025-11-26 |
| JP Morgan | maintain | Overweight | 2025-11-26 |
| UBS | maintain | Neutral | 2025-11-26 |
Overall, Workday’s analyst grades predominantly indicate a positive outlook, with a majority of “Overweight,” “Outperform,” and “Buy” ratings, reflecting confidence in the stock’s performance.
Paycom Software, Inc. Grades
This table details the most recent analyst grades and actions for Paycom Software, Inc.:
| Grading Company | Action | New Grade | Date |
|---|---|---|---|
| Barclays | maintain | Equal Weight | 2026-01-12 |
| TD Cowen | maintain | Buy | 2026-01-08 |
| Citigroup | maintain | Neutral | 2025-12-23 |
| Keybanc | maintain | Overweight | 2025-11-06 |
| TD Cowen | maintain | Buy | 2025-11-06 |
| UBS | maintain | Buy | 2025-11-06 |
| Jefferies | maintain | Hold | 2025-11-06 |
| JP Morgan | maintain | Neutral | 2025-11-06 |
| Mizuho | maintain | Neutral | 2025-11-06 |
| Barclays | maintain | Equal Weight | 2025-11-06 |
The grades for Paycom show a mixed trend with several “Buy” and “Overweight” ratings but also a significant number of “Neutral,” “Hold,” and “Equal Weight,” indicating a more cautious analyst stance.
Which company has the best grades?
Workday, Inc. has received stronger and more consistent grades with numerous “Overweight” and “Buy” ratings, while Paycom Software, Inc. shows a more balanced mix with fewer positive standout ratings. This suggests that analysts generally have greater confidence in Workday’s near-term growth prospects, which could influence investor sentiment and portfolio positioning.
Strengths and Weaknesses
Below is a comparative overview of the key strengths and weaknesses of Workday, Inc. (WDAY) and Paycom Software, Inc. (PAYC) based on recent financial and strategic data.
| Criterion | Workday, Inc. (WDAY) | Paycom Software, Inc. (PAYC) |
|---|---|---|
| Diversification | Moderate: Revenue mainly from subscription services (7.72B in 2025) with smaller professional services segment (728M). | Limited: Highly focused on recurring revenue (1.73B in 2024) with small implementation services (24M). |
| Profitability | Lower net margin (6.23%), ROIC (2.73%) below WACC, indicating value destruction but improving trend. | High net margin (26.66%) and ROIC (24.86%) significantly above WACC, strong value creation. |
| Innovation | Growing ROIC trend suggests improving operational efficiency and innovation potential despite current value shedding. | Durable competitive advantage with very favorable moat status and growing profitability. |
| Global presence | Large global presence supported by substantial subscription services, but weaker asset turnover (0.47). | Smaller asset turnover (0.32) reflecting focused market niche, but excellent interest coverage (191.88). |
| Market Share | Strong in enterprise software with expanding subscription base. | Solid position in payroll software with consistent recurring revenue growth. |
In summary, Paycom demonstrates stronger profitability and a durable competitive advantage, making it a more favorable investment choice. Workday shows improving profitability but currently struggles with value destruction, warranting cautious monitoring.
Risk Analysis
Below is a comparative table highlighting key risks for Workday, Inc. (WDAY) and Paycom Software, Inc. (PAYC) as of the most recent fiscal years:
| Metric | Workday, Inc. (WDAY) | Paycom Software, Inc. (PAYC) |
|---|---|---|
| Market Risk | Beta 1.14, moderate volatility with NASDAQ tech exposure | Beta 0.82, lower volatility, NYSE listed |
| Debt level | Debt-to-Equity 0.37, moderate leverage | Debt-to-Equity 0.05, very low leverage |
| Regulatory Risk | Moderate, due to enterprise software compliance requirements | Moderate, focused on US HCM regulations |
| Operational Risk | Larger scale with 20.5K employees, complexity risk | Smaller scale with 7.3K employees, less complexity |
| Environmental Risk | Low direct impact, mostly software service | Low direct impact, software-based operations |
| Geopolitical Risk | Exposure to international markets, moderate risk | Primarily US market, lower geopolitical exposure |
Workday faces moderate market risk with higher leverage and international exposure, which may affect stability amid global uncertainties. Paycom shows stronger financial health with very low debt and less market volatility, though both companies share regulatory and operational risks typical in software services.
Which Stock to Choose?
Workday, Inc. (WDAY) shows favorable income growth with a 16.35% revenue increase in 2025 and solid gross margins at 75.5%. Its financial ratios present a mixed picture: favorable liquidity and debt metrics but unfavorable returns on equity (5.82%) and invested capital (2.73%). The company has a moderate rating with a B- grade and a slightly unfavorable economic moat, indicating value erosion despite rising profitability.
Paycom Software, Inc. (PAYC) demonstrates strong financial health with consistent favorable income metrics, including a 11.19% revenue growth in 2024 and a robust net margin of 26.66%. Its financial ratios are largely favorable, with high returns on equity (31.85%) and invested capital (24.86%), low debt, and a very favorable moat. The company holds an A rating, reflecting strong operational efficiency and value creation.
Investors prioritizing growth and high profitability might find PAYC’s strong returns and favorable rating appealing, whereas those seeking a company with improving profitability but some financial concerns could view WDAY’s evolving performance as indicative of potential. The differing risk profiles and financial strengths suggest that the choice may depend on individual investment strategies and risk tolerance.
Disclaimer: Investment carries a risk of loss of initial capital. The past performance is not a reliable indicator of future results. Be sure to understand risks before making an investment decision.
Go Further
I encourage you to read the complete analyses of Workday, Inc. and Paycom Software, Inc. to enhance your investment decisions: