Home > Comparison > Technology > U vs PAYC
The strategic rivalry between Unity Software Inc. and Paycom Software, Inc. shapes the trajectory of the technology sector. Unity operates a real-time 3D content platform, focusing on interactive media and gaming, while Paycom delivers cloud-based human capital management solutions for mid-sized firms. This analysis pits innovative growth against operational scalability, aiming to identify which company offers a superior risk-adjusted return for diversified portfolios in a competitive software landscape.
Table of contents
Companies Overview
Unity Software Inc. and Paycom Software, Inc. stand as pivotal players in the software application market, each commanding a unique niche.
Unity Software Inc.: Leader in Interactive Real-Time 3D Content
Unity Software Inc. defines itself as a platform provider for real-time 3D content creation. Its core revenue stems from licensing software to developers across gaming, AR, VR, and other industries. In 2026, Unity focuses strategically on expanding its ecosystem and monetization tools to support creators worldwide.
Paycom Software, Inc.: Innovator in Cloud-Based HCM Solutions
Paycom Software, Inc. operates as a cloud-based human capital management (HCM) provider for small to mid-sized U.S. businesses. It generates revenue through SaaS offerings that streamline recruitment, payroll, and workforce management. Its 2026 strategy emphasizes enhancing analytics and expanding feature sets for comprehensive employee lifecycle management.
Strategic Collision: Similarities & Divergences
Both companies emphasize software-as-a-service models, yet Unity pursues an open content creation ecosystem while Paycom offers a closed, integrated HCM platform. Their main battleground is market share within specialized software sectors: interactive media versus enterprise HR solutions. Investors will find Unity’s growth tied to innovation in real-time content, contrasting with Paycom’s stable cash flow from recurring enterprise contracts.
Income Statement Comparison
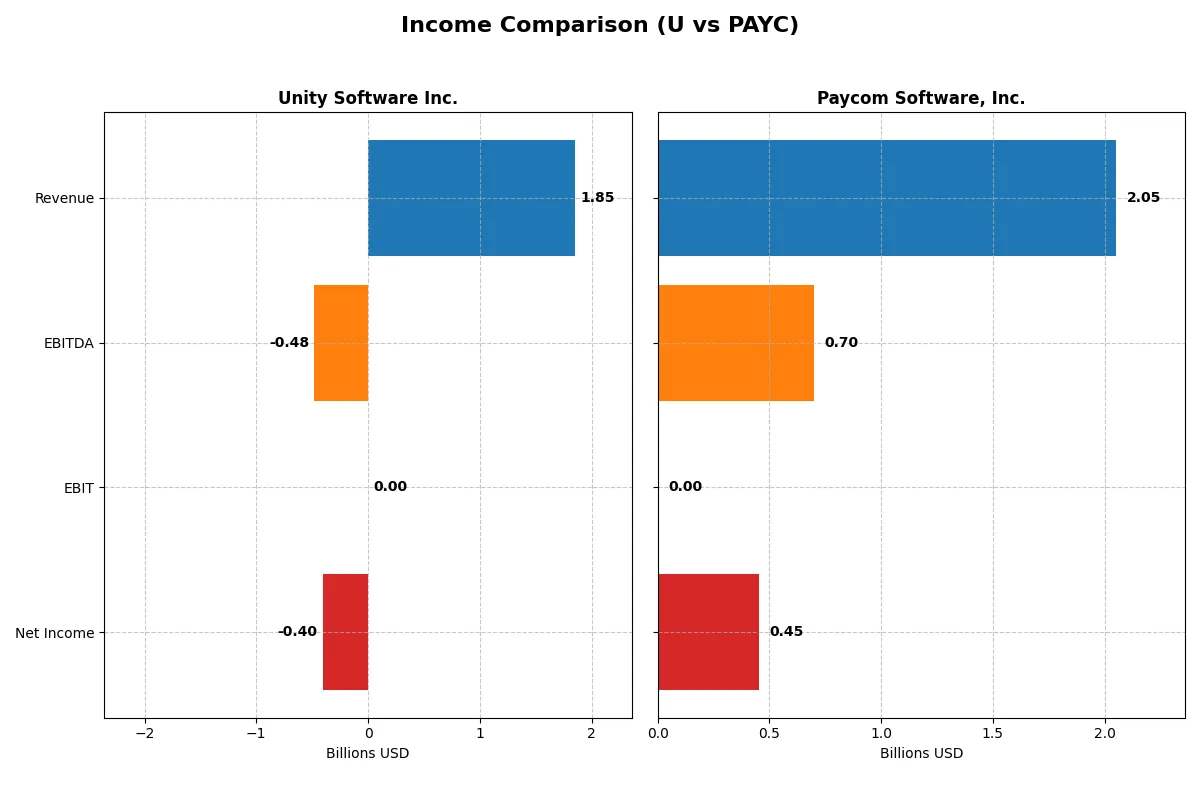
This data dissects the core profitability and scalability of both corporate engines to reveal who dominates the bottom line:
| Metric | Unity Software Inc. (U) | Paycom Software, Inc. (PAYC) |
|---|---|---|
| Revenue | 1.85B | 2.05B |
| Cost of Revenue | 478M | 345M |
| Operating Expenses | 1.85B | 1.05B |
| Gross Profit | 1.37B | 1.71B |
| EBITDA | -479M | 698M |
| EBIT | 0 | 0 |
| Interest Expense | -24M | -3.4M |
| Net Income | -403M | 453M |
| EPS | -0.96 | 8.13 |
| Fiscal Year | 2025 | 2025 |
Income Statement Analysis: The Bottom-Line Duel
This income statement comparison reveals which company converts revenues into profits most efficiently and sustainably.
Unity Software Inc. Analysis
Unity Software’s revenue grew steadily from 1.1B in 2021 to 1.85B in 2025, showing a 66.6% rise over five years. Despite a strong gross margin near 74%, the company consistently posted net losses, though the net margin improved from -48% in 2021 to -21.8% in 2025. This reflects improving cost control but ongoing operating inefficiency.
Paycom Software, Inc. Analysis
Paycom’s revenue nearly doubled from 1.06B in 2021 to 2.05B in 2025, with a robust gross margin above 83%. The company maintains positive net income, though net margin slightly decreased to 22.1% in 2025 from a peak earlier. Paycom’s scale and profitability highlight operational strength despite minor margin compression.
Verdict: Growth Struggles vs. Profitable Expansion
Unity Software shows promising revenue growth and margin recovery but remains unprofitable, signaling a riskier turnaround. Paycom delivers strong revenue growth coupled with sustained profitability and superior margins. For investors prioritizing earnings quality, Paycom’s profile offers a clearer path to value realization.
Financial Ratios Comparison
These vital ratios act as a diagnostic tool to expose the underlying fiscal health, valuation premiums, and capital efficiency of the companies compared below:
| Ratios | Unity Software Inc. (U) | Paycom Software, Inc. (PAYC) |
|---|---|---|
| ROE | -12.4% | 31.9% |
| ROIC | -8.2% | 24.9% |
| P/E | -46.2 | 19.6 |
| P/B | 5.74 | — |
| Current Ratio | 1.84 | — |
| Quick Ratio | 1.84 | — |
| D/E | 0.69 | — |
| Debt-to-Assets | 32.7% | — |
| Interest Coverage | 19.95 | -166.8 |
| Asset Turnover | 0.27 | 0 |
| Fixed Asset Turnover | 27.09 | 0 |
| Payout Ratio | 0 | 18.7% |
| Dividend Yield | 0 | 0.95% |
| Fiscal Year | 2025 | 2025 |
Efficiency & Valuation Duel: The Vital Signs
Financial ratios serve as a company’s DNA, exposing hidden risks and revealing operational strengths critical to investor decisions.
Unity Software Inc.
Unity displays deeply negative profitability with a -12.44% ROE and -21.78% net margin, signaling operational struggles. Its valuation appears stretched, with a high 5.74 price-to-book ratio despite a favorable negative P/E due to losses. Unity does not pay dividends, instead heavily reinvesting in R&D, which consumes over 50% of revenue, aiming for future growth.
Paycom Software, Inc.
Paycom reports a solid 22.1% net margin, indicating strong profitability, but lacks reported ROE and ROIC data for 2025, leaving some uncertainty. Its valuation is moderate with a neutral 19.61 P/E and a favorable zero price-to-book ratio. Paycom offers a modest 0.95% dividend yield, balancing shareholder returns with cautious capital allocation.
Profitability Headwinds vs. Steady Earnings: Paycom’s Operational Edge
Both companies face unfavorable overall ratio evaluations, but Paycom’s positive net margin and dividend provide clearer profitability compared to Unity’s persistent losses and heavy reinvestment. Paycom offers a more balanced risk-reward profile for income-focused investors, while Unity fits those prioritizing growth despite operational challenges.
Which one offers the Superior Shareholder Reward?
I compare Unity Software Inc. (U) and Paycom Software, Inc. (PAYC) on dividends, payout ratios, and buybacks for 2026. Unity pays no dividend, reinvesting in growth with zero payout and negative net margins. Paycom yields 0.95%, with a 19% payout ratio, supported by strong 22% net margins. Paycom’s buybacks complement dividends, enhancing total return. Unity lacks buybacks, relying on R&D and expansion, which may delay shareholder reward. Given Paycom’s sustainable free cash flow and balanced capital allocation, I see PAYC offering superior total shareholder reward in 2026.
Comparative Score Analysis: The Strategic Profile
The radar chart reveals the fundamental DNA and trade-offs of Unity Software Inc. and Paycom Software, Inc., highlighting their financial strengths and weaknesses:
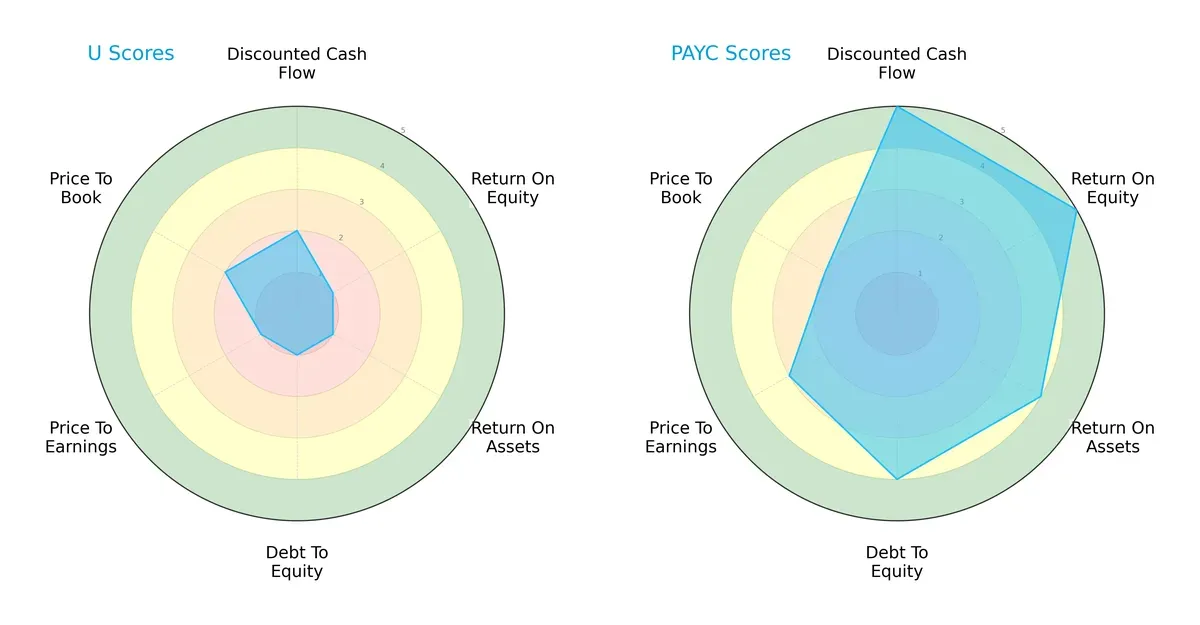
Paycom dominates across most dimensions, boasting very favorable scores in DCF (5), ROE (5), and ROA (4). Its debt-to-equity score (4) signals prudent balance sheet management. Unity lags with uniformly weak scores, especially in profitability and leverage metrics (all 1s or 2s). Paycom’s profile is more balanced, while Unity relies on minimal valuation edge (P/B score 2) but suffers from poor operational efficiency and financial risk.
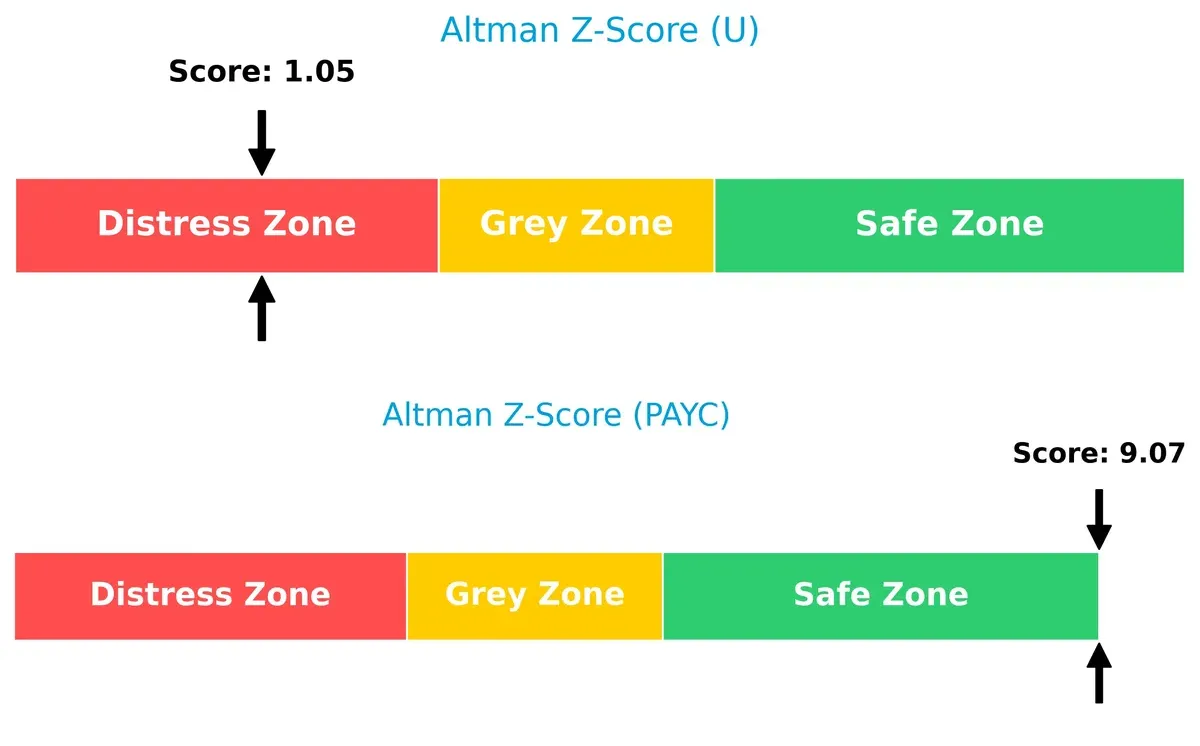
Bankruptcy Risk: Solvency Showdown
Paycom’s Altman Z-Score of 9.07 places it firmly in the safe zone, indicating strong long-term survival prospects. Unity’s score of 1.05 signals distress, raising red flags about its financial stability and bankruptcy risk in this cycle:
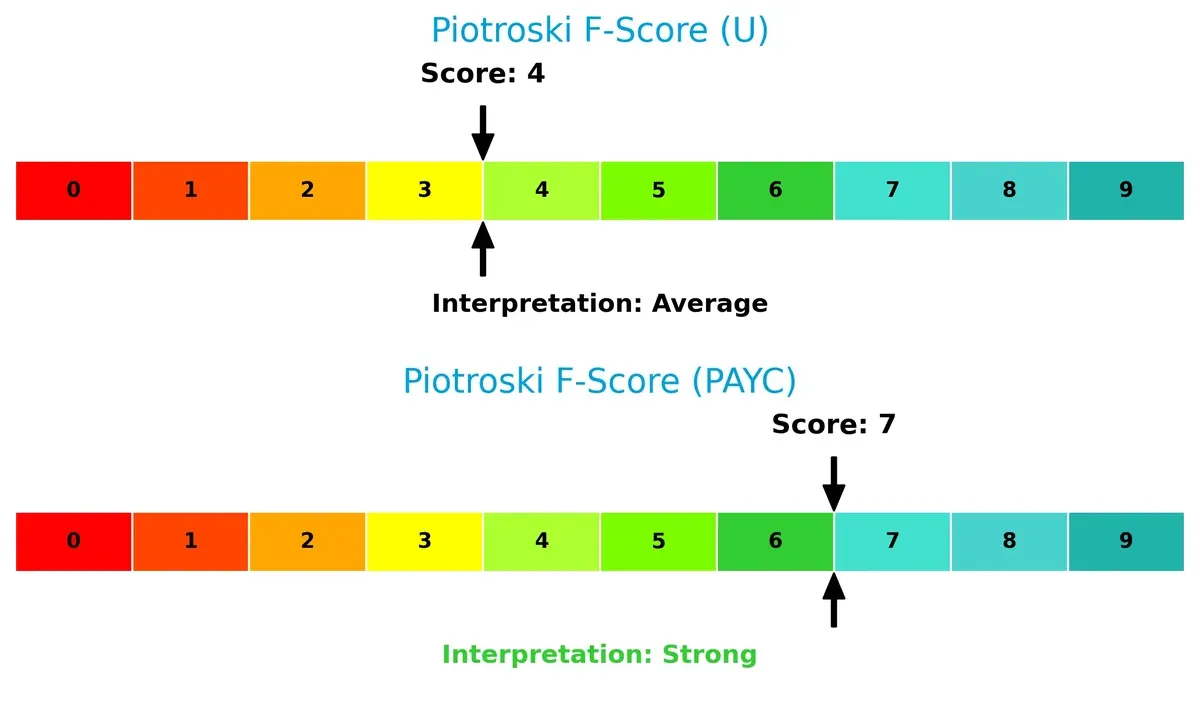
Financial Health: Quality of Operations
Paycom scores a robust 7 on the Piotroski F-Score, reflecting strong internal financial health and operational quality. Unity’s 4 signals average performance with potential red flags in profitability and efficiency metrics:
How are the two companies positioned?
This section dissects Unity and Paycom’s operational DNA by comparing revenue distribution and internal strengths and weaknesses. The goal is to confront their economic moats to reveal which model delivers the most resilient, sustainable competitive advantage today.
Revenue Segmentation: The Strategic Mix
The following visual comparison dissects how Unity Software Inc. and Paycom Software, Inc. diversify their income streams and where their primary sector bets lie:
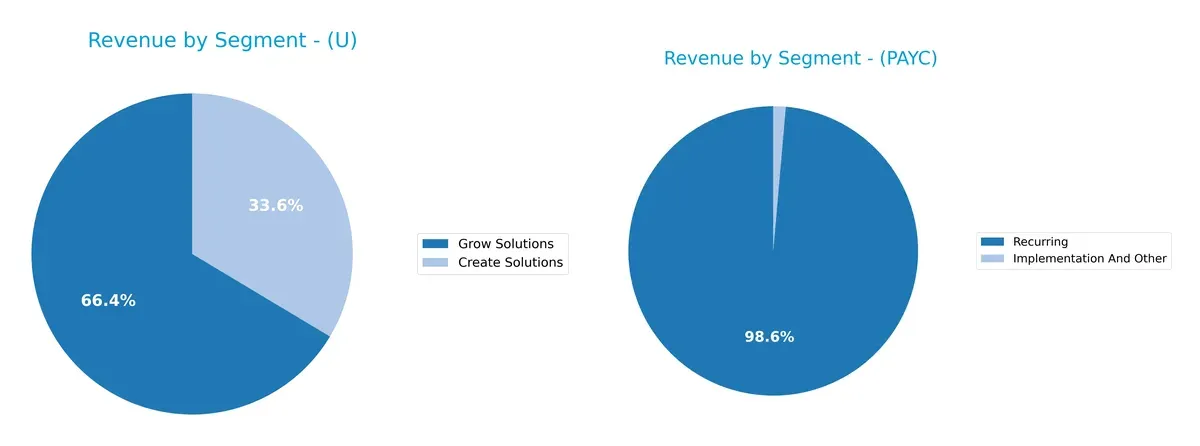
Unity Software shows a balanced split between Create Solutions ($621M) and Grow/Operate Solutions ($1.23B), signaling a dual focus on content creation and platform growth. Paycom relies heavily on Recurring revenue ($1.73B) with minimal Implementation income ($24M), reflecting deep client lock-in through subscription models. Unity’s diversified approach reduces concentration risk, while Paycom’s dominance in recurring revenue underlines infrastructure control but exposes it to retention challenges.
Strengths and Weaknesses Comparison
This table compares the strengths and weaknesses of Unity Software Inc. and Paycom Software, Inc.:
Unity Software Inc. Strengths
- Diversified revenue across Create and Grow Solutions
- Solid global presence with strong US and EMEA sales
- Favorable liquidity ratios indicate financial stability
Paycom Software, Inc. Strengths
- Strong profitability with 22.1% net margin
- Favorable debt metrics with zero debt
- Recurring revenue dominates, ensuring predictable cash flow
Unity Software Inc. Weaknesses
- Negative profitability ratios including net margin and ROE
- High price-to-book ratio suggests overvaluation
- Weak interest coverage and asset turnover
Paycom Software, Inc. Weaknesses
- Unfavorable liquidity ratios with current and quick ratio at zero
- Lack of global revenue data limits diversification assessment
- Negative interest coverage and asset turnover
Unity’s strengths lie in diversification and global reach but face profitability and valuation challenges. Paycom exhibits strong profitability and low debt but risks stem from liquidity issues and limited geographic diversification. Both companies show unfavorable overall financial metrics, highlighting areas requiring strategic attention.
The Moat Duel: Analyzing Competitive Defensibility
A structural moat is the only true shield protecting long-term profits from relentless competitive erosion in dynamic markets:
Unity Software Inc.: Network Effects and Platform Stickiness
Unity’s moat stems from strong network effects; its 3D content platform locks in developers and creators. This translates to stable gross margins near 74%. Despite current net losses, rising profitability signals moat resilience. Expansion into AR/VR markets in 2026 could deepen its competitive edge.
Paycom Software, Inc.: Intangible Assets and Scale Economies
Paycom’s moat lies in its comprehensive HCM SaaS suite and intangible software assets. It commands robust gross margins above 83% and positive net margins near 22%. However, recent ROIC trends decline, signaling pressure. Growth opportunities in analytics and compliance tools offer potential to sustain its lead.
Network Effects vs. Intangible Assets: The Moat Showdown
Unity’s growing ROIC and expanding platform network provide a deeper moat despite current losses. Paycom’s intangible assets generate strong profitability but face ROIC erosion. I see Unity better positioned to defend market share amid evolving tech landscapes.
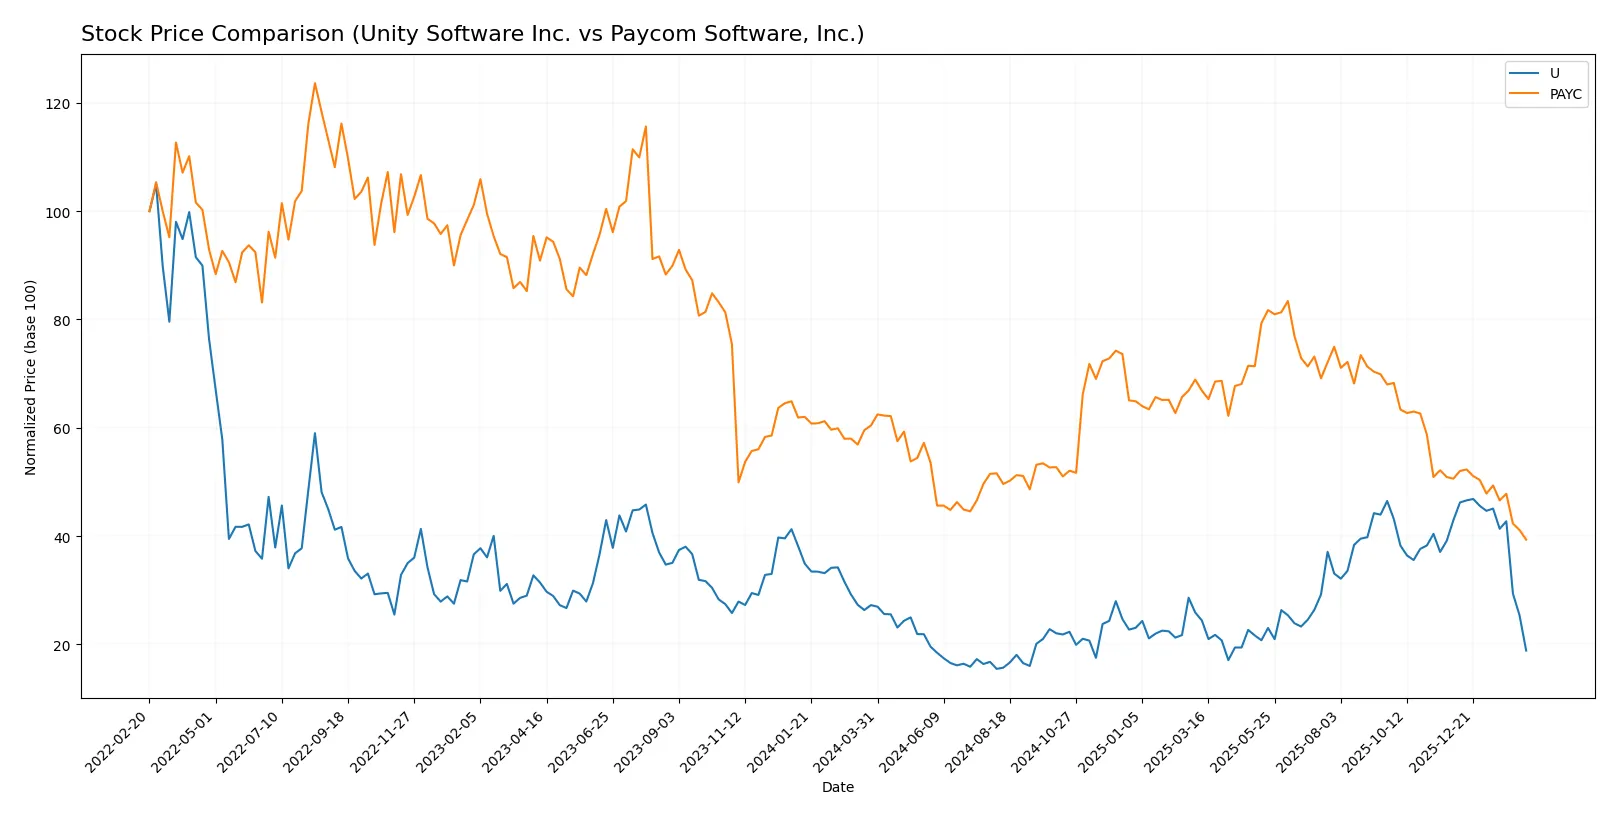
Which stock offers better returns?
Both Unity Software Inc. and Paycom Software, Inc. experienced notable price declines over the past year, with distinct trading patterns and volume dynamics shaping their stock trajectories.
Trend Comparison
Unity Software’s stock fell 30.79% over the past year, marking a bearish trend with decelerating losses and a standard deviation of 9.2. The highest price was 46.42, the lowest 15.32.
Paycom Software’s stock dropped 34.89% over the past year, also bearish with deceleration. It showed higher volatility, a 34.03 standard deviation, and a price range between 265.71 and 125.31.
Comparing both, Unity Software outperformed Paycom with a smaller loss percentage and lower volatility, offering the less severe market decline.
Target Prices
Analysts present a mixed yet optimistic consensus for Unity Software Inc. and Paycom Software, Inc.
| Company | Target Low | Target High | Consensus |
|---|---|---|---|
| Unity Software Inc. | 26 | 60 | 37.7 |
| Paycom Software, Inc. | 115 | 210 | 151.82 |
Unity Software trades well below its consensus target of 37.7, indicating potential upside from the current 18.68. Paycom’s consensus target of 151.82 suggests room for growth above its 125.31 stock price.

Don’t Let Luck Decide Your Entry Point
Optimize your entry points with our advanced ProRealTime indicators. You’ll get efficient buy signals with precise price targets for maximum performance. Start outperforming now!
How do institutions grade them?
Unity Software Inc. Grades
The following table shows recent analyst grades from reputable firms for Unity Software Inc.:
| Grading Company | Action | New Grade | Date |
|---|---|---|---|
| Goldman Sachs | Maintain | Neutral | 2026-02-12 |
| BTIG | Maintain | Buy | 2026-02-12 |
| Needham | Maintain | Buy | 2026-02-12 |
| Wells Fargo | Maintain | Overweight | 2026-02-12 |
| Wedbush | Maintain | Outperform | 2026-02-12 |
| Macquarie | Maintain | Outperform | 2026-02-12 |
| UBS | Maintain | Neutral | 2026-02-12 |
| Citigroup | Maintain | Buy | 2026-02-12 |
| Barclays | Maintain | Equal Weight | 2026-02-12 |
| Citizens | Maintain | Market Outperform | 2026-02-12 |
Paycom Software, Inc. Grades
Below are current grades from recognized analysts for Paycom Software, Inc.:
| Grading Company | Action | New Grade | Date |
|---|---|---|---|
| Citigroup | Maintain | Neutral | 2026-02-13 |
| BMO Capital | Maintain | Market Perform | 2026-02-12 |
| Guggenheim | Maintain | Buy | 2026-02-12 |
| Keybanc | Maintain | Overweight | 2026-02-12 |
| Mizuho | Maintain | Neutral | 2026-02-12 |
| BTIG | Maintain | Buy | 2026-02-12 |
| Barclays | Maintain | Equal Weight | 2026-02-12 |
| Jefferies | Maintain | Hold | 2026-02-12 |
| Cantor Fitzgerald | Maintain | Neutral | 2026-02-12 |
| Cantor Fitzgerald | Maintain | Neutral | 2026-01-29 |
Which company has the best grades?
Unity Software shows a stronger consensus with multiple Buy, Outperform, and Market Outperform ratings. Paycom’s grades lean more neutral and mixed. Higher grades for Unity could indicate greater analyst confidence, potentially influencing investor sentiment.
Risks specific to each company
The following categories identify the critical pressure points and systemic threats facing both firms in the 2026 market environment:
1. Market & Competition
Unity Software Inc.
- Faces intense competition in real-time 3D content platforms; rapid innovation cycles pressure margins.
Paycom Software, Inc.
- Operates in a competitive HCM SaaS space but benefits from strong client retention and integrated analytics.
2. Capital Structure & Debt
Unity Software Inc.
- Moderate leverage with D/E ratio at 0.69; interest coverage is negative, raising solvency concerns.
Paycom Software, Inc.
- No debt reported, reflecting a strong balance sheet and low financial risk.
3. Stock Volatility
Unity Software Inc.
- High beta of 2.085 signals elevated stock price volatility and higher market risk exposure.
Paycom Software, Inc.
- Low beta of 0.795 indicates relative stability and lower volatility compared to the market.
4. Regulatory & Legal
Unity Software Inc.
- Subject to evolving data privacy and content regulations across multiple jurisdictions; potential compliance costs.
Paycom Software, Inc.
- Faces regulatory scrutiny around payroll and labor laws but has established compliance frameworks in the U.S. market.
5. Supply Chain & Operations
Unity Software Inc.
- Relies on global digital infrastructure; disruption risk from geopolitical tensions and tech supply constraints.
Paycom Software, Inc.
- Cloud-based service model reduces physical supply chain risks but depends on data center uptime and cybersecurity.
6. ESG & Climate Transition
Unity Software Inc.
- Pressured to improve sustainability reporting and energy use in data centers amid growing investor ESG demands.
Paycom Software, Inc.
- Faces increasing expectations on social governance, especially in workforce diversity and data privacy protections.
7. Geopolitical Exposure
Unity Software Inc.
- Significant international exposure including China and Europe increases sensitivity to trade tensions and regulation.
Paycom Software, Inc.
- Primarily U.S.-focused, limiting geopolitical risks but vulnerable to domestic policy shifts affecting labor markets.
Which company shows a better risk-adjusted profile?
Unity Software’s biggest risk lies in its volatile stock and weak financial health, especially negative profitability and solvency metrics. Paycom’s primary concern is regulatory compliance and concentrated U.S. market exposure. Paycom demonstrates a stronger risk-adjusted profile, supported by a safe Altman Z-score of 9.07 versus Unity’s distress-zone score of 1.05. Paycom’s zero debt and low beta further reinforce its resilience. Unity’s combination of high beta and negative returns signals elevated risk in the current market cycle.
Final Verdict: Which stock to choose?
Unity Software’s superpower lies in its robust innovation engine, driving rapid growth despite current profitability challenges. Its rising ROIC signals improving capital efficiency, but investors should watch its negative net margins closely. This stock suits portfolios aiming for aggressive growth with a higher risk tolerance.
Paycom Software commands a strategic moat through its recurring revenue model and operational stability. Its strong cash flow quality and safer balance sheet relative to Unity offer a more reliable income stream. Paycom fits well within GARP portfolios focused on sustainable growth at a reasonable price.
If you prioritize high-growth potential and can withstand volatility, Unity outshines with its accelerating profitability trend. However, if you seek better stability and consistent cash generation, Paycom offers a more dependable profile despite a premium valuation. Both present distinct analytical scenarios depending on your risk appetite and investment horizon.
Disclaimer: Investment carries a risk of loss of initial capital. The past performance is not a reliable indicator of future results. Be sure to understand risks before making an investment decision.
Go Further
I encourage you to read the complete analyses of Unity Software Inc. and Paycom Software, Inc. to enhance your investment decisions: