Home > Comparison > Technology > UBER vs PAYC
The strategic rivalry between Uber Technologies, Inc. and Paycom Software, Inc. shapes the evolving landscape of the technology sector. Uber operates as a capital-intensive platform integrating ride-sharing, delivery, and freight logistics, while Paycom focuses on high-margin, cloud-based human capital management solutions. This analysis pits Uber’s diversified scale against Paycom’s specialized growth, aiming to identify the superior risk-adjusted opportunity for a balanced, forward-looking portfolio.
Table of contents
Companies Overview
Uber and Paycom are pivotal players reshaping technology-driven service industries in the US market.
Uber Technologies, Inc.: Global Mobility and Delivery Powerhouse
Uber dominates the mobility and delivery sectors by connecting consumers with independent ride and delivery service providers worldwide. Its revenue streams flow from three segments: Mobility, Delivery, and Freight. In 2026, Uber sharpens its focus on expanding logistics services and enhancing platform efficiency to solidify its market leadership across transportation and delivery networks.
Paycom Software, Inc.: Cloud-Based Human Capital Management Leader
Paycom excels as a cloud-based HCM software provider serving small to mid-sized US companies. It generates revenue through a comprehensive SaaS suite managing recruitment, payroll, compliance, and workforce analytics. The company’s strategic emphasis in 2026 lies in deepening its data analytics capabilities and improving user experience to strengthen its foothold in the competitive human capital management market.
Strategic Collision: Similarities & Divergences
Both companies leverage technology platforms to streamline essential services but diverge sharply in focus—Uber operates an open marketplace connecting service providers and consumers, whereas Paycom offers an integrated, closed-loop software solution for workforce management. Their primary battleground lies in digital transformation of everyday operations—transportation for Uber, and HR for Paycom. This contrast defines their distinct risk profiles and growth trajectories in 2026.
Income Statement Comparison
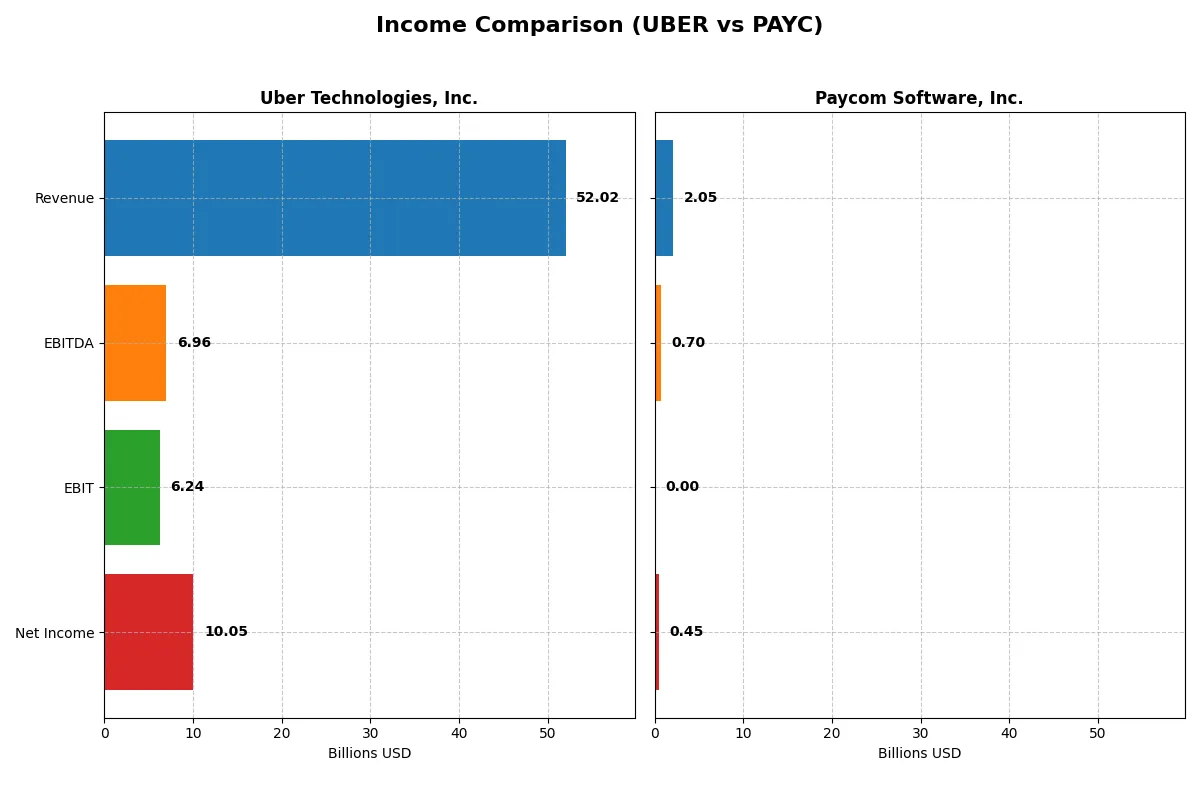
This data dissects the core profitability and scalability of both corporate engines to reveal who dominates the bottom line:
| Metric | Uber Technologies, Inc. (UBER) | Paycom Software, Inc. (PAYC) |
|---|---|---|
| Revenue | 52.0B | 2.1B |
| Cost of Revenue | 31.3B | 345M |
| Operating Expenses | 15.1B | 1.0B |
| Gross Profit | 20.7B | 1.7B |
| EBITDA | 7.0B | 698M |
| EBIT | 6.2B | 0 |
| Interest Expense | 440M | 3.4M |
| Net Income | 10.1B | 453M |
| EPS | 4.82 | 8.13 |
| Fiscal Year | 2025 | 2025 |
Income Statement Analysis: The Bottom-Line Duel
This income statement comparison exposes which company runs a more efficient and profitable business engine in 2025.
Uber Technologies, Inc. Analysis
Uber’s revenue surged from $37.3B in 2023 to $52B in 2025, signaling robust top-line growth. Gross margin improved to 39.75%, reflecting solid cost control. Net income rocketed to $10B in 2025, demonstrating exceptional earnings momentum. Despite a slight dip in net margin growth last year, Uber’s operating and EBITDA margins remain favorable, confirming strong efficiency gains.
Paycom Software, Inc. Analysis
Paycom’s revenue climbed steadily from $1.69B in 2023 to $2.05B in 2025, with gross margin an impressive 83.17%. However, EBIT margin fell to zero in 2025, indicating increased operating costs. Net income decreased to $453M, reflecting margin pressure despite revenue growth. The company shows strong net margin and EPS growth overall, but recent declines suggest challenges in sustaining operational leverage.
Margin Resilience vs. Revenue Expansion
Uber dominates with a larger scale and healthier operating margins, translating into superior net income growth and profitability. Paycom impresses with high gross margins but struggles to convert revenue growth into EBIT gains. For investors, Uber’s profile offers a more compelling combination of scale, margin improvement, and bottom-line strength.
Financial Ratios Comparison
These vital ratios act as a diagnostic tool to expose the underlying fiscal health, valuation premiums, and capital efficiency of the companies compared below:
| Ratios | Uber Technologies, Inc. (UBER) | Paycom Software, Inc. (PAYC) |
|---|---|---|
| ROE | 37.18% | 31.85% |
| ROIC | 11.21% | 24.86% |
| P/E | 16.85 | 19.61 |
| P/B | 6.27 | N/A |
| Current Ratio | 1.14 | 0 |
| Quick Ratio | 1.14 | 0 |
| D/E | 0.50 | 0 |
| Debt-to-Assets | 21.80% | 0% |
| Interest Coverage | 12.65 | -166.82 |
| Asset Turnover | 0.84 | 0 |
| Fixed Asset Turnover | 17.28 | 0 |
| Payout ratio | 0% | 18.70% |
| Dividend yield | 0% | 0.95% |
| Fiscal Year | 2025 | 2025 |
Efficiency & Valuation Duel: The Vital Signs
Financial ratios act as a company’s DNA, uncovering hidden risks and operational strengths crucial for investment decisions.
Uber Technologies, Inc.
Uber posts a robust 37.18% ROE and a 19.33% net margin, signaling strong profitability and efficient operations. Its P/E ratio of 16.85 suggests a fairly valued stock, though a 6.27 PB ratio raises caution on asset pricing. Uber reinvests earnings into R&D and growth, forgoing dividends to fuel expansion.
Paycom Software, Inc.
Paycom shows a favorable 22.1% net margin but reports zero ROE and ROIC, flagging operational challenges or accounting nuances. Its P/E of 19.61 signals moderate valuation, yet lacks traditional liquidity ratios. Paycom pays a small dividend yield of 0.95%, offering some shareholder returns despite weaker core profitability metrics.
Valuation Discipline vs. Operational Ambiguity
Uber balances solid profitability with prudent valuation, while Paycom grapples with unclear returns and weaker liquidity signals. Uber’s profile suits investors valuing operational resilience; Paycom fits those seeking modest income amid uncertain efficiency.
Which one offers the Superior Shareholder Reward?
I compare Uber and Paycom’s shareholder reward by contrasting their dividends, payout ratios, and buybacks. Uber pays no dividends and focuses on reinvestment and modest buybacks. Paycom yields ~0.95%, with a sustainable payout ratio near 18%, and executes significant buybacks. Uber’s zero dividend yield signals full reinvestment into growth, yet its free cash flow per share (~4.7) supports potential future distributions. Paycom’s higher operating margin (~27.6%) and stable dividend indicate strong capital allocation and shareholder returns. Buyback data suggests Paycom aggressively returns capital, enhancing long-term value. I conclude Paycom offers a more attractive total return profile in 2026 due to its balanced dividend and buyback strategy, underpinned by superior profitability.
Comparative Score Analysis: The Strategic Profile
The radar chart reveals the fundamental DNA and trade-offs of Uber Technologies, Inc. and Paycom Software, Inc., highlighting their core financial strengths and weaknesses:
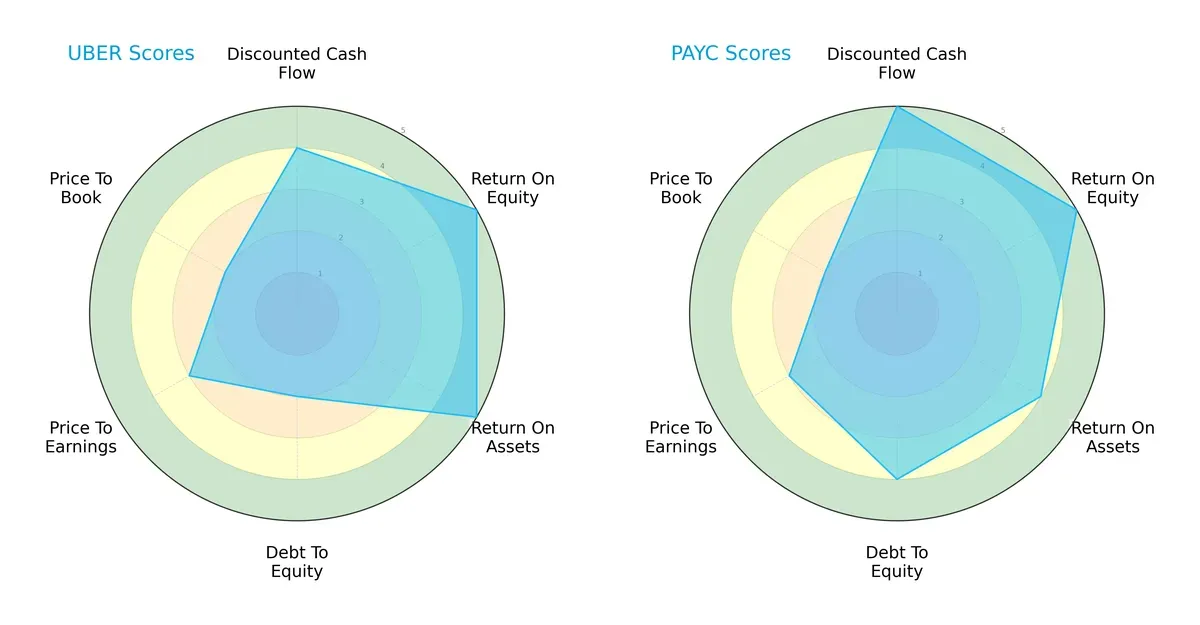
Uber shows strong operational efficiency with high ROE and ROA scores but struggles with leverage, reflected in a weak debt-to-equity score. Paycom boasts superior discounted cash flow and balance sheet strength, maintaining a more balanced profile. Uber relies heavily on operational performance, while Paycom leverages financial stability and valuation metrics.
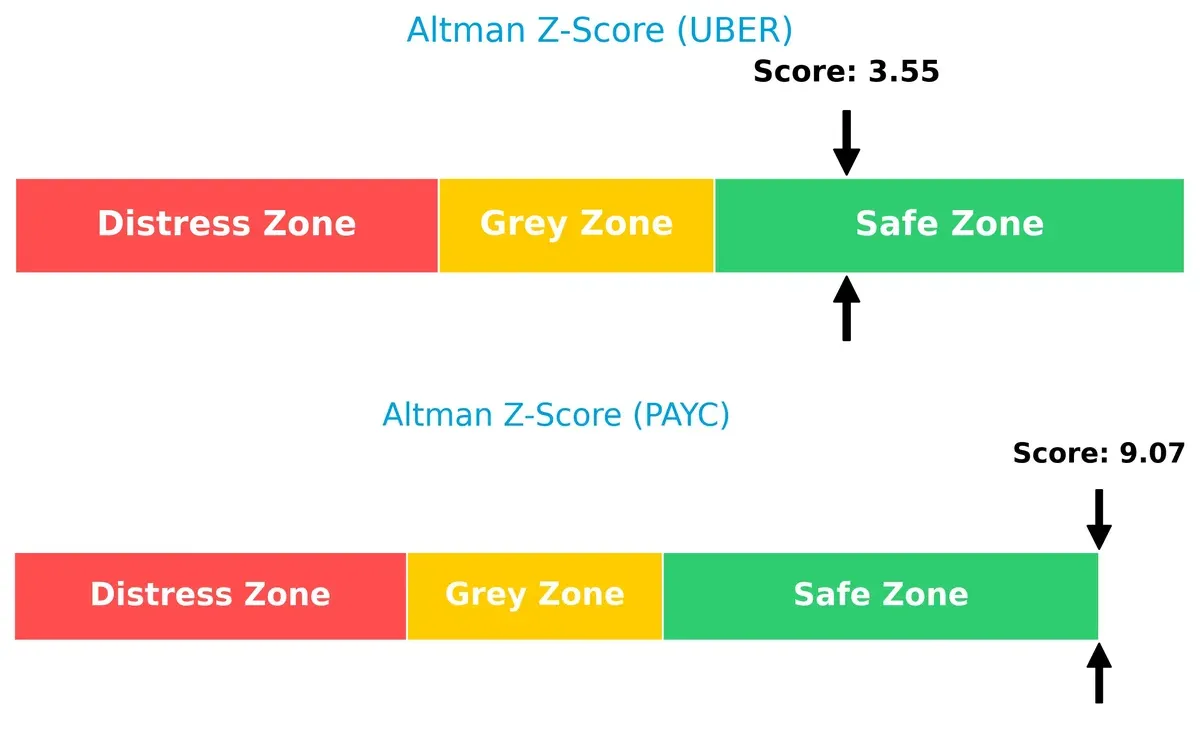
Bankruptcy Risk: Solvency Showdown
The Altman Z-Score delta underscores Paycom’s superior financial safety compared to Uber; both remain in the safe zone, but Paycom’s score signals a stronger long-term survival outlook amid economic uncertainty:
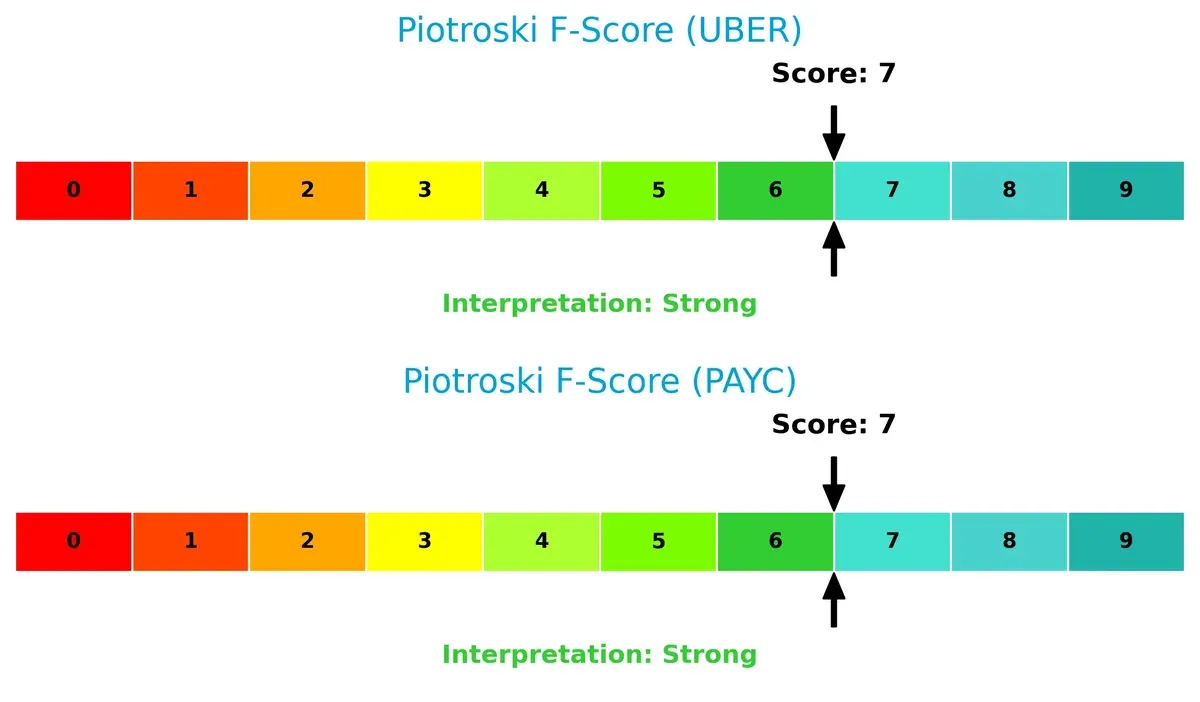
Financial Health: Quality of Operations
Both firms score a strong 7 on the Piotroski F-Score, indicating robust internal financial health with no immediate red flags. This parity suggests both companies maintain solid profitability, liquidity, and operational efficiency:
How are the two companies positioned?
This section dissects Uber and Paycom’s operational DNA by comparing their revenue distribution and internal dynamics. The goal is to confront their economic moats to reveal which model offers the most resilient competitive advantage today.
Revenue Segmentation: The Strategic Mix
This comparison dissects how Uber Technologies and Paycom Software diversify their income streams and highlights their primary sector bets:
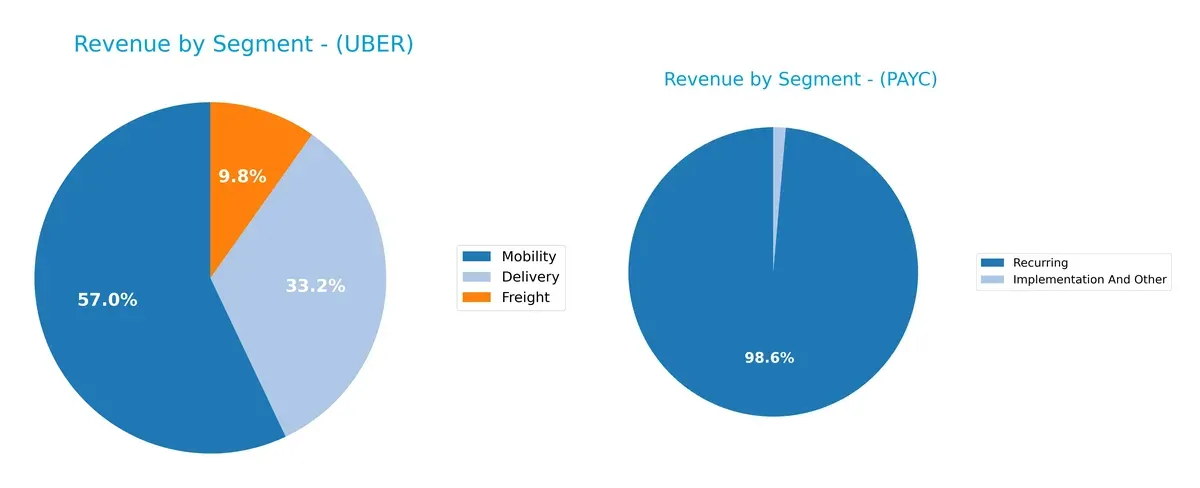
Uber’s revenue pivots heavily on Mobility at $29.7B, dwarfing Delivery ($17.2B) and Freight ($5.1B). This signals infrastructure dominance but also concentration risk. Paycom leans almost exclusively on Recurring revenue at $1.73B, with a much smaller Implementation segment ($24M), reflecting a focused but less diversified SaaS model. Uber’s broader ecosystem contrasts Paycom’s narrow, subscription-anchored income, implying different resilience profiles.
Strengths and Weaknesses Comparison
This table compares the strengths and weaknesses of Uber and Paycom based on diversification, profitability, financials, innovation, global presence, and market share:
Uber Strengths
- Diversified revenue streams across Delivery, Freight, and Mobility
- Favorable profitability with 19.33% net margin and 37.18% ROE
- Strong financials including low debt-to-assets at 21.8% and high interest coverage of 14.18
- Global presence with significant revenues in US, EMEA, Asia Pacific, and Latin America
- Market share leadership in mobility and delivery sectors
Paycom Strengths
- Favorable net margin of 22.1%
- Positive equity position with no debt and low debt-to-assets
- Favorable price-to-book ratio indicating undervaluation
- Recurring revenue model supporting stable cash flows
Uber Weaknesses
- Unfavorable high price-to-book ratio of 6.27 signals potential overvaluation
- Zero dividend yield may deter income-focused investors
- Moderate current ratio at 1.14 indicates neutral short-term liquidity
- Neutral asset turnover suggests room for operational efficiency improvement
Paycom Weaknesses
- Unfavorable zero ROE and ROIC indicate poor capital returns
- Unavailable WACC complicates cost of capital assessment
- Poor liquidity with zero current and quick ratios
- Negative interest coverage signals financial stress
- Asset turnover and fixed asset turnover reported as zero
Uber boasts strong diversification and global scale, supporting its profitability and capital structure. Paycom’s strengths lie in margin and debt management but faces significant capital efficiency and liquidity challenges. This contrast highlights differing strategic focuses and operational risks.
The Moat Duel: Analyzing Competitive Defensibility
A structural moat alone protects long-term profits from competitive erosion. Let’s dissect the competitive moats of Uber and Paycom:
Uber Technologies, Inc.: Network Effects and Scale Advantage
Uber’s moat stems from powerful network effects, connecting millions of riders and drivers globally. This drives high ROIC above WACC by 2.4%, with rapidly growing returns. Expansion in delivery and freight deepens the moat, though regulatory risks linger.
Paycom Software, Inc.: Intangible Assets and Switching Costs
Paycom’s moat relies on intangible assets like proprietary HCM software and high switching costs for clients. However, its ROIC trend declined sharply in recent years, signaling weakening capital efficiency. Innovation in analytics may offer future growth but faces stiff competition.
Network Effects vs. Switching Costs: Who Holds the Stronger Moat?
Uber’s expanding network effects deliver wider and more sustainable economic value than Paycom’s eroding intangible asset moat. Uber is better positioned to defend and grow market share amid evolving global markets.
Which stock offers better returns?
Over the past year, Uber Technologies, Inc. and Paycom Software, Inc. both exhibited bearish trends, marked by declining prices and seller dominance in recent trading sessions.
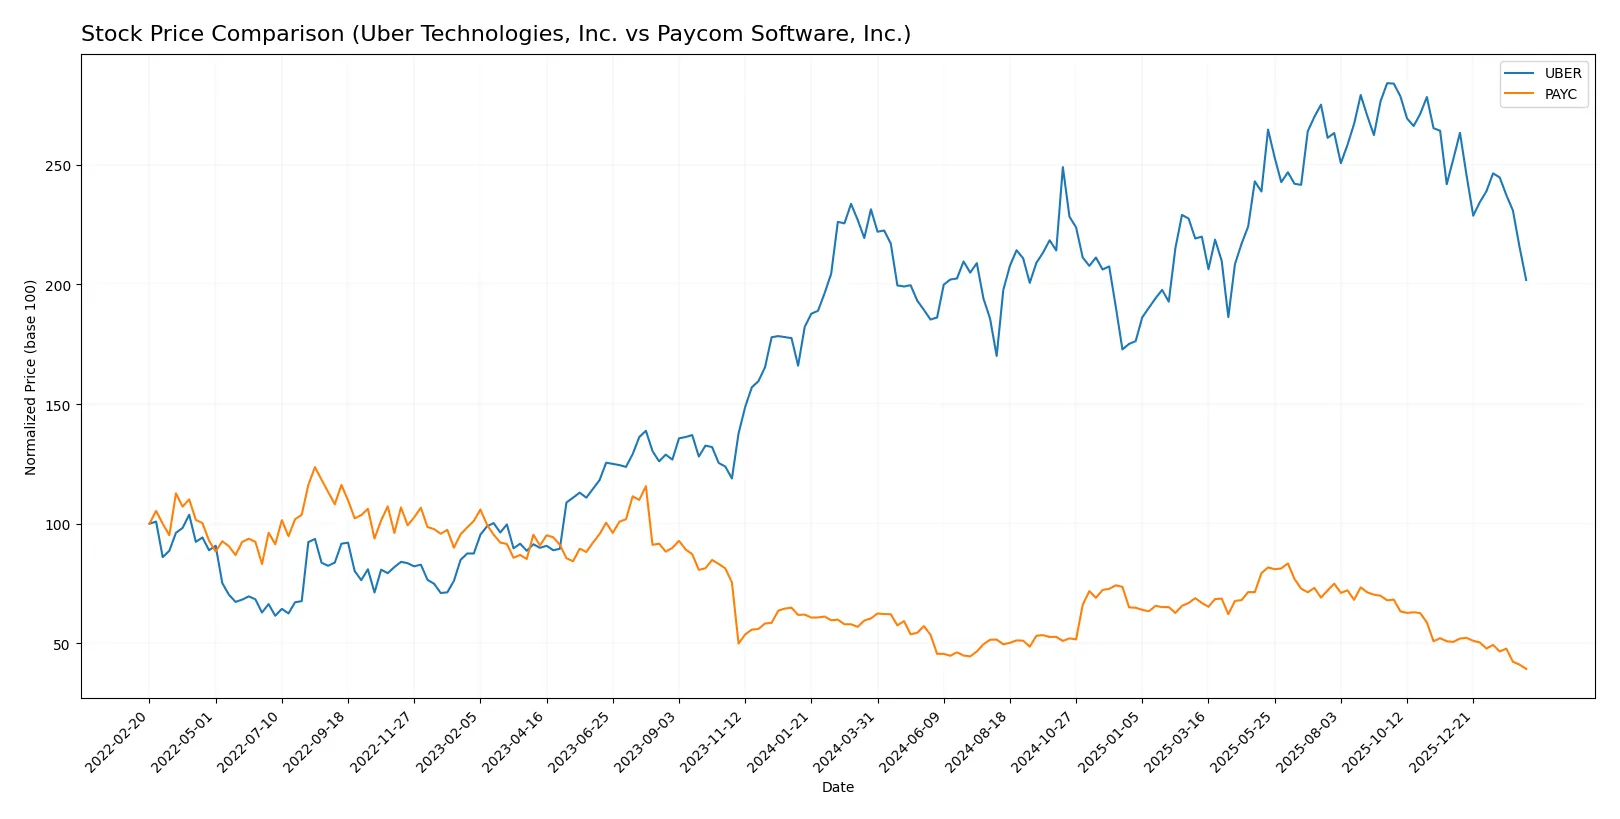
Trend Comparison
Uber’s stock price fell by 12.76% over the past 12 months, showing a bearish trend with decelerating losses and a price range between 58.99 and 98.51. Volatility was moderate at a standard deviation of 10.33.
Paycom’s stock declined more sharply by 34.89% over the same period, also bearish with decelerating losses. Its price fluctuated widely between 125.31 and 265.71, with high volatility reflected in a 34.03 standard deviation.
Comparing both, Uber delivered the higher market performance with a smaller percentage loss, while Paycom experienced more severe price drops and greater volatility.
Target Prices
Analysts present a bullish consensus for both Uber Technologies and Paycom Software.
| Company | Target Low | Target High | Consensus |
|---|---|---|---|
| Uber Technologies, Inc. | 72 | 140 | 105.76 |
| Paycom Software, Inc. | 115 | 210 | 151.82 |
The consensus target for Uber exceeds its current $70 price by over 50%, signaling significant upside potential. Paycom’s consensus target nearly doubles its current $125 price, reflecting strong growth expectations.

Don’t Let Luck Decide Your Entry Point
Optimize your entry points with our advanced ProRealTime indicators. You’ll get efficient buy signals with precise price targets for maximum performance. Start outperforming now!
How do institutions grade them?
Uber Technologies, Inc. Grades
These are the latest grades assigned by major financial institutions for Uber Technologies, Inc.:
| Grading Company | Action | New Grade | Date |
|---|---|---|---|
| Citigroup | Maintain | Buy | 2026-02-06 |
| Morgan Stanley | Maintain | Overweight | 2026-02-05 |
| Wedbush | Maintain | Neutral | 2026-02-05 |
| Benchmark | Maintain | Hold | 2026-02-05 |
| JP Morgan | Maintain | Overweight | 2026-02-05 |
| Citizens | Upgrade | Market Outperform | 2026-02-05 |
| RBC Capital | Maintain | Outperform | 2026-02-05 |
| Wells Fargo | Maintain | Overweight | 2026-02-05 |
| Mizuho | Maintain | Outperform | 2026-02-05 |
| Needham | Maintain | Buy | 2026-02-05 |
Paycom Software, Inc. Grades
These are the latest grades assigned by major financial institutions for Paycom Software, Inc.:
| Grading Company | Action | New Grade | Date |
|---|---|---|---|
| Citigroup | Maintain | Neutral | 2026-02-13 |
| BMO Capital | Maintain | Market Perform | 2026-02-12 |
| Guggenheim | Maintain | Buy | 2026-02-12 |
| Keybanc | Maintain | Overweight | 2026-02-12 |
| Mizuho | Maintain | Neutral | 2026-02-12 |
| BTIG | Maintain | Buy | 2026-02-12 |
| Barclays | Maintain | Equal Weight | 2026-02-12 |
| Jefferies | Maintain | Hold | 2026-02-12 |
| Cantor Fitzgerald | Maintain | Neutral | 2026-02-12 |
| Cantor Fitzgerald | Maintain | Neutral | 2026-01-29 |
Which company has the best grades?
Uber generally receives stronger grades such as Buy, Overweight, and Outperform from multiple firms. Paycom’s grades are more mixed with several Neutral and Market Perform ratings. This suggests Uber currently commands higher institutional conviction, potentially influencing investor confidence and demand.
Risks specific to each company
The following categories identify the critical pressure points and systemic threats facing both firms in the 2026 market environment:
1. Market & Competition
Uber Technologies, Inc.
- Faces intense competition in ride-sharing and delivery markets, requiring constant innovation to maintain market share.
Paycom Software, Inc.
- Operates in a competitive HCM SaaS space but benefits from strong product differentiation and customer retention.
2. Capital Structure & Debt
Uber Technologies, Inc.
- Maintains moderate leverage (D/E 0.5) with favorable interest coverage, supporting financial flexibility.
Paycom Software, Inc.
- Exhibits no debt, reflecting a conservative capital structure but possibly limiting growth leverage.
3. Stock Volatility
Uber Technologies, Inc.
- Beta of 1.21 signals above-market volatility, increasing risk in turbulent markets.
Paycom Software, Inc.
- Lower beta of 0.79 indicates less price volatility, appealing to risk-averse investors.
4. Regulatory & Legal
Uber Technologies, Inc.
- Subject to evolving gig economy regulations and labor laws globally, which can impact costs and operations.
Paycom Software, Inc.
- Faces regulatory risk mainly around data privacy and employment law compliance in the U.S.
5. Supply Chain & Operations
Uber Technologies, Inc.
- Dependent on network of drivers and delivery partners, vulnerable to labor shortages and operational disruptions.
Paycom Software, Inc.
- Relies on cloud infrastructure and software delivery; risks from cyber attacks or service outages.
6. ESG & Climate Transition
Uber Technologies, Inc.
- Under pressure to reduce carbon footprint from transportation services and comply with emissions standards.
Paycom Software, Inc.
- ESG risks primarily linked to data security and ethical software management practices.
7. Geopolitical Exposure
Uber Technologies, Inc.
- Operates internationally, exposing it to geopolitical instability and cross-border regulatory challenges.
Paycom Software, Inc.
- Primarily U.S.-focused, limiting geopolitical risks but increasing exposure to domestic policy shifts.
Which company shows a better risk-adjusted profile?
Uber’s greatest risk is regulatory and geopolitical complexity due to global operations. Paycom’s main risk lies in operational dependence on cloud security and regulatory compliance. Paycom offers a cleaner capital structure and lower stock volatility. However, Uber’s diversified revenue streams and favorable financial ratios suggest a more resilient business model. Recent data shows Uber’s strong interest coverage and safe Altman Z-score, highlighting its robust financial health despite market pressures. Overall, Paycom presents a more conservative risk profile, while Uber balances higher risk with stronger operational scale.
Final Verdict: Which stock to choose?
Uber Technologies, Inc. showcases a superpower in creating sustained value, evidenced by its growing ROIC well above WACC. It operates with robust profitability and improving operational efficiency. A point of vigilance is its relatively high price-to-book ratio, signaling premium valuation risk. Uber fits best in aggressive growth portfolios willing to embrace cyclical volatility.
Paycom Software, Inc. holds a strategic moat through its strong recurring revenue model and dominant market niche in payroll software. Its balance sheet reflects more conservative leverage and financial safety compared to Uber. Paycom suits investors seeking GARP (Growth at a Reasonable Price), balancing growth with stability, despite some pressure on margin expansion.
If you prioritize dynamic value creation with potential for outsized growth, Uber outshines due to its operational momentum and improving profitability metrics. However, if you seek better capital preservation and steady cash flow growth, Paycom offers better stability with a defensible business model. Both present distinct analytical scenarios aligned with different risk appetites and investment horizons.
Disclaimer: Investment carries a risk of loss of initial capital. The past performance is not a reliable indicator of future results. Be sure to understand risks before making an investment decision.
Go Further
I encourage you to read the complete analyses of Uber Technologies, Inc. and Paycom Software, Inc. to enhance your investment decisions: