Home > Comparison > Technology > TYL vs PAYC
The strategic rivalry between Tyler Technologies, Inc. and Paycom Software, Inc. shapes the evolving landscape of enterprise software solutions. Tyler Technologies operates as a capital-intensive provider focused on integrated public sector management. In contrast, Paycom Software delivers high-margin, cloud-based human capital management services to private businesses. This analysis explores their divergent approaches to software application leadership and assesses which company offers a superior risk-adjusted return for diversified portfolios.
Table of contents
Companies Overview
Tyler Technologies and Paycom Software dominate distinct niches within the software application market.
Tyler Technologies, Inc.: Public Sector Software Leader
Tyler Technologies excels in providing integrated information management solutions for government agencies. Its core revenue derives from modular financial management, judicial, and public safety software. In 2026, Tyler focused strategically on expanding cloud hosting capabilities via collaboration with Amazon Web Services, enhancing scalable service delivery across municipal and educational segments.
Paycom Software, Inc.: Cloud-Based HCM Innovator
Paycom Software leads in delivering cloud-based human capital management solutions to small and mid-sized U.S. businesses. Its revenue engine centers on SaaS payroll, talent acquisition, and labor management applications enriched with advanced analytics. The company’s 2026 strategy emphasized continuous innovation in mobile workforce tools and compliance automation to deepen client integration.
Strategic Collision: Similarities & Divergences
Both companies operate in the software application sector with a SaaS business model, yet Tyler serves public sector clients while Paycom targets private enterprises. Their primary battleground is software scalability and user experience in highly regulated environments. Tyler’s strength lies in comprehensive government solutions; Paycom differentiates through workforce analytics. Their investment profiles reflect these distinct market orientations and growth drivers.
Income Statement Comparison
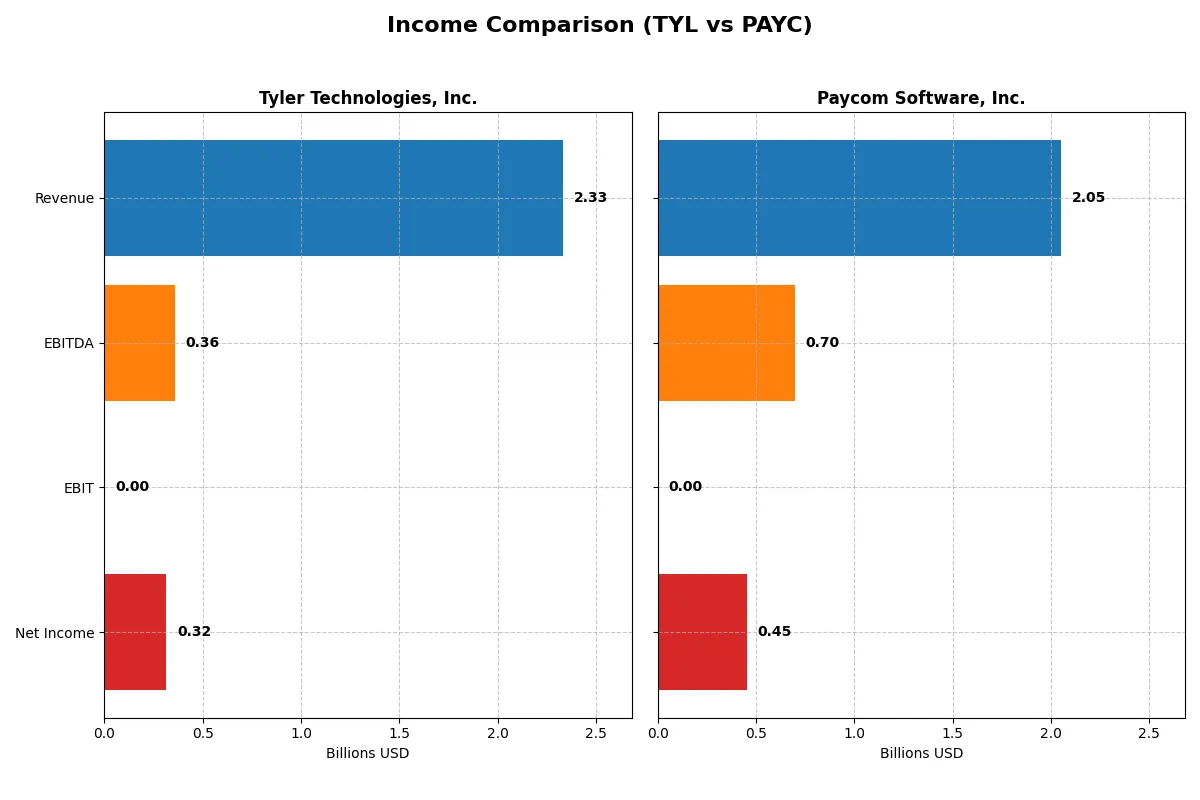
This data dissects the core profitability and scalability of both corporate engines to reveal who dominates the bottom line:
| Metric | Tyler Technologies, Inc. (TYL) | Paycom Software, Inc. (PAYC) |
|---|---|---|
| Revenue | 2.33B | 2.05B |
| Cost of Revenue | 1.25B | 345M |
| Operating Expenses | 670M | 1.05B |
| Gross Profit | 1.08B | 1.71B |
| EBITDA | 358M | 698M |
| EBIT | 358M | — |
| Interest Expense | 5M | 3.4M |
| Net Income | 316M | 453M |
| EPS | 7.32 | 8.13 |
| Fiscal Year | 2025 | 2025 |
Income Statement Analysis: The Bottom-Line Duel
This income statement comparison reveals which company operates its business more efficiently, driving stronger profitability and growth.
Tyler Technologies, Inc. Analysis
Tyler Technologies grew revenue 9.1% in 2025 to $2.33B, with net income rising 20% to $316M. Its gross margin of 46.5% remains solid, reflecting controlled cost of revenue. Despite a drop in EBIT margin to zero, net margin expanded to 13.5%, signaling improved bottom-line efficiency and strong earnings per share momentum.
Paycom Software, Inc. Analysis
Paycom’s revenue advanced 9% to $2.05B in 2025, with net income declining 10% to $453M. The company boasts a robust gross margin above 83%, far surpassing peers. However, net margin dipped to 22.1%, pressured by rising operating expenses and a 100% EBIT margin drop. EPS also contracted, indicating near-term profitability challenges.
Margin Strength vs. Growth Resilience
Tyler Technologies delivers steady margin improvement and double-digit net income growth, showing disciplined expense control. Paycom offers superior gross margins and larger scale but faces recent margin compression and earnings softness. For investors, Tyler’s consistent margin expansion may appeal more than Paycom’s volatility despite its higher revenue base.
Financial Ratios Comparison
These vital ratios act as a diagnostic tool to expose the underlying fiscal health, valuation premiums, and capital efficiency of the companies compared below:
| Ratios | Tyler Technologies, Inc. (TYL) | Paycom Software, Inc. (PAYC) |
|---|---|---|
| ROE | 7.76% (2024) | 31.85% (2024) |
| ROIC | 6.20% (2024) | 24.86% (2024) |
| P/E | 93.42 (2024) | 22.95 (2024) |
| P/B | 7.25 (2024) | 7.31 (2024) |
| Current Ratio | 1.35 (2024) | 1.10 (2024) |
| Quick Ratio | 1.35 (2024) | 1.10 (2024) |
| D/E | 0.19 (2024) | 0.05 (2024) |
| Debt-to-Assets | 12.32% (2024) | 1.42% (2024) |
| Interest Coverage | 50.50 (2024) | 186.56 (2024) |
| Asset Turnover | 0.41 (2024) | 0.32 (2024) |
| Fixed Asset Turnover | 10.95 (2024) | 2.93 (2024) |
| Payout ratio | 0% (2024) | 16.89% (2024) |
| Dividend yield | 0% (2024) | 0.74% (2024) |
| Fiscal Year | 2024 | 2024 |
Efficiency & Valuation Duel: The Vital Signs
Financial ratios act as the company’s DNA, revealing hidden risks and operational excellence through key metrics like profitability and valuation.
Tyler Technologies, Inc.
Tyler Technologies posts a favorable net margin of 13.53%, yet its ROE and ROIC are unavailable or unfavorable, signaling potential efficiency concerns. The stock trades at a stretched P/E of 61.99, suggesting high valuation. Tyler lacks dividends, likely reinvesting in R&D to sustain growth, but its overall ratio profile appears unfavorable.
Paycom Software, Inc.
Paycom boasts a stronger net margin of 22.1% and a more reasonable P/E of 19.61, reflecting a balanced valuation. Despite zero ROE and ROIC data, its modest dividend yield of 0.95% offers some shareholder return. Paycom’s ratio evaluation is less unfavorable than Tyler’s, indicating comparatively better operational stability and value.
Valuation Stretch vs. Margin Strength: Risk-Reward Balance
Paycom offers a superior blend of margin efficiency and valuation discipline compared to Tyler’s stretched price and missing profitability metrics. Investors favoring stable margins with moderate valuations may find Paycom’s profile more fitting, while Tyler’s high valuation demands careful scrutiny given its weaker ratio footing.
Which one offers the Superior Shareholder Reward?
I observe that Paycom Software (PAYC) combines a modest 0.95% dividend yield with a sustainable payout ratio near 19%, reflecting disciplined capital allocation. Tyler Technologies (TYL) pays no dividends and focuses on reinvestment and minimal buybacks, evident from its high P/FCF of ~31x and zero payout. PAYC’s active buyback program and consistent free cash flow coverage enhance shareholder returns, while TYL’s zero dividend and limited buybacks suggest a growth reinvestment model. In 2026, PAYC offers a superior total return profile due to its balanced distribution and capital return strategy, appealing more to income and growth investors alike.
Comparative Score Analysis: The Strategic Profile
The radar chart reveals the fundamental DNA and trade-offs of Tyler Technologies and Paycom Software, highlighting their financial strengths and valuation nuances:
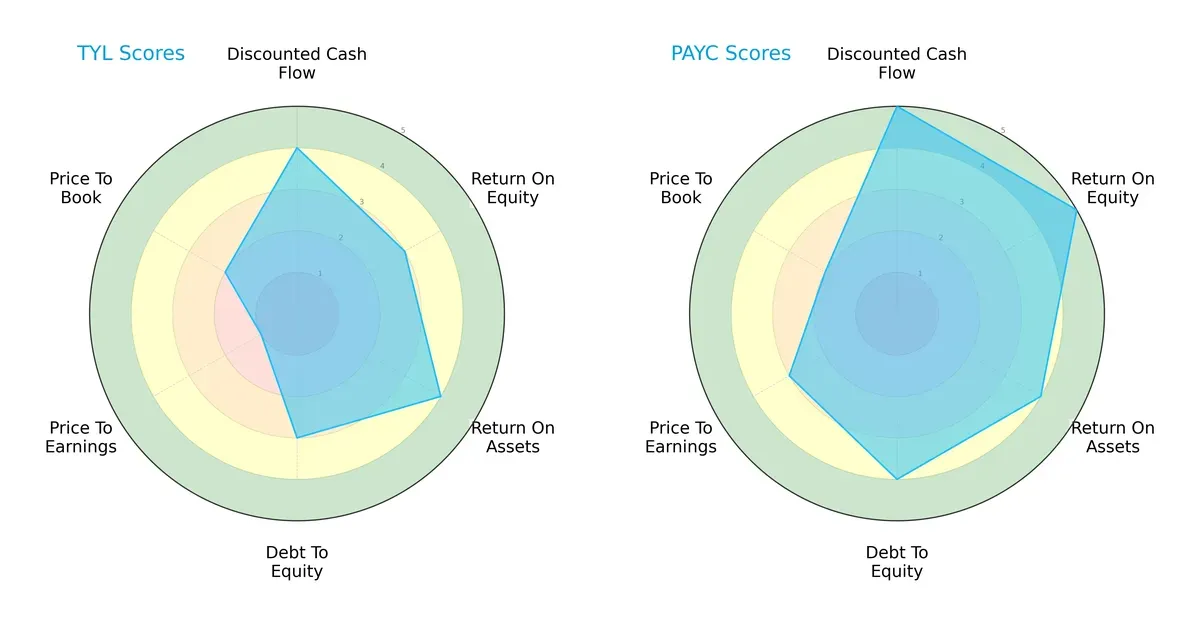
Paycom leads with a more balanced and robust profile. It excels in discounted cash flow (5 vs. 4), return on equity (5 vs. 3), and debt-to-equity management (4 vs. 3). Tyler Technologies shows strength in return on assets (4 vs. 4, tied) but suffers from very unfavorable valuation scores, especially price-to-earnings (1 vs. 3). Paycom’s superior overall score (4 vs. 3) reflects a healthier capital allocation and market confidence, while Tyler relies heavily on asset efficiency.
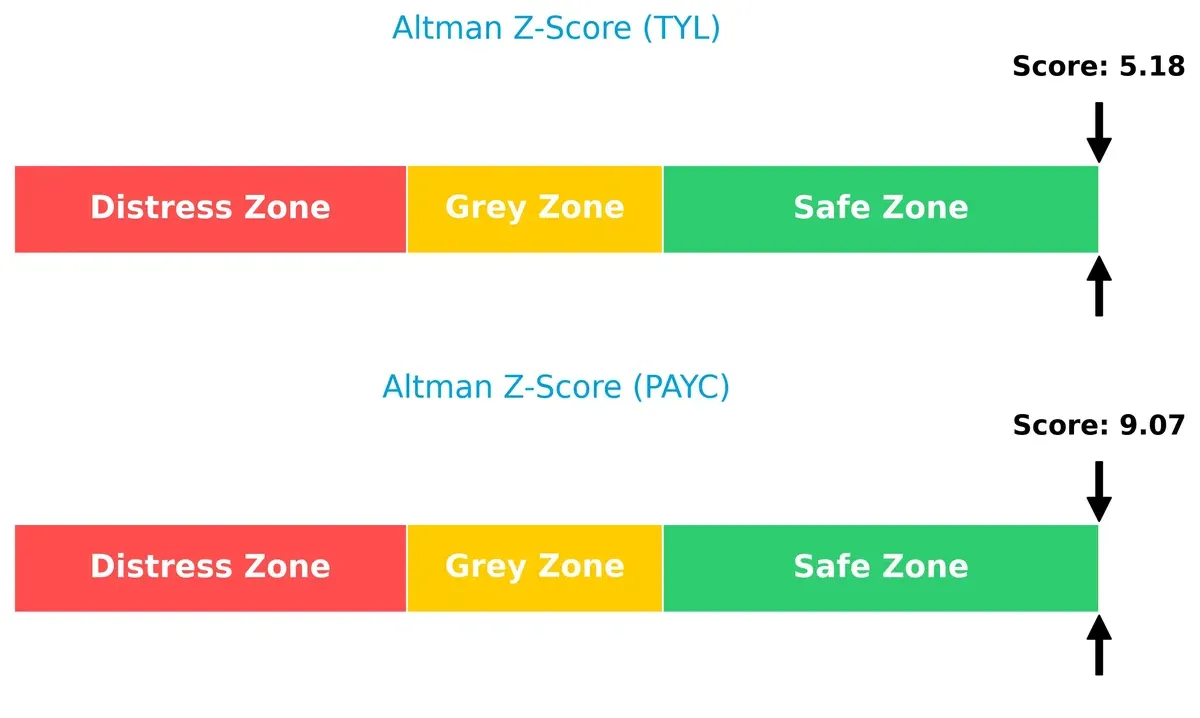
Bankruptcy Risk: Solvency Showdown
Paycom’s Altman Z-Score (9.07) significantly exceeds Tyler’s (5.18), signaling a stronger solvency buffer and greater long-term resilience in this cycle:
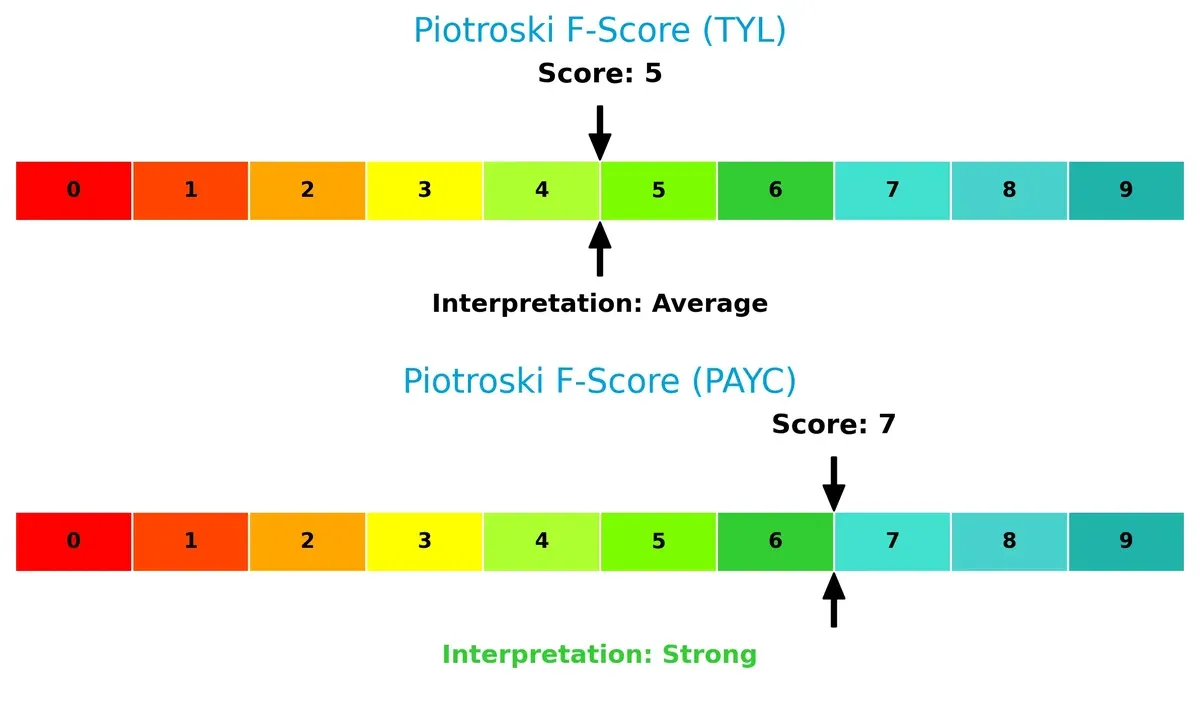
Financial Health: Quality of Operations
Paycom’s Piotroski F-Score of 7 outperforms Tyler’s 5, indicating stronger internal financial health and fewer red flags in profitability, leverage, and liquidity metrics:
How are the two companies positioned?
This section dissects the operational DNA of Tyler Technologies and Paycom by comparing their revenue distribution and internal dynamics. Our final goal is to confront their economic moats to identify which model offers the most resilient competitive advantage today.
Revenue Segmentation: The Strategic Mix
The following visual comparison dissects how Tyler Technologies and Paycom Software diversify their income streams and where their primary sector bets lie:
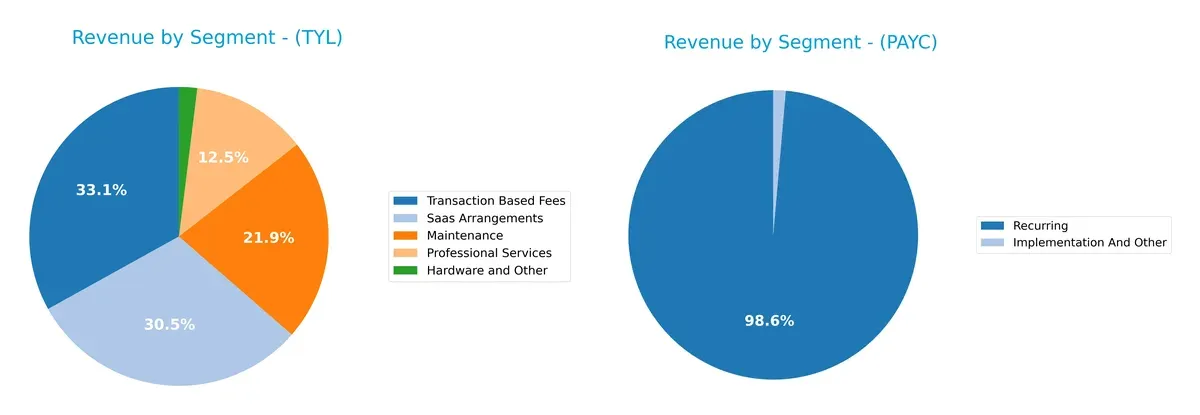
Tyler Technologies anchors revenue in five distinct segments, with transaction-based fees leading at $698M and SaaS arrangements following at $645M, showing a balanced, multi-pronged approach. Paycom Software pivots heavily on recurring revenues, which dwarf implementation fees at $1.73B versus $24M, signaling a strong subscription model. Tyler’s broader mix reduces concentration risk, while Paycom’s focus on recurring revenue underpins ecosystem lock-in but could face renewal pressure.
Strengths and Weaknesses Comparison
This table compares the Strengths and Weaknesses of Tyler Technologies, Inc. and Paycom Software, Inc.:
Tyler Technologies Strengths
- Diverse revenue streams including SaaS, maintenance, and transaction fees
- Positive net margin at 13.53%
- Favorable debt-to-assets and debt-equity ratios
- Strong presence in enterprise software and platform technologies
Paycom Software Strengths
- Higher net margin at 22.1% indicating superior profitability
- Favorable debt metrics similar to Tyler
- Large recurring revenue base supporting stability
- Neutral P/E ratio suggests reasonable valuation
Tyler Technologies Weaknesses
- Zero return on equity and invested capital, signaling inefficient capital use
- Unfavorable liquidity ratios (current and quick)
- Negative interest coverage ratio poses risk
- Elevated P/E ratio at 61.99, potentially overvalued
- Low asset turnover ratios
Paycom Software Weaknesses
- Also zero return on equity and invested capital
- Unfavorable liquidity and interest coverage ratios
- Dividend yield under 1% may deter income investors
- Unfavorable asset turnover ratios
- Global ratios evaluation also unfavorable
Both companies show solid profitability but struggle with capital efficiency and liquidity. Tyler’s broader product diversification contrasts with Paycom’s strong recurring revenue. These factors shape their strategic priorities and risk profiles.
The Moat Duel: Analyzing Competitive Defensibility
A structural moat is the only reliable shield protecting long-term profits from relentless competitive erosion. Here’s how Tyler Technologies and Paycom Software stack up:
Tyler Technologies, Inc.: Complex Integration Moat
Tyler’s moat stems from entrenched switching costs through integrated public sector software. Its 13.5% net margin and 46% gross margin show margin stability. Expansion into cloud-hosted judicial and tax solutions could deepen its moat in 2026.
Paycom Software, Inc.: SaaS Efficiency Moat
Paycom leverages superior cloud-based HCM software with strong network effects, boasting an 83% gross margin and 22% net margin. Despite recent margin pressure, its scalable SaaS model offers opportunities to disrupt mid-sized payroll markets further.
Verdict: Integration Depth vs. SaaS Scale
Tyler’s entrenched integration creates a deeper moat with high retention in government clients. Paycom’s SaaS model excels in efficiency but faces greater margin volatility. Tyler is better positioned to defend its niche market share long term.
Which stock offers better returns?
The past year shows both Tyler Technologies and Paycom Software in clear decline, with sustained bearish trends and decelerating price movements highlighting significant market pressure.
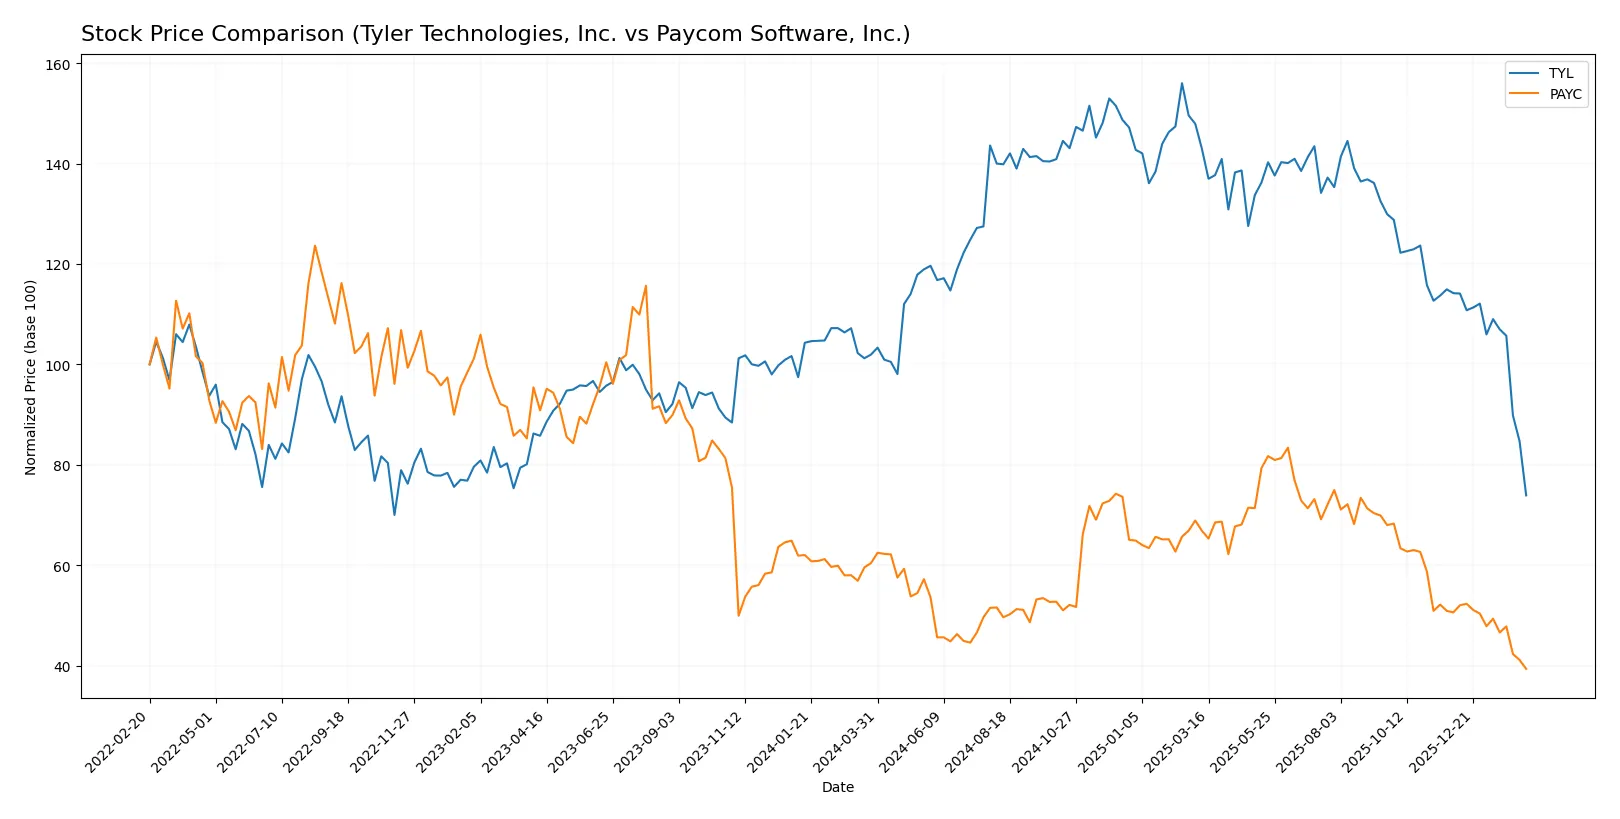
Trend Comparison
Tyler Technologies’ stock dropped 27.51% over the past 12 months, signaling a bearish trend with decelerating losses and a high volatility level (68.01). The price peaked at 641.7 and troughed at 303.94.
Paycom Software’s stock declined 34.89% in the same period, also bearish with decelerating losses and lower volatility (34.03). The highest price was 265.71, with a low of 125.31.
Between these two, Tyler Technologies outperformed Paycom Software, as its smaller percentage loss indicates stronger resilience despite bearish conditions.
Target Prices
Analysts present a cautiously optimistic consensus on Tyler Technologies and Paycom Software.
| Company | Target Low | Target High | Consensus |
|---|---|---|---|
| Tyler Technologies, Inc. | 325 | 675 | 473.91 |
| Paycom Software, Inc. | 115 | 210 | 151.82 |
Tyler Technologies’ consensus target of $474 significantly exceeds its current price of $304, indicating upside potential. Paycom’s $152 target also suggests room to grow from its $125 market price.

Don’t Let Luck Decide Your Entry Point
Optimize your entry points with our advanced ProRealTime indicators. You’ll get efficient buy signals with precise price targets for maximum performance. Start outperforming now!
How do institutions grade them?
Here are the latest institutional grades for Tyler Technologies, Inc. and Paycom Software, Inc.:
Tyler Technologies, Inc. Grades
The following table summarizes recent grades from reputable firms for Tyler Technologies, Inc.:
| Grading Company | Action | New Grade | Date |
|---|---|---|---|
| Oppenheimer | Maintain | Outperform | 2026-02-13 |
| Piper Sandler | Maintain | Overweight | 2026-02-13 |
| Needham | Maintain | Buy | 2026-02-13 |
| TD Cowen | Maintain | Buy | 2026-02-13 |
| Evercore ISI Group | Maintain | In Line | 2026-02-13 |
| Wells Fargo | Maintain | Equal Weight | 2026-02-13 |
| Barclays | Maintain | Overweight | 2026-02-13 |
| Stifel | Maintain | Buy | 2026-02-13 |
| DA Davidson | Upgrade | Buy | 2026-02-11 |
| BTIG | Maintain | Buy | 2026-02-09 |
Paycom Software, Inc. Grades
The following table summarizes recent grades from reputable firms for Paycom Software, Inc.:
| Grading Company | Action | New Grade | Date |
|---|---|---|---|
| Citigroup | Maintain | Neutral | 2026-02-13 |
| BMO Capital | Maintain | Market Perform | 2026-02-12 |
| Guggenheim | Maintain | Buy | 2026-02-12 |
| Keybanc | Maintain | Overweight | 2026-02-12 |
| Mizuho | Maintain | Neutral | 2026-02-12 |
| BTIG | Maintain | Buy | 2026-02-12 |
| Barclays | Maintain | Equal Weight | 2026-02-12 |
| Jefferies | Maintain | Hold | 2026-02-12 |
| Cantor Fitzgerald | Maintain | Neutral | 2026-02-12 |
| Cantor Fitzgerald | Maintain | Neutral | 2026-01-29 |
Which company has the best grades?
Tyler Technologies has received more “Buy” and “Outperform” ratings compared to Paycom, which shows a mix of “Neutral” and “Buy” grades. This suggests stronger institutional confidence in Tyler Technologies, potentially attracting more investor interest.
Risks specific to each company
The following categories identify the critical pressure points and systemic threats facing both firms in the 2026 market environment:
1. Market & Competition
Tyler Technologies, Inc. (TYL)
- Faces intense competition in public sector software; moderate market cap limits scale advantages.
Paycom Software, Inc. (PAYC)
- Operates in a crowded HCM SaaS space; smaller market cap but strong growth and innovation pressure.
2. Capital Structure & Debt
Tyler Technologies, Inc. (TYL)
- Maintains favorable debt-to-equity ratios with low leverage but negative interest coverage signals risk.
Paycom Software, Inc. (PAYC)
- Also displays low leverage with favorable debt ratios; interest coverage remains negative, indicating high financial risk.
3. Stock Volatility
Tyler Technologies, Inc. (TYL)
- Beta near 0.9 implies moderate volatility, with wide trading range since IPO.
Paycom Software, Inc. (PAYC)
- Slightly lower beta (~0.79) suggests marginally less volatility despite wide price range.
4. Regulatory & Legal
Tyler Technologies, Inc. (TYL)
- Public sector contracts expose it to government regulatory shifts and compliance risk.
Paycom Software, Inc. (PAYC)
- Faces regulatory scrutiny around employee data privacy and labor laws in cloud-based HCM solutions.
5. Supply Chain & Operations
Tyler Technologies, Inc. (TYL)
- Relies on cloud partnerships (e.g., AWS) which may create operational dependency risks.
Paycom Software, Inc. (PAYC)
- SaaS delivery reduces physical supply chain risks but depends on continuous software innovation and uptime.
6. ESG & Climate Transition
Tyler Technologies, Inc. (TYL)
- Limited direct ESG exposure but public sector clients increasingly demand sustainability transparency.
Paycom Software, Inc. (PAYC)
- ESG factors gaining importance as workforce management evolves; risk in adapting to climate-related labor policies.
7. Geopolitical Exposure
Tyler Technologies, Inc. (TYL)
- Primarily US-focused, limiting geopolitical risks but vulnerable to domestic policy shifts.
Paycom Software, Inc. (PAYC)
- Also US-centric but cloud tech faces potential export controls and cybersecurity geopolitical risks.
Which company shows a better risk-adjusted profile?
Paycom’s strongest risk is regulatory and legal, given its cloud-based HCM data sensitivity. Tyler’s greatest risk lies in capital structure with poor interest coverage despite low leverage. Paycom demonstrates a better risk-adjusted profile, supported by a higher Altman Z-score (9.07 vs. 5.18) and stronger Piotroski score (7 vs. 5). This reflects Paycom’s superior financial resilience and operational efficiency amid sector volatility. Tyler’s negative interest coverage flags caution despite its larger market cap.
Final Verdict: Which stock to choose?
Tyler Technologies impresses with its superpower of consistent revenue and net income growth, reflecting solid operational momentum. However, its declining ROIC trend and stretched valuation suggest caution. It suits investors with a higher risk tolerance seeking aggressive growth exposure in government software solutions.
Paycom Software offers a strategic moat through its high-margin, SaaS-driven recurring revenue model. Its stronger profitability ratios and better financial stability relative to Tyler make it a safer pick. It aligns well with investors targeting growth at a reasonable price (GARP) with an emphasis on operational efficiency.
If you prioritize aggressive expansion and are comfortable navigating valuation risks, Tyler Technologies might be the compelling choice due to its robust growth trajectory. However, if you seek better stability and a durable moat in a proven cloud platform, Paycom outshines with stronger margins and quality scores. Both carry risks typical of tech growth stocks, so analytical prudence is essential.
Disclaimer: Investment carries a risk of loss of initial capital. The past performance is not a reliable indicator of future results. Be sure to understand risks before making an investment decision.
Go Further
I encourage you to read the complete analyses of Tyler Technologies, Inc. and Paycom Software, Inc. to enhance your investment decisions: