Home > Comparison > Technology > MSTR vs PAYC
The strategic rivalry between Strategy Inc and Paycom Software, Inc. shapes the evolving Technology sector landscape. Strategy Inc operates as a bitcoin treasury company with AI-driven enterprise analytics, blending fintech innovation with software applications. In contrast, Paycom delivers cloud-based human capital management solutions, targeting mid-sized businesses with scalable SaaS offerings. This analysis will reveal which business model presents a superior risk-adjusted opportunity, essential for investors seeking balanced portfolio growth and resilience.
Table of contents
Companies Overview
Strategy Inc and Paycom Software, Inc. each hold notable positions in the software application market, driving innovation in distinct niches.
Strategy Inc: Bitcoin Treasury Pioneer & Enterprise Analytics Leader
Strategy Inc dominates as a bitcoin treasury company offering investors economic exposure to Bitcoin via equity and fixed income securities. Its core revenue stems from these financial instruments and AI-powered enterprise analytics software, including Strategy One and Strategy Mosaic. In 2025, the company sharpened its strategic focus on blending cryptocurrency exposure with advanced data intelligence for enterprises.
Paycom Software, Inc.: Cloud-Based Human Capital Management Innovator
Paycom Software, Inc. leads with a cloud-based human capital management (HCM) SaaS platform targeting small to mid-sized US companies. It generates revenue from comprehensive workforce management applications spanning recruitment, payroll, and compliance. In 2025, Paycom prioritized expanding its analytics and mobile management tools to enhance client operational efficiency.
Strategic Collision: Similarities & Divergences
Both companies focus on software innovation, yet Strategy Inc integrates financial instruments and enterprise analytics, while Paycom delivers SaaS solutions for workforce management. Their primary battleground is data-driven decision-making—Strategy Inc targets analytics with AI and crypto exposure, Paycom emphasizes HCM operational data. This contrast defines their investment profiles: Strategy Inc offers crypto-linked growth potential; Paycom presents steady SaaS subscription revenue with lower beta risk.
Income Statement Comparison
This data dissects the core profitability and scalability of both corporate engines to reveal who dominates the bottom line:
| Metric | Strategy Inc (MSTR) | Paycom Software, Inc. (PAYC) |
|---|---|---|
| Revenue | 477M | 2.05B |
| Cost of Revenue | 149M | 345M |
| Operating Expenses | 5.62B | 1.05B |
| Gross Profit | 328M | 1.71B |
| EBITDA | -5.44B | 698M |
| EBIT | 0 | 567M |
| Interest Expense | -65M | -3.4M |
| Net Income | -4.23B | 453M |
| EPS | -15.23 | 8.13 |
| Fiscal Year | 2025 | 2025 |
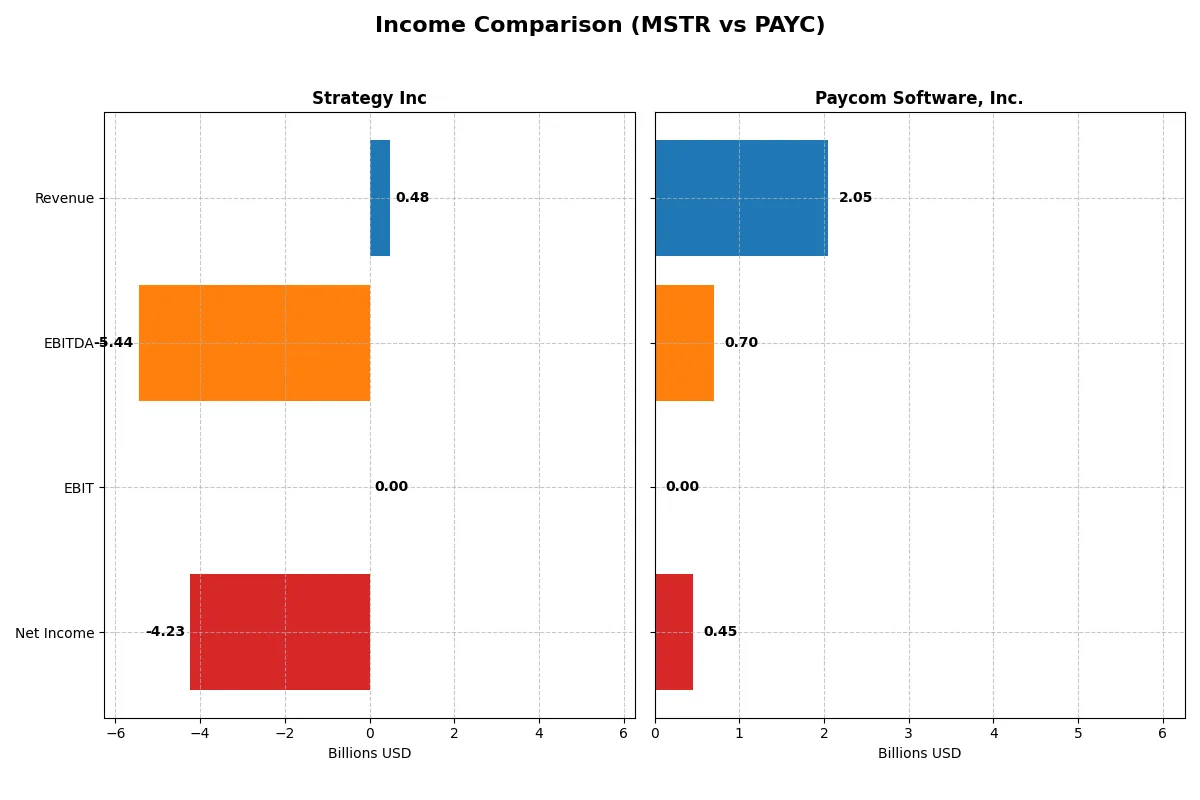
Income Statement Analysis: The Bottom-Line Duel
This income statement comparison reveals how each company converts revenue into profit, exposing their operational efficiency and growth momentum.
Strategy Inc Analysis
Strategy Inc’s revenue slightly declined from 510M in 2021 to 477M in 2025, reflecting a challenging top line. Gross margins remain healthy near 69%, but net margins plunged to -886%, driven by hefty other expenses and interest costs. The latest year shows deep net losses of -4.2B despite stable gross profit, signaling severe operational inefficiency.
Paycom Software, Inc. Analysis
Paycom’s revenue grew strongly from 1.06B in 2021 to 2.05B in 2025, with gross margins expanding to a robust 83%. Net income advanced to 453M in 2025, yielding a solid 22% net margin. Although net margin and EPS dipped slightly year-over-year, Paycom sustains strong profitability and scalable operating leverage.
Growth Momentum vs. Profitability Resilience
Paycom clearly outperforms Strategy Inc, delivering sustained revenue growth and healthy net margins. Strategy Inc struggles with high costs and large net losses despite decent gross profits. For investors, Paycom’s profile offers a more attractive combination of growth and profitability resilience.
Financial Ratios Comparison
These vital ratios act as a diagnostic tool to expose the underlying fiscal health, valuation premiums, and capital efficiency of the companies compared below:
| Ratios | Strategy Inc (MSTR) | Paycom Software, Inc. (PAYC) |
|---|---|---|
| ROE | -8.29% | 0% |
| ROIC | -6.19% | 0% |
| P/E | -9.98 | 19.61 |
| P/B | 0.83 | 0 |
| Current Ratio | 5.62 | 0 |
| Quick Ratio | 5.62 | 0 |
| D/E (Debt-to-Equity) | 0.16 | 0 |
| Debt-to-Assets | 13.44% | 0% |
| Interest Coverage | 83.80 | -166.82 |
| Asset Turnover | 0.008 | 0 |
| Fixed Asset Turnover | 6.29 | 0 |
| Payout ratio | 0 | 18.70% |
| Dividend yield | 0% | 0.95% |
| Fiscal Year | 2025 | 2025 |
Efficiency & Valuation Duel: The Vital Signs
Financial ratios act as a company’s DNA, exposing hidden risks and highlighting operational excellence behind the numbers.
Strategy Inc
Strategy Inc posts negative core profitability with ROE at -8.29% and net margin deeply unfavorable at -886%. The valuation appears attractive with a P/E of -9.98 and a P/B of 0.83, suggesting the stock is undervalued despite weak earnings. The company pays no dividend, focusing on reinvestment in R&D and growth initiatives.
Paycom Software, Inc.
Paycom shows solid profitability with a favorable net margin of 22.1% but lacks reported ROE and ROIC metrics. Its P/E ratio at 19.61 is neutral, reflecting fair valuation relative to earnings. Paycom maintains a modest dividend yield of 0.95%, returning some capital to shareholders while supporting steady operational efficiency.
Valuation Attractiveness vs. Profitability Stability
Strategy Inc offers an undervalued profile with severe profitability challenges, while Paycom delivers strong margins with balanced valuation. Investors seeking operational stability may prefer Paycom’s model; those targeting potential value plays might monitor Strategy Inc’s turnaround prospects.
Which one offers the Superior Shareholder Reward?
Strategy Inc (MSTR) pays no dividends and shows zero buyback activity, focusing on reinvestment despite negative margins and free cash flow. Paycom Software, Inc. (PAYC) delivers a modest 0.95% dividend yield with a sustainable 18.7% payout ratio, supported by strong free cash flow of $7.3/share and consistent buybacks. PAYC’s disciplined capital allocation balances growth and shareholder returns. I find PAYC’s model more sustainable and attractive for total returns in 2026.
Comparative Score Analysis: The Strategic Profile
The radar chart reveals the fundamental DNA and trade-offs of Strategy Inc and Paycom Software, Inc., highlighting their distinctive financial strengths and weaknesses:
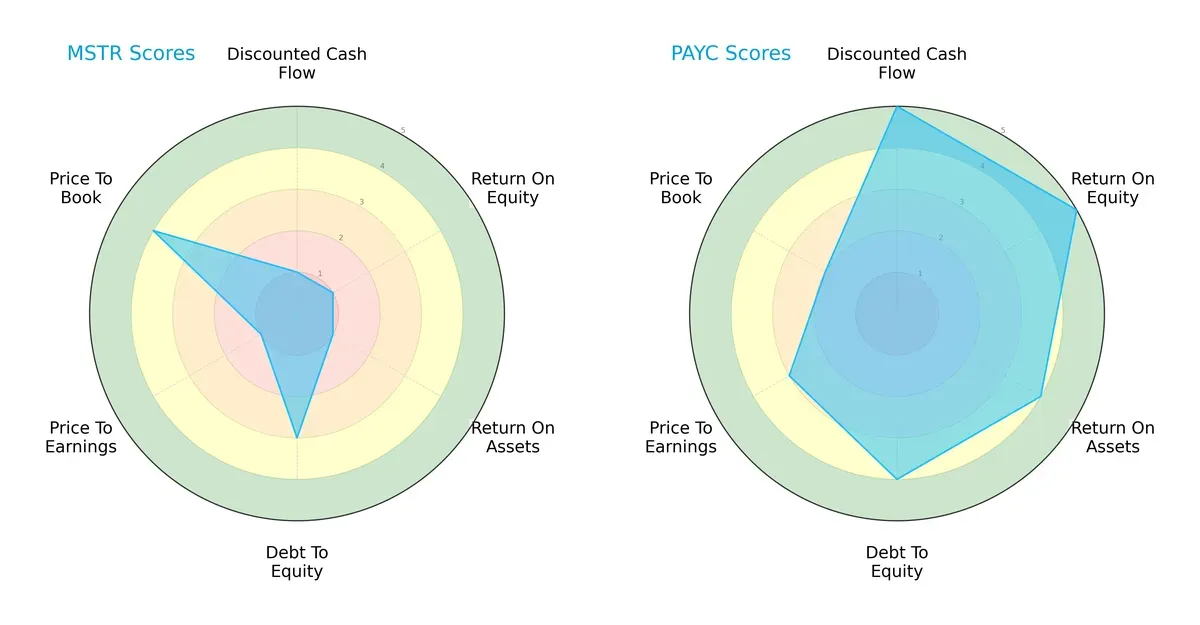
Paycom Software, Inc. dominates across most metrics with top scores in DCF (5), ROE (5), and ROA (4), indicating strong cash flow and efficient asset use. Strategy Inc lags with mostly very unfavorable scores except for a moderate debt-to-equity score (3) and a favorable price-to-book score (4). Paycom shows a more balanced and robust profile, while Strategy Inc relies heavily on valuation appeal but struggles operationally.
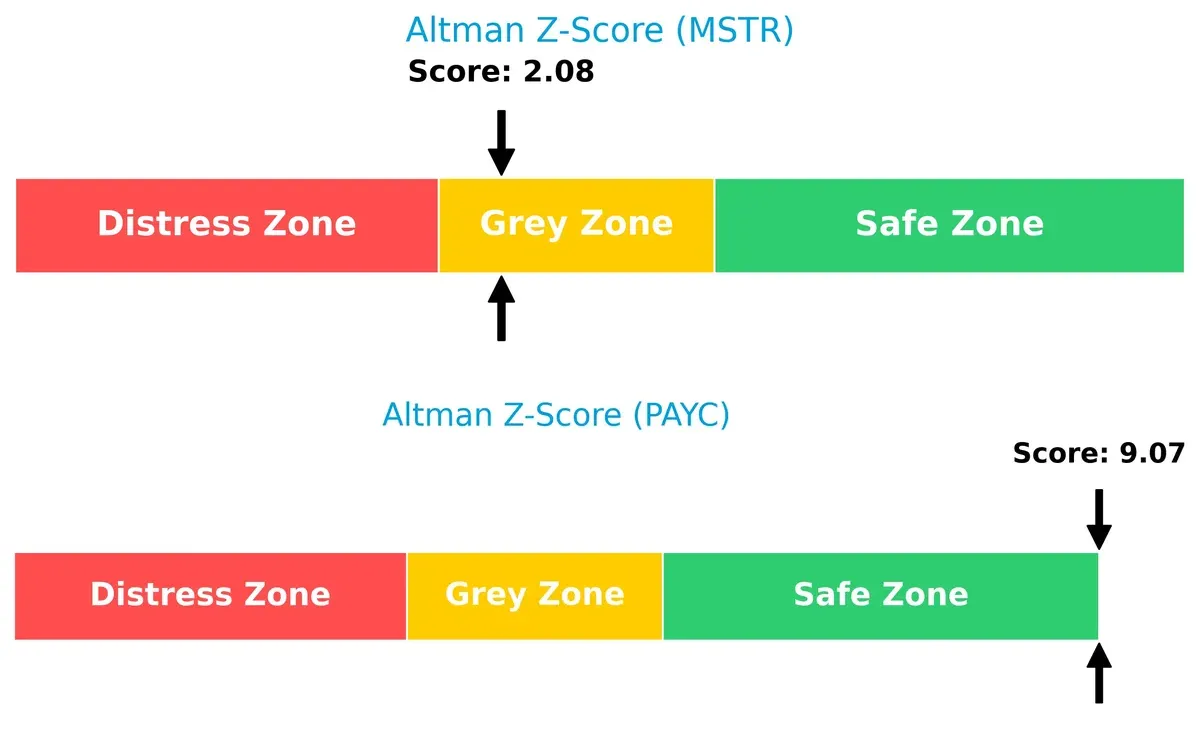
Bankruptcy Risk: Solvency Showdown
Paycom’s Altman Z-Score of 9.07 signals a very safe zone, reflecting solid financial stability. Strategy Inc’s score of 2.08 places it in the grey zone, suggesting higher bankruptcy risk in this cycle:
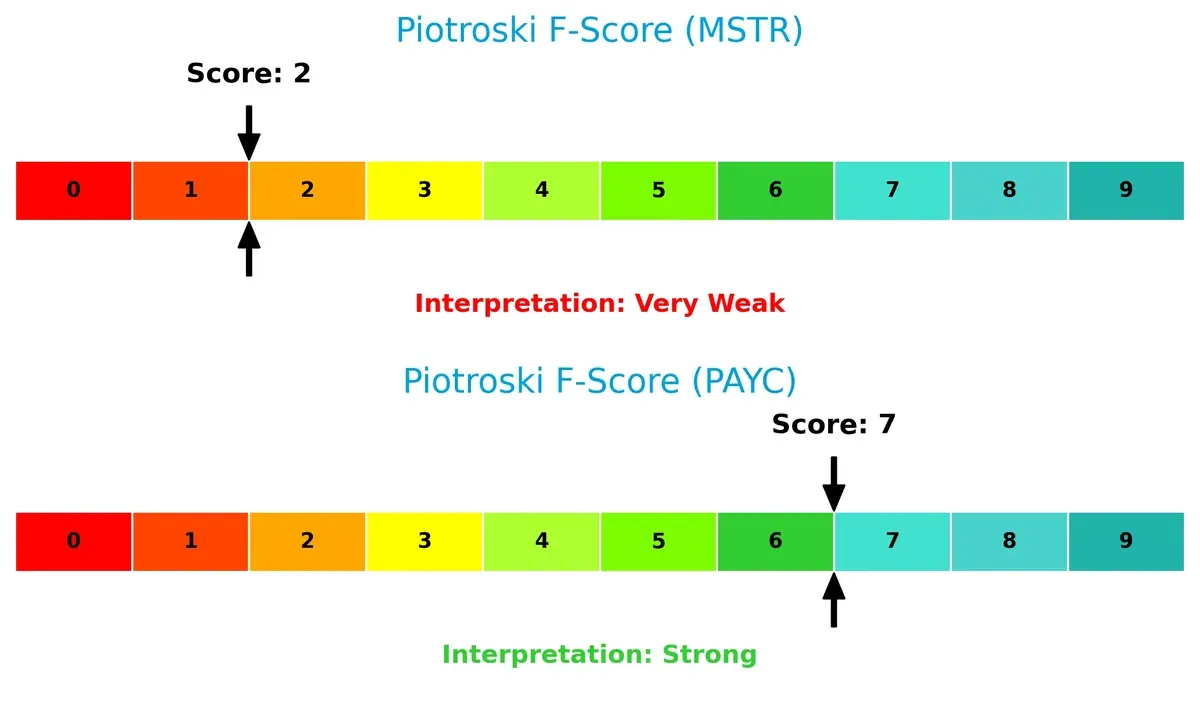
Financial Health: Quality of Operations
Paycom’s Piotroski F-Score of 7 indicates strong financial health with robust internal metrics. Strategy Inc scores only 2, raising red flags about its operational quality and financial weakness:
How are the two companies positioned?
This section dissects the operational DNA of Strategy Inc and Paycom Software by comparing their revenue distribution and internal dynamics. The goal is to confront their economic moats and identify which model offers the most resilient competitive advantage today.
Revenue Segmentation: The Strategic Mix
This comparison dissects how Strategy Inc and Paycom Software, Inc. diversify their income streams and where their primary sector bets lie:
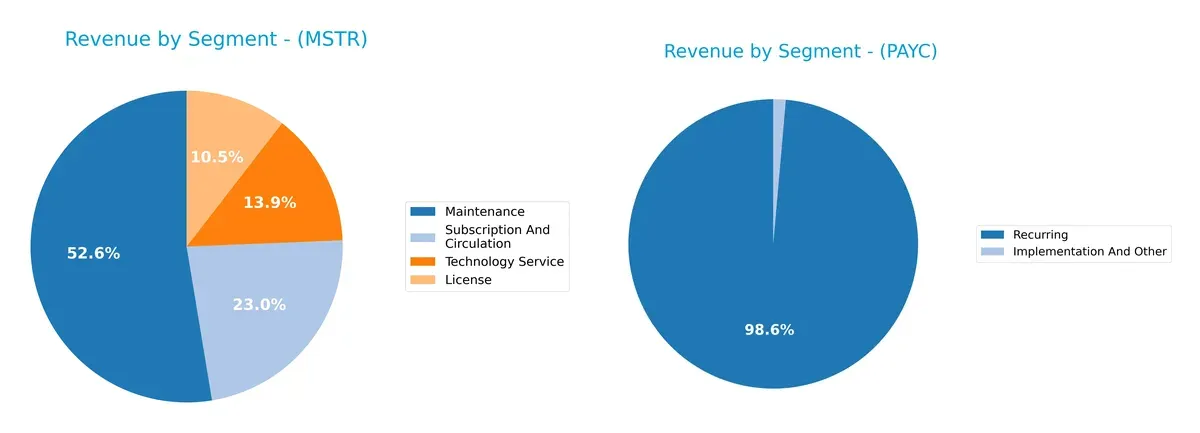
Strategy Inc displays a more balanced mix with Maintenance at $244M anchoring revenue, supported by Subscription ($107M), Technology Service ($64M), and License ($49M). Paycom Software, Inc. pivots heavily on Recurring revenue of $1.73B, dwarfing Implementation and Other at $24M. Strategy Inc’s diverse streams reduce concentration risk, while Paycom’s dominance in Recurring revenue signals strong ecosystem lock-in but exposes it to reliance on a single segment.
Strengths and Weaknesses Comparison
This table compares the strengths and weaknesses of Strategy Inc and Paycom Software, Inc.:
Strategy Inc Strengths
- Diverse revenue streams: License, Maintenance, Subscription, Technology Service
- Strong global presence: North America, EMEA, Other Regions
- Low debt-to-assets ratio at 13.44%
- Favorable quick ratio at 5.62
- Positive fixed asset turnover of 6.29
Paycom Software, Inc. Strengths
- Dominant recurring revenue of $1.73B in 2024
- Zero debt and debt-to-assets ratio
- Favorable price-to-book ratio
- Net margin strong at 22.1%
- Consistent revenue growth in recurring segment
Strategy Inc Weaknesses
- Negative profitability: net margin -886.26%, ROE -8.29%, ROIC -6.19%
- High WACC at 17%
- Negative interest coverage ratio
- Low asset turnover at 0.01
- No dividend yield
Paycom Software, Inc. Weaknesses
- Unavailable WACC data
- Unfavorable current and quick ratios at zero
- ROE and ROIC at 0%
- Negative interest coverage
- Low asset and fixed asset turnover
- Dividend yield unfavorable at 0.95%
Strategy Inc shows strength in diversified revenue and global footprint but struggles with profitability and capital efficiency. Paycom excels in recurring revenue and balance sheet strength but faces liquidity and asset utilization challenges. Both companies face notable profitability and operational risks impacting their future financial strategy.
The Moat Duel: Analyzing Competitive Defensibility
A structural moat is the sole defender of long-term profits against relentless competitive pressures. Let’s dissect the sources of economic moats for these two firms:
Strategy Inc: Intangible Assets Driving Bitcoin and AI Analytics Dominance
Strategy Inc leverages its unique AI-powered analytics and bitcoin treasury as intangible assets. This moat sustains high gross margins near 69%. Yet, net losses and negative ROIC vs. WACC signal value destruction, though improving profitability hints at future moat strengthening by 2026.
Paycom Software, Inc.: Robust Switching Costs in Human Capital Management
Paycom’s moat centers on strong switching costs embedded in its cloud-based HCM platform. It commands superior gross margins above 83% and positive net margins near 22%. Despite a recent ROIC decline, consistent revenue and profit growth underscore a durable competitive position poised for cautious expansion.
Moat Showdown: Intangible Assets vs. Switching Costs
Strategy Inc’s intangible asset moat is promising but currently undermined by value destruction. Paycom’s switching cost moat proves wider, with sustained profitability and revenue growth. Paycom better defends its market share amid evolving industry dynamics.
Which stock offers better returns?
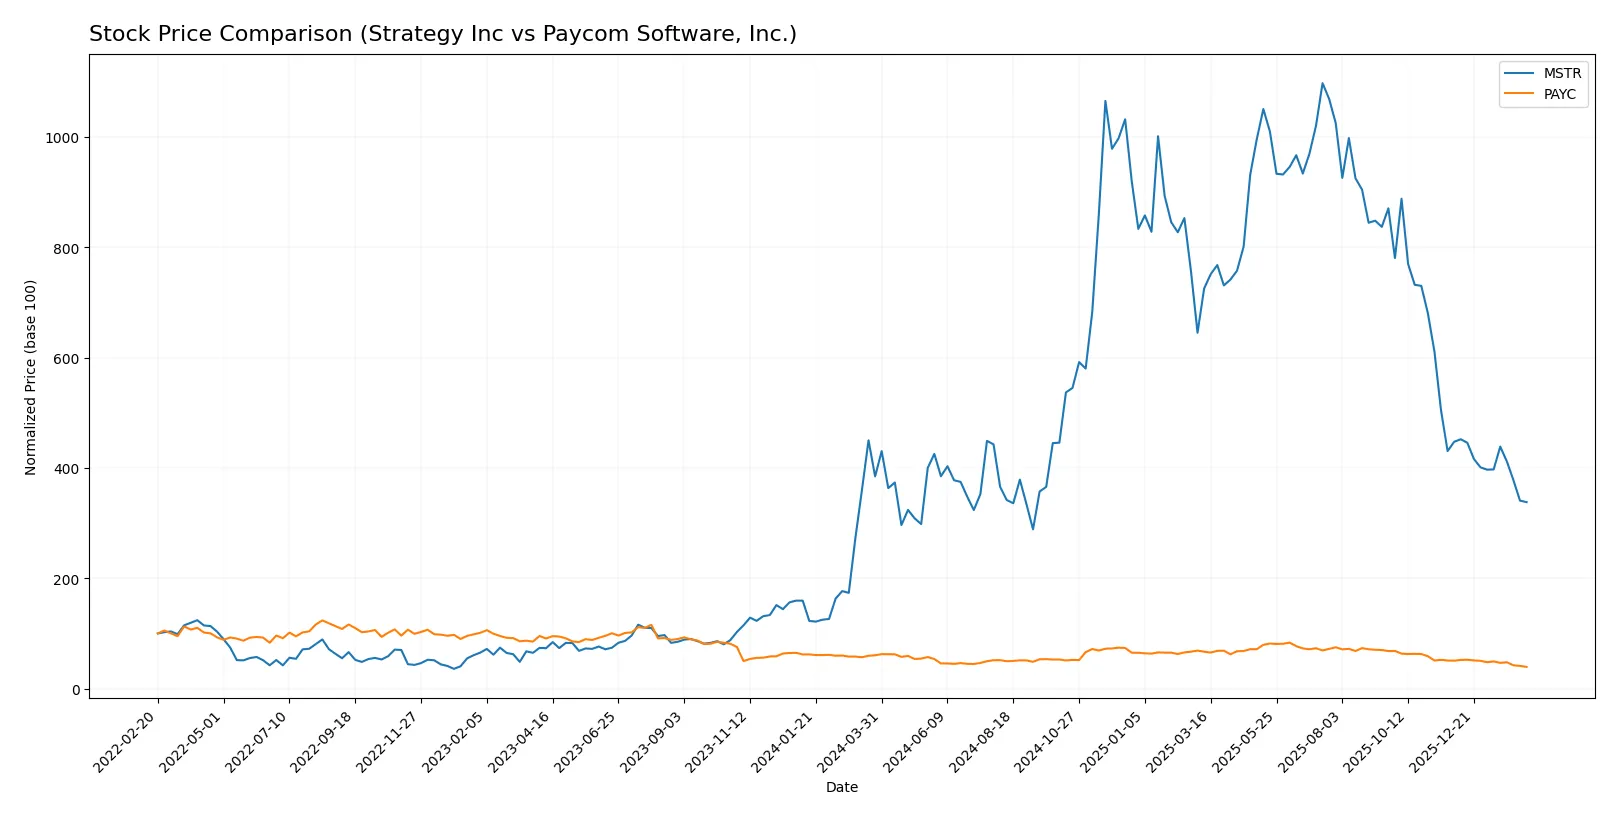
Over the past year, both Strategy Inc and Paycom Software, Inc. experienced pronounced downward price movements with notable highs and lows, reflecting persistent selling pressure and decelerating bearish trends.
Trend Comparison
Strategy Inc’s stock declined 12.09% over the past 12 months, indicating a bearish trend with decelerating momentum. It reached a high of 434.58 and a low of 114.3, showing pronounced volatility (std. dev. 101.79).
Paycom Software, Inc. fell 34.89% over the same period, confirming a bearish trend with deceleration. Its price ranged from 265.71 down to 125.31, with lower volatility (std. dev. 34.03) relative to Strategy Inc.
Comparing both, Strategy Inc’s stock delivered the highest market performance with a smaller decline, despite high volatility. Paycom’s steeper fall marks it as the weaker performer over the last year.
Target Prices
Analysts present a broad target price range for Strategy Inc and Paycom Software, highlighting differing growth expectations.
| Company | Target Low | Target High | Consensus |
|---|---|---|---|
| Strategy Inc | 175 | 705 | 374.5 |
| Paycom Software, Inc. | 115 | 210 | 151.82 |
Strategy Inc’s consensus target at 374.5 far exceeds its current 134 price, implying significant upside potential. Paycom’s consensus target of 151.82 also suggests moderate appreciation above its 125 price.

Don’t Let Luck Decide Your Entry Point
Optimize your entry points with our advanced ProRealTime indicators. You’ll get efficient buy signals with precise price targets for maximum performance. Start outperforming now!
How do institutions grade them?
Strategy Inc Grades
The following table summarizes recent grades assigned to Strategy Inc by reputable institutions.
| Grading Company | Action | New Grade | Date |
|---|---|---|---|
| Cantor Fitzgerald | Maintain | Overweight | 2026-02-09 |
| BTIG | Maintain | Buy | 2026-02-06 |
| Canaccord Genuity | Maintain | Buy | 2026-02-04 |
| Mizuho | Maintain | Outperform | 2026-01-16 |
| TD Cowen | Maintain | Buy | 2026-01-15 |
| Citigroup | Maintain | Buy | 2025-12-22 |
| Bernstein | Maintain | Outperform | 2025-12-08 |
| Monness, Crespi, Hardt | Upgrade | Neutral | 2025-11-10 |
| Canaccord Genuity | Maintain | Buy | 2025-11-03 |
| HC Wainwright & Co. | Maintain | Buy | 2025-11-03 |
Paycom Software, Inc. Grades
The table below lists recent grades assigned to Paycom Software, Inc. by recognized grading firms.
| Grading Company | Action | New Grade | Date |
|---|---|---|---|
| Citigroup | Maintain | Neutral | 2026-02-13 |
| BMO Capital | Maintain | Market Perform | 2026-02-12 |
| Guggenheim | Maintain | Buy | 2026-02-12 |
| Keybanc | Maintain | Overweight | 2026-02-12 |
| Mizuho | Maintain | Neutral | 2026-02-12 |
| BTIG | Maintain | Buy | 2026-02-12 |
| Barclays | Maintain | Equal Weight | 2026-02-12 |
| Jefferies | Maintain | Hold | 2026-02-12 |
| Cantor Fitzgerald | Maintain | Neutral | 2026-02-12 |
| Cantor Fitzgerald | Maintain | Neutral | 2026-01-29 |
Which company has the best grades?
Strategy Inc consistently receives stronger grades such as Buy and Outperform across multiple firms. Paycom Software shows more Neutral and Hold ratings. Investors may interpret Strategy Inc’s higher grades as greater confidence from institutions.
Risks specific to each company
The following categories identify critical pressure points and systemic threats facing Strategy Inc and Paycom Software, Inc. in the 2026 market environment:
1. Market & Competition
Strategy Inc
- Faces volatile bitcoin treasury market and intense software application competition.
Paycom Software, Inc.
- Operates in competitive cloud-based HCM software with strong mid-market focus.
2. Capital Structure & Debt
Strategy Inc
- Low debt-to-equity ratio (0.16) supports moderate financial risk.
Paycom Software, Inc.
- Virtually no debt, indicating a very conservative capital structure.
3. Stock Volatility
Strategy Inc
- Extremely high beta (3.535) signals significant price swings and market sensitivity.
Paycom Software, Inc.
- Low beta (0.79) reflects stable stock and lower market volatility.
4. Regulatory & Legal
Strategy Inc
- Exposure to complex bitcoin regulations across multiple jurisdictions.
Paycom Software, Inc.
- Faces standard software compliance and labor regulation risks in the U.S.
5. Supply Chain & Operations
Strategy Inc
- Relies on AI software development and bitcoin asset management infrastructure.
Paycom Software, Inc.
- Dependent on cloud infrastructure and data security for SaaS delivery.
6. ESG & Climate Transition
Strategy Inc
- Bitcoin treasury operations may attract scrutiny for environmental impact.
Paycom Software, Inc.
- SaaS model with lower direct environmental footprint but faces social governance challenges.
7. Geopolitical Exposure
Strategy Inc
- Significant international presence exposes it to global political and crypto regulatory risks.
Paycom Software, Inc.
- Primarily U.S.-focused, limiting geopolitical risk but dependent on domestic policies.
Which company shows a better risk-adjusted profile?
Strategy Inc’s greatest risk is its extreme stock volatility and negative financial returns amid bitcoin asset exposure. Paycom’s key risk lies in operational dependency on cloud infrastructure and moderate regulatory hurdles. Paycom displays a stronger risk-adjusted profile, with low volatility, solid profitability, and robust financial health. Its Altman Z-Score of 9.07 signals financial stability, while Strategy Inc’s 2.08 places it in a grey zone. Paycom’s steady earnings and lower leverage justify a more prudent investment stance in 2026.
Final Verdict: Which stock to choose?
Strategy Inc’s superpower lies in its robust liquidity and a growing return on invested capital, suggesting an improving operational efficiency. However, its persistent negative net margin and value destruction pose a point of vigilance. It suits portfolios with a high tolerance for turnaround stories and aggressive growth ambitions.
Paycom Software, Inc. benefits from a strong strategic moat rooted in recurring revenue and impressive gross margin expansion. Its financial stability and favorable cash flow generation offer a safer harbor compared to Strategy Inc. This stock fits well with investors seeking GARP (Growth at a Reasonable Price) profiles emphasizing steady growth and resilience.
If you prioritize high-risk, high-reward opportunities, Strategy Inc. presents a compelling scenario with potential upside from improving profitability metrics despite current setbacks. However, if you seek steadier earnings growth coupled with a more stable balance sheet, Paycom Software, Inc. outshines as the prudent choice. Both demand careful monitoring given recent bearish price trends.
Disclaimer: Investment carries a risk of loss of initial capital. The past performance is not a reliable indicator of future results. Be sure to understand risks before making an investment decision.
Go Further
I encourage you to read the complete analyses of Strategy Inc and Paycom Software, Inc. to enhance your investment decisions: