In the fast-evolving technology sector, Snowflake Inc. (SNOW) and Paycom Software, Inc. (PAYC) stand out as innovators in cloud-based software solutions. Snowflake specializes in data platform services that empower businesses with advanced analytics, while Paycom focuses on comprehensive human capital management software. Both companies operate in overlapping markets with strong growth potential, making their comparison essential. In this article, I will help you determine which company presents the most compelling investment opportunity for your portfolio.
Table of contents
Companies Overview
I will begin the comparison between Snowflake Inc. and Paycom Software, Inc. by providing an overview of these two companies and their main differences.
Snowflake Inc. Overview
Snowflake Inc. provides a cloud-based data platform designed to consolidate data into a single source of truth. Its Data Cloud platform enables customers to generate business insights, build data-driven applications, and share data across various industries. Founded in 2012 and based in Bozeman, Montana, Snowflake operates internationally and focuses on software applications within the technology sector.
Paycom Software, Inc. Overview
Paycom Software, Inc. delivers a cloud-based human capital management (HCM) solution primarily for small to mid-sized U.S. companies. Its software-as-a-service platform covers recruitment, time and labor management, payroll, talent management, and compliance tools. Established in 1998 and headquartered in Oklahoma City, Oklahoma, Paycom emphasizes comprehensive workforce management within the technology industry.
Key similarities and differences
Both Snowflake and Paycom operate in the technology sector with cloud-based software platforms, yet their business models serve distinct markets. Snowflake targets data consolidation and analytics across diverse industries globally, while Paycom focuses on HCM solutions tailored for U.S.-based small to mid-sized businesses. Each leverages SaaS delivery but differs in application scope—data infrastructure versus workforce management.
Income Statement Comparison
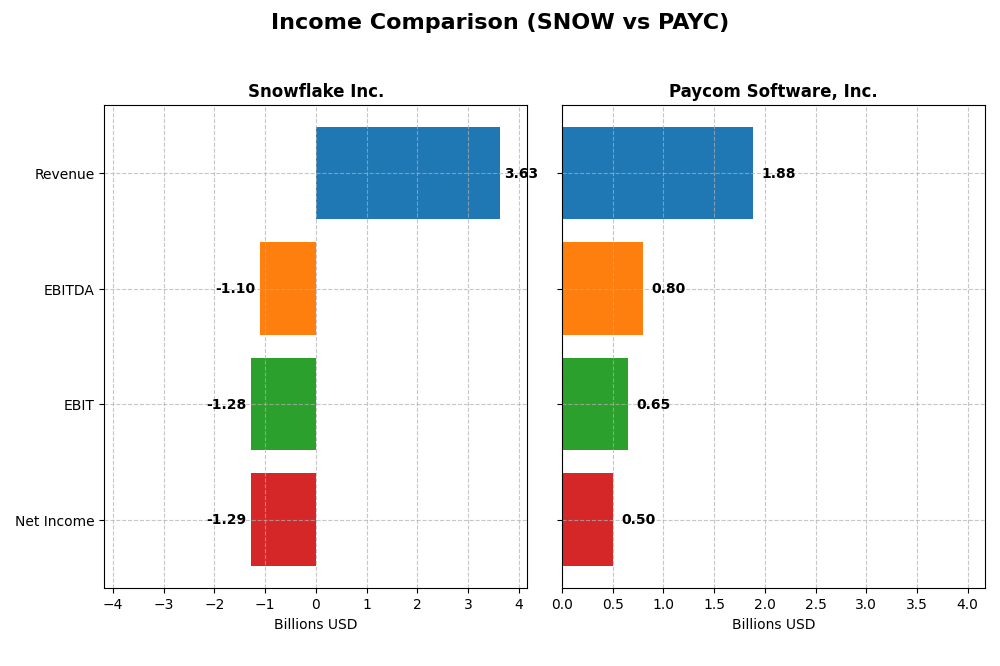
The following table presents a side-by-side comparison of key income statement metrics for Snowflake Inc. and Paycom Software, Inc. for their most recent fiscal years.
| Metric | Snowflake Inc. (SNOW) | Paycom Software, Inc. (PAYC) |
|---|---|---|
| Market Cap | 70.4B | 8.3B |
| Revenue | 3.63B | 1.88B |
| EBITDA | -1.10B | 798M |
| EBIT | -1.28B | 652M |
| Net Income | -1.29B | 502M |
| EPS | -3.86 | 8.93 |
| Fiscal Year | 2025 | 2024 |
Income Statement Interpretations
Snowflake Inc.
Snowflake’s revenue demonstrated strong growth from 2021 to 2025, rising from $592M to $3.63B, a 513% increase overall. However, net income remained negative, widening from -$539M to -$1.29B, reflecting ongoing operating losses. Gross margins held favorably at 66.5% in 2025, but EBIT and net margins were heavily negative, indicating profitability challenges despite a 29% revenue jump in the latest year.
Paycom Software, Inc.
Paycom showed steady revenue growth from $841M in 2020 to $1.88B in 2024, with net income rising from $143M to $502M, marking strong profitability gains. Margins remained robust, with a favorable gross margin of 82.2% and net margin of 26.7% in 2024. The company improved EBIT and net income margins, reflecting healthy operational leverage and consistent EPS growth of 52% year-over-year.
Which one has the stronger fundamentals?
Paycom exhibits stronger fundamentals with consistent profitability, expanding margins, and positive net income growth over both the short and long term. Snowflake’s impressive revenue growth is offset by persistent net losses and negative margins, signaling ongoing challenges in achieving profitability. Overall, Paycom’s favorable income statement metrics and margin stability present a more solid financial foundation.
Financial Ratios Comparison
Below is a comparison of the most recent key financial ratios for Snowflake Inc. (SNOW) and Paycom Software, Inc. (PAYC) based on their fiscal year 2025 and 2024 data respectively.
| Ratios | Snowflake Inc. (2025) | Paycom Software, Inc. (2024) |
|---|---|---|
| ROE | -42.9% | 31.9% |
| ROIC | -25.2% | 24.9% |
| P/E | -47 | 22.9 |
| P/B | 20.1 | 7.31 |
| Current Ratio | 1.75 | 1.10 |
| Quick Ratio | 1.75 | 1.10 |
| D/E (Debt-to-Equity) | 0.90 | 0.053 |
| Debt-to-Assets | 29.7% | 1.42% |
| Interest Coverage | -528 | 187 |
| Asset Turnover | 0.40 | 0.32 |
| Fixed Asset Turnover | 5.53 | 2.93 |
| Payout ratio | 0% | 16.9% |
| Dividend yield | 0% | 0.74% |
Interpretation of the Ratios
Snowflake Inc.
Snowflake shows several unfavorable ratios, including a negative net margin of -35.45% and a return on equity of -42.86%, indicating profitability challenges. The price-to-book ratio at 20.13 is also unfavorable, while liquidity ratios like current and quick ratios at 1.75 are favorable. Snowflake pays no dividends, reflecting a reinvestment and high-growth strategy without shareholder payouts.
Paycom Software, Inc.
Paycom exhibits predominantly favorable ratios, with a strong net margin of 26.66% and return on equity of 31.85%, signaling solid profitability. Its debt ratios are low and favorable, with a debt-to-assets ratio of 1.42%. The company pays dividends, offering a modest yield of 0.74% with a stable payout supported by positive free cash flow, though the yield is marked unfavorable in the evaluation.
Which one has the best ratios?
Paycom demonstrates a more favorable ratio profile overall, with higher profitability, better returns, and controlled leverage. Snowflake, by contrast, has a largely unfavorable profitability outlook and high valuation multiples, reflecting its growth phase and reinvestment focus but with greater financial risks.
Strategic Positioning
This section compares the strategic positioning of Snowflake Inc. and Paycom Software, Inc., including market position, key segments, and exposure to technological disruption:
Snowflake Inc.
- Large market cap of 70B with competitive pressure in cloud data platforms.
- Key segments: Product revenue (3.46B in 2025) and professional services.
- Platform exposure to cloud-based data services, facing evolving tech demands.
Paycom Software, Inc.
- Smaller market cap of 8.3B focused on HCM software for SMBs.
- Key segments: Recurring revenue (1.73B in 2024) and implementation.
- Cloud-based HCM SaaS with proprietary tools like Microfence and analytics.
Snowflake Inc. vs Paycom Software, Inc. Positioning
Snowflake has a diversified product portfolio focused on cloud data platforms serving multiple industries, while Paycom concentrates on cloud HCM solutions for small to mid-sized US companies. Snowflake’s scale offers broad industry reach, whereas Paycom’s niche focus drives steady recurring revenue.
Which has the best competitive advantage?
Paycom shows a very favorable MOAT with growing ROIC and value creation, indicating a durable competitive advantage. Conversely, Snowflake’s declining ROIC and value destruction signal weaker competitive positioning based on the MOAT evaluation.
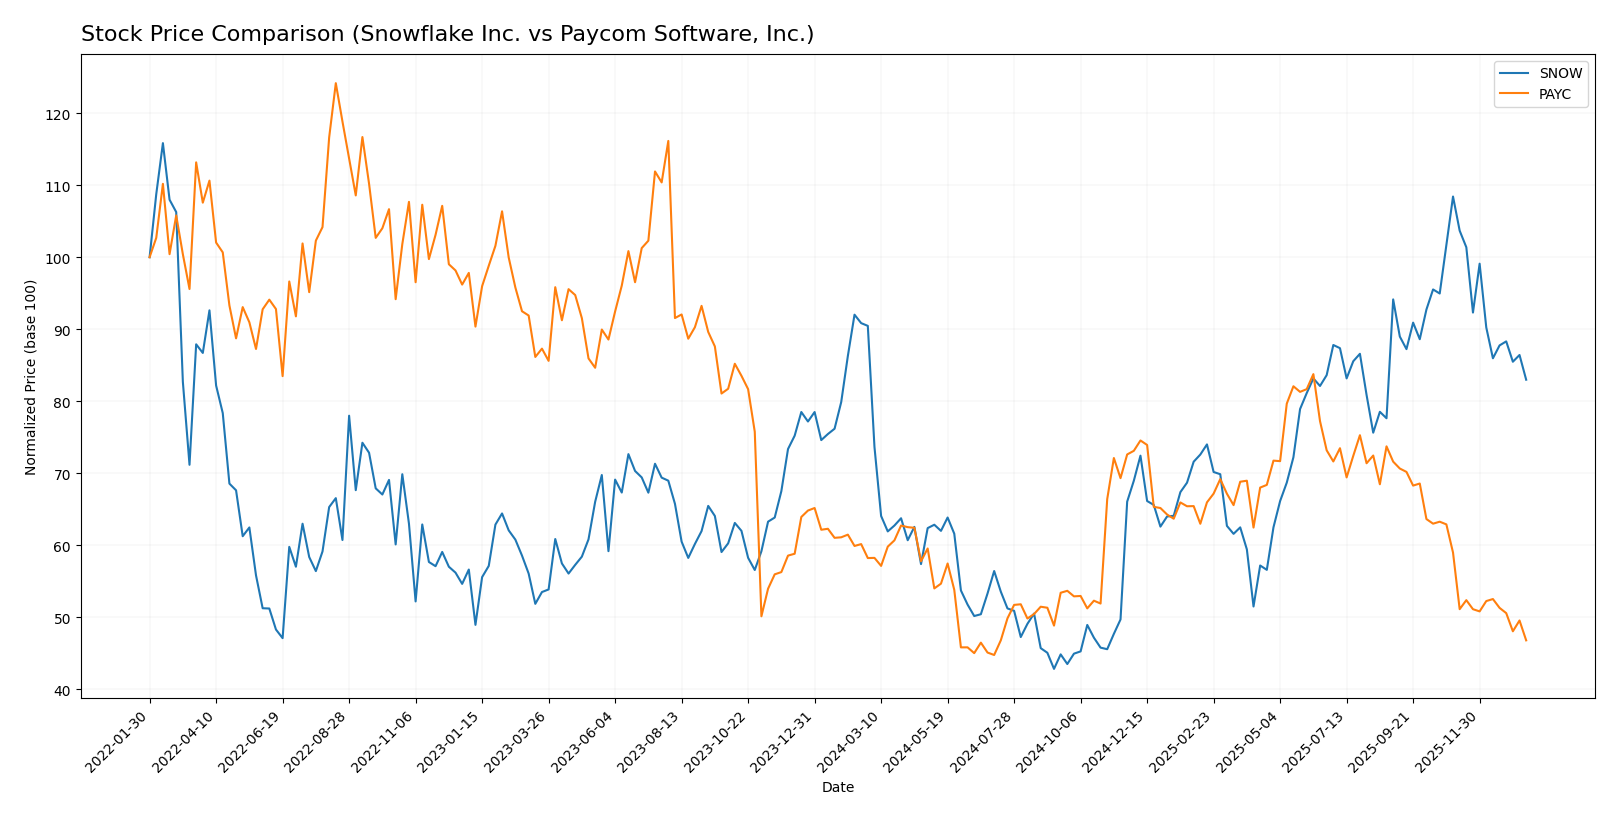
Stock Comparison
The stock prices of Snowflake Inc. and Paycom Software, Inc. have both experienced notable bearish trends over the past 12 months, marked by decelerating declines and decreasing trading volumes.
Trend Analysis
Snowflake Inc. (SNOW) showed a bearish trend with an 8.27% price decline over the past year, accompanied by deceleration and high volatility, with prices ranging from 108.56 to 274.88.
Paycom Software, Inc. (PAYC) also displayed a bearish trend, with a steeper 19.64% price drop and deceleration, lower volatility than SNOW, and prices fluctuating between 141.96 and 265.71.
Comparing both, SNOW has delivered the highest market performance, experiencing a smaller price decline than PAYC over the 12-month period.
Target Prices
The current analyst consensus suggests notable upside potential for both Snowflake Inc. and Paycom Software, Inc.
| Company | Target High | Target Low | Consensus |
|---|---|---|---|
| Snowflake Inc. | 325 | 237 | 281.86 |
| Paycom Software, Inc. | 290 | 165 | 215 |
Analysts expect Snowflake’s stock to appreciate significantly from its current price of $210.38, while Paycom’s target consensus of $215 indicates a potential recovery from the current $148.41 price level.
Analyst Opinions Comparison
This section compares analysts’ ratings and grades for Snowflake Inc. and Paycom Software, Inc.:
Rating Comparison
Snowflake Inc. Rating
- Rating: C-, considered very favorable overall rating despite low scores.
- Discounted Cash Flow Score: 3, moderate indication of valuation based on future cash flow.
- ROE Score: 1, very unfavorable, indicating low efficiency in generating shareholder profit.
- ROA Score: 1, very unfavorable, reflecting poor asset utilization.
- Debt To Equity Score: 1, very unfavorable, suggesting higher financial risk.
- Overall Score: 1, very unfavorable, indicating generally weak financial health.
Paycom Software, Inc. Rating
- Rating: A, rated very favorable with strong financial metrics across most categories.
- Discounted Cash Flow Score: 5, very favorable, indicating strong future cash flow.
- ROE Score: 5, very favorable, showing high profitability from equity.
- ROA Score: 5, very favorable, demonstrating efficient asset use.
- Debt To Equity Score: 4, favorable, indicating relatively low financial leverage.
- Overall Score: 4, favorable, reflecting strong overall financial standing.
Which one is the best rated?
Based strictly on the available data, Paycom Software, Inc. holds a significantly better rating and financial scores compared to Snowflake Inc. Paycom’s scores indicate stronger profitability, asset utilization, and financial stability, resulting in a more favorable overall evaluation.
Scores Comparison
The following table compares the Altman Z-Score and Piotroski Score for Snowflake Inc. and Paycom Software, Inc.:
SNOW Scores
- Altman Z-Score: 5.36, indicating a safe financial zone with low bankruptcy risk.
- Piotroski Score: 4, reflecting average financial strength and moderate investment quality.
PAYC Scores
- Altman Z-Score: 3.84, indicating a safe financial zone with low bankruptcy risk.
- Piotroski Score: 5, reflecting average financial strength and moderate investment quality.
Which company has the best scores?
Both SNOW and PAYC are in the safe zone by Altman Z-Score, but SNOW’s score is higher. PAYC has a slightly better Piotroski Score. Overall, both show moderate financial strength based strictly on these scores.
Grades Comparison
The following is a comparison of recent grades assigned to Snowflake Inc. and Paycom Software, Inc.:
Snowflake Inc. Grades
This table summarizes recent analyst grades and rating actions for Snowflake Inc.
| Grading Company | Action | New Grade | Date |
|---|---|---|---|
| Barclays | Downgrade | Equal Weight | 2026-01-12 |
| Argus Research | Upgrade | Buy | 2026-01-08 |
| Citigroup | Maintain | Buy | 2025-12-08 |
| Wells Fargo | Maintain | Overweight | 2025-12-04 |
| Keybanc | Maintain | Overweight | 2025-12-04 |
| Piper Sandler | Maintain | Overweight | 2025-12-04 |
| Morgan Stanley | Maintain | Overweight | 2025-12-04 |
| Wedbush | Maintain | Outperform | 2025-12-04 |
| Deutsche Bank | Maintain | Buy | 2025-12-04 |
| Cantor Fitzgerald | Maintain | Overweight | 2025-12-04 |
Snowflake’s grades show a strong tendency towards buy and overweight ratings, with only one recent downgrade to equal weight.
Paycom Software, Inc. Grades
This table summarizes recent analyst grades and rating actions for Paycom Software, Inc.
| Grading Company | Action | New Grade | Date |
|---|---|---|---|
| Barclays | Maintain | Equal Weight | 2026-01-12 |
| TD Cowen | Maintain | Buy | 2026-01-08 |
| Citigroup | Maintain | Neutral | 2025-12-23 |
| Keybanc | Maintain | Overweight | 2025-11-06 |
| TD Cowen | Maintain | Buy | 2025-11-06 |
| UBS | Maintain | Buy | 2025-11-06 |
| Jefferies | Maintain | Hold | 2025-11-06 |
| JP Morgan | Maintain | Neutral | 2025-11-06 |
| Mizuho | Maintain | Neutral | 2025-11-06 |
| Barclays | Maintain | Equal Weight | 2025-11-06 |
Paycom’s grades are mixed, with many hold and neutral ratings alongside some buy and overweight ratings, reflecting more cautious sentiment.
Which company has the best grades?
Snowflake Inc. has received predominantly buy and overweight grades, reflecting stronger analyst confidence compared to Paycom Software, Inc., which has more hold and neutral ratings. This difference may influence investors’ perception of growth potential and risk profiles.
Strengths and Weaknesses
Below is a comparative overview of key strengths and weaknesses for Snowflake Inc. (SNOW) and Paycom Software, Inc. (PAYC) based on the most recent data.
| Criterion | Snowflake Inc. (SNOW) | Paycom Software, Inc. (PAYC) |
|---|---|---|
| Diversification | Moderate product mix with $3.46B in product revenue and $164M in services (2025) | Highly recurring revenue model with $1.73B recurring and $24M implementation services (2024) |
| Profitability | Negative net margin (-35.45%) and ROIC (-25.24%), value destroying with declining profitability | Strong profitability with 26.66% net margin and 24.86% ROIC, creating shareholder value |
| Innovation | Invests heavily in data cloud innovation but struggling to translate into profits | Consistent innovation in HR/payroll software maintaining competitive edge |
| Global presence | Expanding global footprint but high costs impacting margins | Primarily US-focused, steady domestic market growth |
| Market Share | Growing but facing intense competition and financial challenges | Established strong position in payroll software with durable competitive advantage |
Key takeaways: Paycom demonstrates a robust financial and operational profile with growing profitability and a durable moat, making it a favorable investment. Snowflake, despite growth in revenue and innovation, shows significant financial challenges and value destruction, warranting cautious consideration.
Risk Analysis
The following table summarizes key risks for Snowflake Inc. (SNOW) and Paycom Software, Inc. (PAYC) based on their recent financial and operational profiles:
| Metric | Snowflake Inc. (SNOW) | Paycom Software, Inc. (PAYC) |
|---|---|---|
| Market Risk | Beta 1.144, high volatility in software sector | Beta 0.824, relatively lower volatility |
| Debt Level | Debt-to-Equity 0.9 (neutral), Debt-to-Assets 29.72% (favorable) | Debt-to-Equity 0.05 (favorable), Debt-to-Assets 1.42% (favorable) |
| Regulatory Risk | Moderate, U.S. and international data privacy laws impact | Moderate, U.S. labor and payroll regulations |
| Operational Risk | Negative net margin (-35.45%), ROE (-42.86%) indicates operational challenges | Strong net margin (26.66%), ROE (31.85%) reflects efficient operations |
| Environmental Risk | Low direct environmental impact, typical for SaaS | Low direct environmental impact, typical for SaaS |
| Geopolitical Risk | Exposure to global markets may influence data compliance | Primarily U.S.-focused, less exposed to geopolitical shifts |
Snowflake faces significant operational risks with negative profitability and returns, despite manageable debt levels and moderate market risk. Paycom shows strong operational performance and low financial risk but has moderate regulatory exposure. Market volatility and regulatory environments remain the most impactful risks for both.
Which Stock to Choose?
Snowflake Inc. (SNOW) shows strong revenue growth of 29.21% in 2025 but suffers from negative net margins (-35.45%) and declining profitability, with unfavorable ROE (-42.86%) and ROIC (-25.24%). Its debt level is moderate and rating is mixed, reflecting a slightly unfavorable financial profile.
Paycom Software, Inc. (PAYC) displays consistent income growth at 11.19% and solid profitability, with favorable net margin (26.66%), ROE (31.85%), and ROIC (24.86%). Its low debt and strong interest coverage complement a very favorable rating, suggesting financial stability and efficient capital use.
Considering ratings and financials, PAYC might appear more favorable for investors seeking stability and profitability, while SNOW’s higher growth but negative returns could appeal to risk-tolerant investors focused on growth potential. The choice could depend on individual risk appetite and investment strategy.
Disclaimer: Investment carries a risk of loss of initial capital. The past performance is not a reliable indicator of future results. Be sure to understand risks before making an investment decision.
Go Further
I encourage you to read the complete analyses of Snowflake Inc. and Paycom Software, Inc. to enhance your investment decisions: