Home > Comparison > Technology > SHOP vs PAYC
The strategic rivalry between Shopify Inc. and Paycom Software defines the trajectory of the technology sector’s software application industry. Shopify operates a capital-intensive commerce platform spanning global e-commerce channels, while Paycom delivers a high-margin, cloud-based human capital management SaaS solution focused on U.S. businesses. This analysis probes which growth model offers superior risk-adjusted returns. I aim to clarify which company better aligns with a diversified portfolio’s long-term objectives.
Table of contents
Companies Overview
Shopify and Paycom stand as pivotal players in the software application landscape, each shaping distinct market verticals with robust platforms.
Shopify Inc.: Leading Commerce Platform Provider
Shopify dominates the e-commerce platform market by enabling merchants to create and operate multi-channel sales storefronts worldwide. Its revenue flows from subscription solutions and merchant services, including payments and fulfillment. In 2026, Shopify focuses on expanding its merchant solutions suite and enhancing cross-border commerce capabilities to deepen market penetration.
Paycom Software, Inc.: Comprehensive HCM Software Innovator
Paycom commands the human capital management (HCM) sector with a cloud-based SaaS platform tailored for U.S. small to mid-sized businesses. It generates revenue through subscription fees for talent acquisition, payroll, and workforce management applications. Its strategic priority in 2026 lies in advancing data analytics and mobile management tools to streamline the employment lifecycle.
Strategic Collision: Similarities & Divergences
Both companies leverage SaaS platforms but diverge sharply in end markets: Shopify targets commerce infrastructure while Paycom specializes in workforce management. Their battleground centers on delivering integrated, scalable software that enhances operational efficiency. Shopify appeals to global merchants with diverse sales channels; Paycom focuses on labor-intensive client segments prioritizing compliance and payroll precision. Their investment profiles differ with Shopify exposed to global e-commerce volatility, Paycom anchored in steady, recurring HCM demand.
Income Statement Comparison
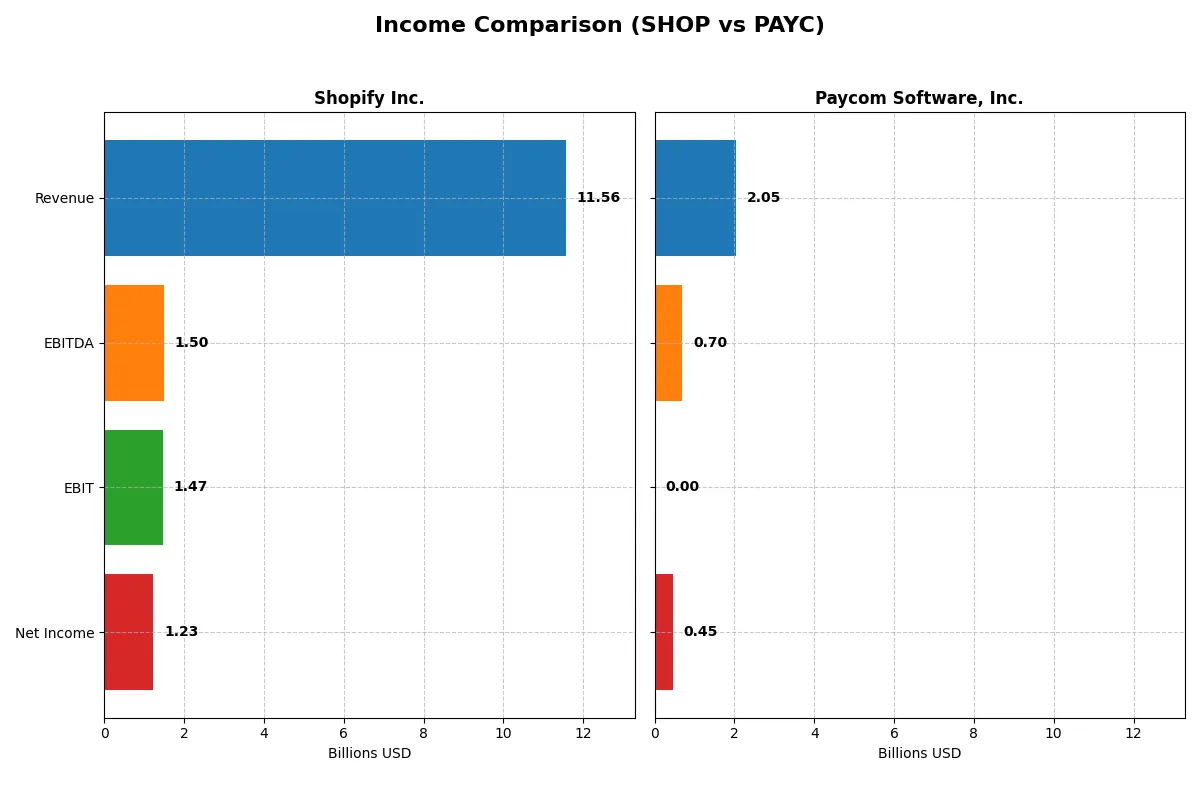
This data dissects the core profitability and scalability of both corporate engines to reveal who dominates the bottom line:
| Metric | Shopify Inc. (SHOP) | Paycom Software, Inc. (PAYC) |
|---|---|---|
| Revenue | 11.6B | 2.1B |
| Cost of Revenue | 6.0B | 345M |
| Operating Expenses | 4.1B | 1.0B |
| Gross Profit | 5.6B | 1.7B |
| EBITDA | 1.5B | 698M |
| EBIT | 1.5B | 0 |
| Interest Expense | 0 | 3.4M |
| Net Income | 1.2B | 453M |
| EPS | 0.95 | 8.13 |
| Fiscal Year | 2025 | 2025 |
Income Statement Analysis: The Bottom-Line Duel
This income statement comparison reveals which company operates its business with superior efficiency and sustainable profitability.
Shopify Inc. Analysis
Shopify’s revenue surged 30% in 2025 to $11.6B, reflecting strong top-line momentum over five years. Gross margin holds favorably at 48%, but net income dropped 39% year-over-year to $1.23B, signaling margin compression. Despite expanding operating expenses aligned with growth, its net margin slipped to 10.7%, highlighting emerging profitability challenges.
Paycom Software, Inc. Analysis
Paycom posted steady revenue growth, reaching $2.05B in 2025, up nearly 9% from the prior year. Its gross margin impresses at 83%, underscoring operational leverage. However, EBIT margin fell to zero, and net income declined 10% to $453M, reflecting rising costs. Still, a solid 22.1% net margin shows disciplined cost control amid slower EBIT momentum.
Margin Strength vs. Scale Momentum
Shopify leads in scale with $11.6B revenue but struggles with declining net margins and income, eroding profitability despite favorable gross margins. Paycom, smaller at $2B revenue, delivers superior gross and net margins, though EBIT setbacks signal caution. For investors, Shopify offers growth-driven scale, while Paycom exemplifies margin resilience and capital efficiency.
Financial Ratios Comparison
These vital ratios act as a diagnostic tool to expose the underlying fiscal health, valuation premiums, and capital efficiency of the companies compared below:
| Ratios | Shopify Inc. (SHOP) | Paycom Software, Inc. (PAYC) |
|---|---|---|
| ROE | 9.1% | 31.9% |
| ROIC | 15.7% | 24.9% |
| P/E | 170x | 19.6x |
| P/B | 15.5x | — |
| Current Ratio | 12.9 | — |
| Quick Ratio | 12.9 | — |
| D/E | 0.014 | 0 |
| Debt-to-Assets | 1.2% | 0% |
| Interest Coverage | 0 | -167x |
| Asset Turnover | 0.76 | 0 |
| Fixed Asset Turnover | 82.0 | 0 |
| Payout ratio | 0% | 18.7% |
| Dividend yield | 0% | 0.95% |
| Fiscal Year | 2025 | 2025 |
Efficiency & Valuation Duel: The Vital Signs
Financial ratios act as a company’s DNA, exposing hidden risks and operational strengths behind headline numbers.
Shopify Inc.
Shopify shows a moderate net margin of 10.65% but a weak ROE of 9.14%, signaling inefficiency in equity use. Its P/E of 170 and P/B of 15.5 mark the stock as highly stretched. Shopify pays no dividends, reinvesting heavily into R&D, aiming for growth despite valuation concerns.
Paycom Software, Inc.
Paycom boasts a strong net margin at 22.1%, with a P/E near 20 reflecting a more reasonable valuation. However, key returns like ROE and ROIC are reported as zero, which raises questions. It offers a small dividend yield of 0.95%, balancing shareholder returns with reinvestment needs.
Premium Valuation vs. Operational Safety
Shopify trades at a significant premium but struggles with below-cost-of-capital returns, while Paycom shows operational strength amid some data gaps. Paycom offers a better risk-reward balance for value-conscious investors. Shopify suits growth-focused profiles willing to pay for future potential.
Which one offers the Superior Shareholder Reward?
I compare Shopify Inc. (SHOP) and Paycom Software, Inc. (PAYC) on their shareholder reward strategies. Shopify pays no dividends and has no buybacks, focusing all free cash flow (~$1.5/share in 2025) on growth and reinvestment, which suits its high P/E of 170. Paycom offers a modest dividend yield near 0.95% and a payout ratio around 18–19%, supported by strong free cash flow (~$7.3/share) and healthy operating margins above 27%. Paycom also runs consistent buybacks, enhancing total return. I see Paycom’s balanced dividend and buyback approach as more sustainable and attractive for income-focused investors. Shopify’s zero payout signals long-term growth, but with elevated valuation risks. In 2026, Paycom offers the superior total return profile due to its disciplined capital allocation and shareholder distributions.
Comparative Score Analysis: The Strategic Profile
The radar chart reveals the fundamental DNA and trade-offs of Shopify Inc. and Paycom Software, Inc.:
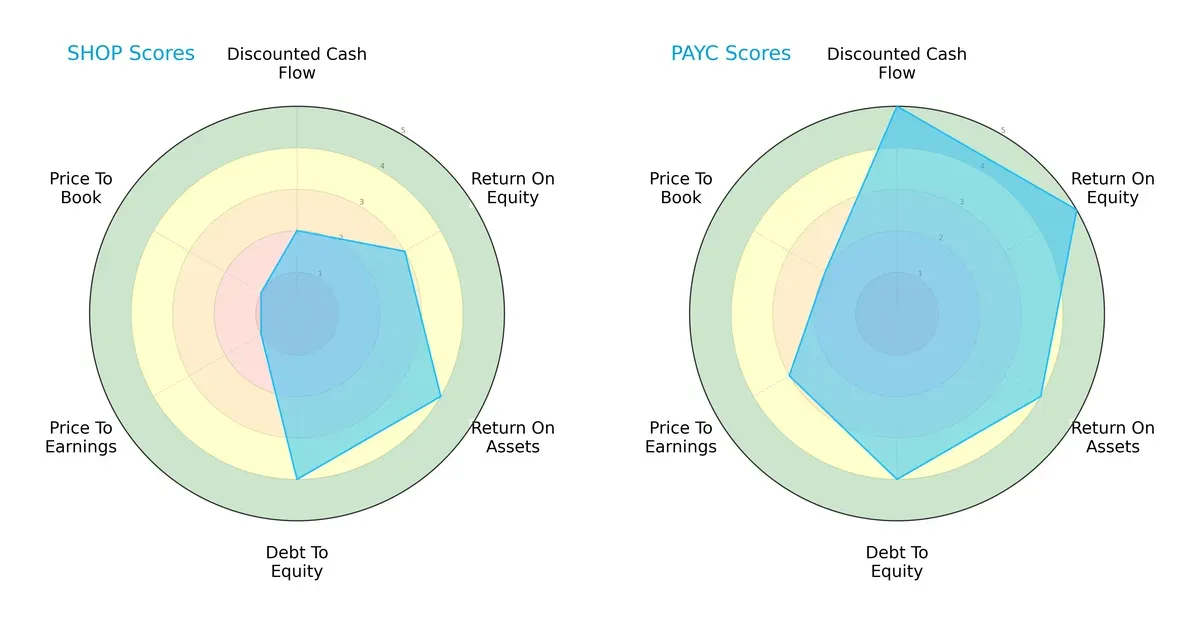
Paycom exhibits a superior overall score, driven by excellent discounted cash flow and return on equity metrics. Shopify lags with weaker valuation scores (PE/PB), indicating potential overvaluation. Shopify’s strength lies in asset utilization and conservative debt levels, but Paycom offers a more balanced and robust financial profile, leveraging strong profitability and fair valuation.
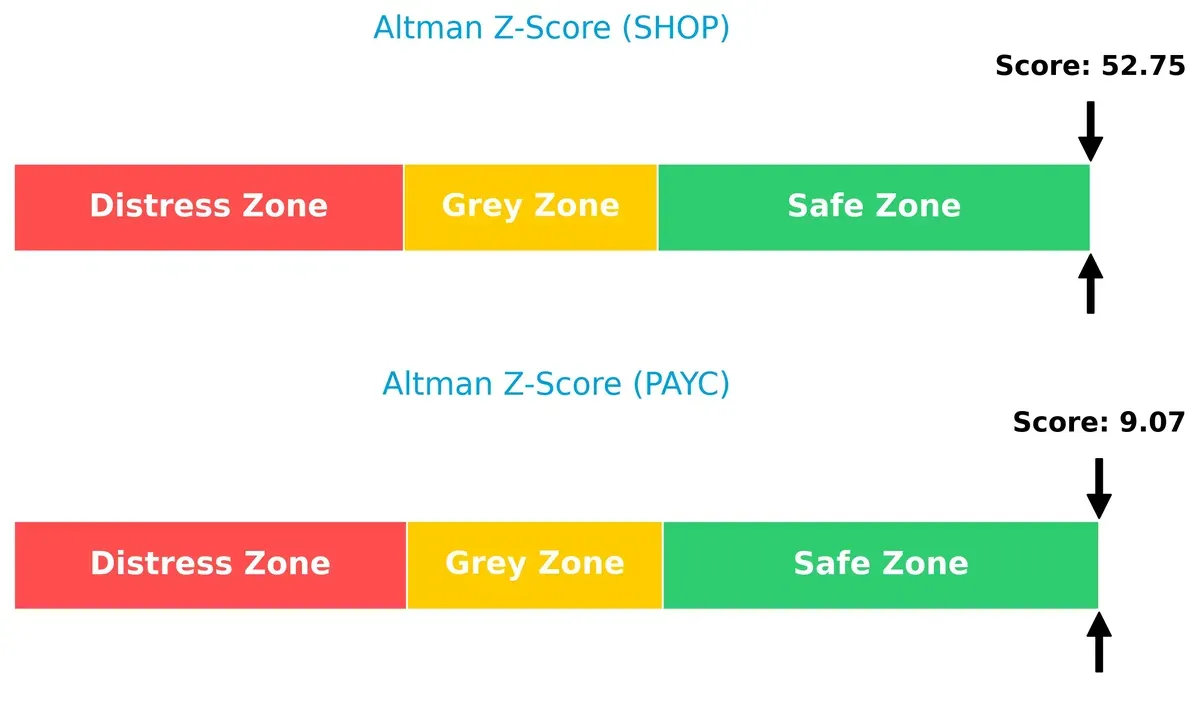
Bankruptcy Risk: Solvency Showdown
Paycom’s Altman Z-Score of 9.07 versus Shopify’s 52.75 signals both firms are in the safe zone, but Shopify’s extraordinarily high score suggests exceptional financial stability and near-zero bankruptcy risk in this cycle:
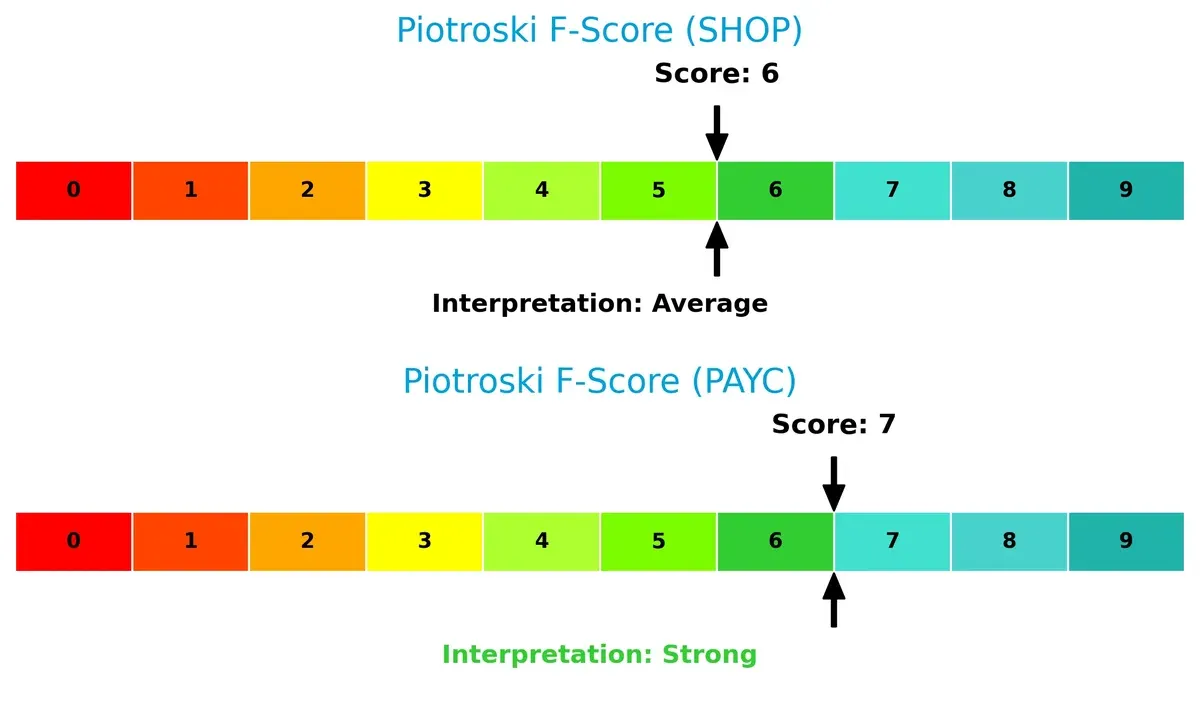
Financial Health: Quality of Operations
Paycom’s Piotroski F-Score of 7 outperforms Shopify’s 6, indicating stronger internal financial strength and operational quality. Shopify’s slightly lower score may raise minor red flags on efficiency or leverage compared to Paycom’s robust profile:
How are the two companies positioned?
This section dissects the operational DNA of SHOP and PAYC by comparing their revenue distribution and internal strengths and weaknesses. Our final objective is to confront their economic moats to reveal which business model offers the most resilient, sustainable competitive advantage today.
Revenue Segmentation: The Strategic Mix
This visual comparison dissects how Shopify Inc. and Paycom Software diversify their income streams and reveals their primary sector bets as of the latest fiscal year:
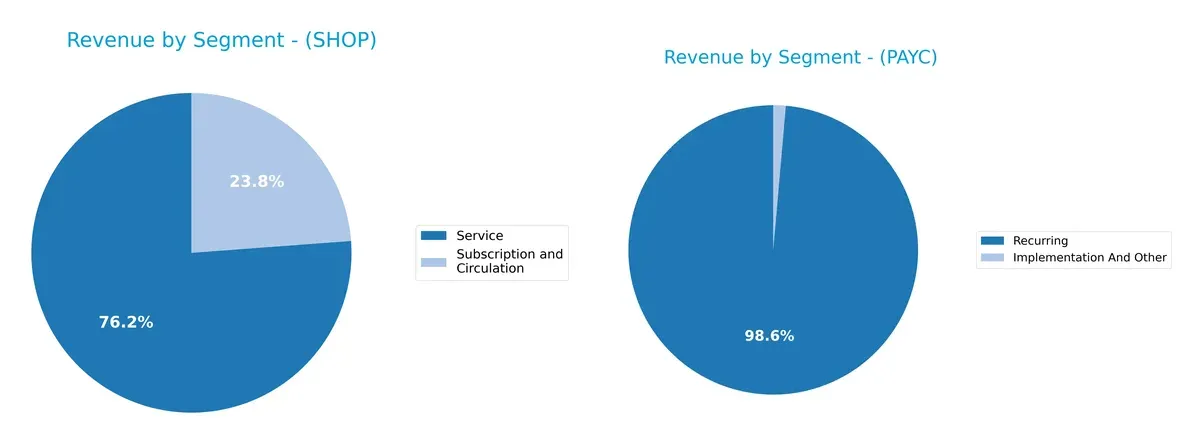
Shopify leans heavily on its Service segment, generating $8.8B, dwarfing its Subscription and Circulation at $2.75B. This mix signals a robust ecosystem lock-in through merchant services. Paycom, in contrast, pivots on Recurring revenue with $1.73B, dwarfing Implementation and Other at $24M, highlighting strong infrastructure dominance but less diversification. Shopify’s broader segment mix reduces concentration risk compared to Paycom’s focused model.
Strengths and Weaknesses Comparison
This table compares the Strengths and Weaknesses of Shopify Inc. and Paycom Software, Inc.:
Shopify Inc. Strengths
- High net margin at 10.65%
- Very low debt to assets at 1.24%
- Strong quick ratio of 12.86
- Exceptional fixed asset turnover at 81.96
- Diverse revenue streams from services and subscriptions
- Significant U.S. and international market presence
Paycom Software, Inc. Strengths
- Strong net margin at 22.1%
- Favorable price-to-book ratio at 0
- Low debt levels with debt to assets at 0
- Consistent recurring revenue stream
- Solid implementation services revenue
- Favorable debt to equity ratio
Shopify Inc. Weaknesses
- Unfavorable ROE at 9.14% below sector average
- ROIC below WACC at 15.66% vs 16.91%
- Extremely high P/E ratio at 169.86
- Very high price-to-book at 15.52
- Current ratio unusually high at 12.86 may indicate inefficient asset use
- No dividend yield
Paycom Software, Inc. Weaknesses
- Zero ROE and ROIC reflect lack of capital efficiency
- Unavailable WACC data limits valuation insight
- Poor current and quick ratios at 0
- Negative interest coverage ratio
- Zero asset turnover metrics indicate inefficiency
- Dividend yield unfavorable at 0.95%
Shopify benefits from diversified revenue and strong asset utilization but faces valuation and profitability efficiency concerns. Paycom excels in profitability but shows weakness in asset efficiency and liquidity, posing challenges for capital management.
The Moat Duel: Analyzing Competitive Defensibility
A structural moat is the only shield protecting long-term profits from relentless competitive erosion. Let’s dissect the moats at play:
Shopify Inc.: Network Effects Powerhouse
Shopify’s moat relies on network effects, linking merchants and buyers through its commerce platform. This drives robust revenue growth (150% over five years) and margin stability. Expansion into new regions and merchant services in 2026 could deepen this advantage.
Paycom Software, Inc.: Intangible Asset Fortress
Paycom’s moat centers on intangible assets—proprietary HCM software and data analytics—differentiating it from Shopify’s network. It commands strong gross margins (83%) and growing net income (+131% over five years). Yet, a declining ROIC trend signals possible future margin pressure.
Network Effects vs. Intangible Assets: The Moat Showdown
Shopify’s network effects deliver wider ecosystem lock-in, despite a slightly unfavorable ROIC versus WACC, while Paycom’s intangible moat shows strength in profitability but risks from fading ROIC. I see Shopify better positioned to defend and grow market share amid intensifying competition in 2026.
Which stock offers better returns?
Over the past 12 months, Shopify Inc. posted a strong 43.17% gain with decelerating momentum, while Paycom Software, Inc. suffered a 34.89% decline, reflecting contrasting price dynamics and market sentiment.
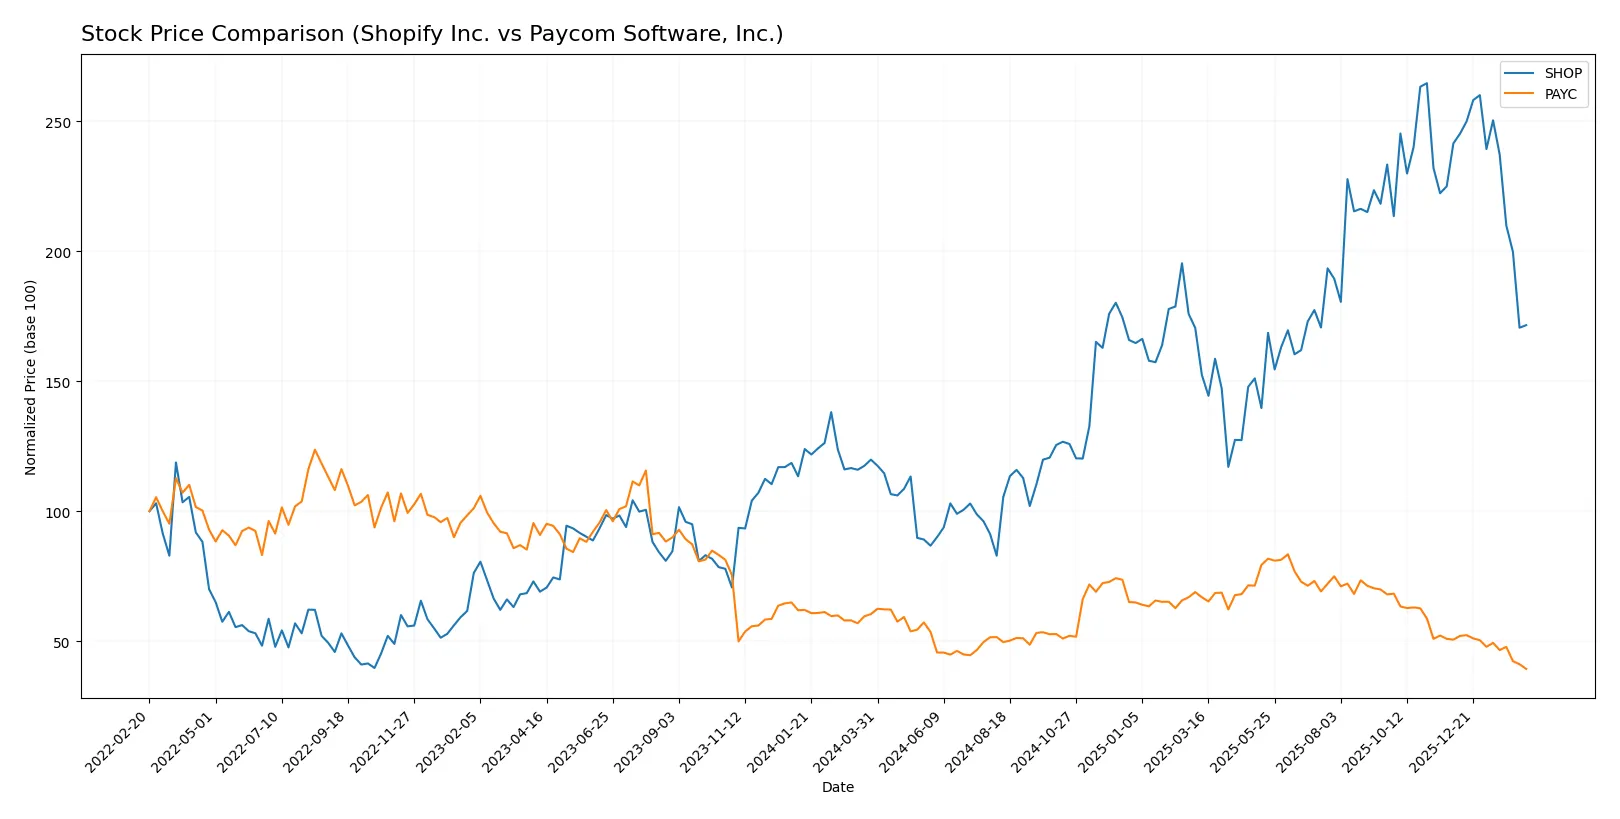
Trend Comparison
Shopify’s stock rose 43.17% over the past year, marking a bullish trend despite recent deceleration and a 28.96% drop in the last quarter.
Paycom’s stock fell 34.89% over 12 months, a clear bearish trend with decelerating losses and a 22.25% decline in the most recent quarter.
Shopify delivered the highest market performance, outperforming Paycom significantly in total price appreciation and trend direction.
Target Prices
Analysts show a bullish consensus on Shopify Inc. and Paycom Software, Inc., signaling potential upside from current levels.
| Company | Target Low | Target High | Consensus |
|---|---|---|---|
| Shopify Inc. | 115 | 200 | 167.04 |
| Paycom Software, Inc. | 115 | 210 | 151.82 |
Shopify’s consensus target of 167.04 implies a 48% upside from the current 112.7 price. Paycom’s 151.82 target suggests roughly 21% growth from 125.31. Both reflect strong analyst confidence.

Don’t Let Luck Decide Your Entry Point
Optimize your entry points with our advanced ProRealTime indicators. You’ll get efficient buy signals with precise price targets for maximum performance. Start outperforming now!
How do institutions grade them?
Shopify Inc. Grades
The table below summarizes recent institutional grades for Shopify Inc.:
| Grading Company | Action | New Grade | Date |
|---|---|---|---|
| Citigroup | Maintain | Buy | 2026-02-13 |
| Wells Fargo | Maintain | Overweight | 2026-02-12 |
| Truist Securities | Maintain | Hold | 2026-02-12 |
| UBS | Maintain | Neutral | 2026-02-12 |
| Mizuho | Upgrade | Outperform | 2026-02-12 |
| Citizens | Maintain | Market Outperform | 2026-02-12 |
| RBC Capital | Maintain | Outperform | 2026-02-12 |
| BMO Capital | Maintain | Outperform | 2026-02-12 |
| Cantor Fitzgerald | Maintain | Neutral | 2026-02-12 |
| Barclays | Maintain | Equal Weight | 2026-02-12 |
Paycom Software, Inc. Grades
The table below summarizes recent institutional grades for Paycom Software, Inc.:
| Grading Company | Action | New Grade | Date |
|---|---|---|---|
| Citigroup | Maintain | Neutral | 2026-02-13 |
| BMO Capital | Maintain | Market Perform | 2026-02-12 |
| Guggenheim | Maintain | Buy | 2026-02-12 |
| Keybanc | Maintain | Overweight | 2026-02-12 |
| Mizuho | Maintain | Neutral | 2026-02-12 |
| BTIG | Maintain | Buy | 2026-02-12 |
| Barclays | Maintain | Equal Weight | 2026-02-12 |
| Jefferies | Maintain | Hold | 2026-02-12 |
| Cantor Fitzgerald | Maintain | Neutral | 2026-02-12 |
| Cantor Fitzgerald | Maintain | Neutral | 2026-01-29 |
Which company has the best grades?
Shopify Inc. generally receives more bullish grades, including multiple Outperform and Buy ratings, compared to Paycom’s more Neutral and Hold consensus. This suggests investors may perceive Shopify as having stronger near-term growth potential.
Risks specific to each company
The following categories identify critical pressure points and systemic threats facing both firms in the 2026 market environment:
1. Market & Competition
Shopify Inc.
- Faces intense global competition in commerce platforms, with pressure from giants and niche players alike.
Paycom Software, Inc.
- Competes mainly in the US with specialized HCM SaaS providers, but faces evolving client demands and tech disruption.
2. Capital Structure & Debt
Shopify Inc.
- Maintains very low debt levels (D/E 0.01), signaling financial prudence and flexibility.
Paycom Software, Inc.
- No reported debt, indicating strong balance sheet but limited leverage use for growth.
3. Stock Volatility
Shopify Inc.
- High beta of 2.82 reveals significant volatility and market sensitivity.
Paycom Software, Inc.
- Low beta of 0.79 reflects relative stability and defensive price behavior.
4. Regulatory & Legal
Shopify Inc.
- Global footprint exposes it to varied compliance risks and data privacy regulations.
Paycom Software, Inc.
- US-focused operations reduce global regulatory complexity but face strict domestic labor laws and data protection rules.
5. Supply Chain & Operations
Shopify Inc.
- Complex supply chain across multiple regions increases vulnerability to disruptions.
Paycom Software, Inc.
- Cloud-based SaaS model reduces physical supply chain risks but depends heavily on data center reliability.
6. ESG & Climate Transition
Shopify Inc.
- Growing pressure to meet ESG standards globally, particularly in energy use and social governance.
Paycom Software, Inc.
- ESG demands rising domestically; transparency and sustainability efforts critical amid growing investor scrutiny.
7. Geopolitical Exposure
Shopify Inc.
- Operates worldwide, exposed to geopolitical tensions, trade restrictions, and currency fluctuations.
Paycom Software, Inc.
- Primarily US-centric, limiting direct geopolitical risk but sensitive to domestic political shifts.
Which company shows a better risk-adjusted profile?
Shopify’s most impactful risk is its high market volatility and global regulatory complexity, which heighten uncertainty. Paycom’s main risk is its unfavorable operational ratios and lack of leverage, limiting growth flexibility. Despite Shopify’s volatility, Paycom’s weak financial ratios and operational inefficiencies tilt its risk profile less favorably. Paycom’s strong Altman Z-score and Piotroski score reflect solid fundamentals, but its unfavorable financial ratios and dividend yield raise caution. Shopify’s elevated beta demands risk tolerance but benefits from prudent capital structure. Overall, Shopify shows a better risk-adjusted profile thanks to stronger liquidity and capital management, despite market headwinds.
Final Verdict: Which stock to choose?
Shopify Inc. (SHOP) excels as a cash machine with unmatched operational efficiency and robust revenue growth. Its main point of vigilance lies in a lofty valuation and a current ratio that signals excess liquidity, which may weigh on capital discipline. It suits aggressive growth portfolios willing to weather valuation volatility.
Paycom Software, Inc. (PAYC) commands a strategic moat through recurring revenue and strong gross margins, providing consistent profitability and cash flow. While it offers better financial stability than Shopify, its declining ROIC trend and vulnerabilities in capital allocation call for caution. It fits well in GARP (Growth at a Reasonable Price) portfolios seeking steady income.
If you prioritize aggressive growth with a focus on scaling operations and market expansion, Shopify appears the compelling choice due to its accelerating revenue and improving profitability. However, if you seek a more stable investment with a durable moat and solid cash generation, Paycom offers better stability despite its challenges. Both carry risks that warrant close monitoring.
Disclaimer: Investment carries a risk of loss of initial capital. The past performance is not a reliable indicator of future results. Be sure to understand risks before making an investment decision.
Go Further
I encourage you to read the complete analyses of Shopify Inc. and Paycom Software, Inc. to enhance your investment decisions: