In the dynamic world of software applications, Salesforce, Inc. (CRM) and Paycom Software, Inc. (PAYC) stand out as influential players with distinct yet overlapping market approaches. Salesforce leads with comprehensive customer relationship management solutions, while Paycom specializes in cloud-based human capital management for growing businesses. This comparison explores their innovation strategies and market positions to help you identify which company offers the most compelling investment opportunity today.
Table of contents
Companies Overview
I will begin the comparison between Salesforce and Paycom by providing an overview of these two companies and their main differences.
Salesforce Overview
Salesforce, Inc. is a global leader in customer relationship management (CRM) technology, offering a versatile Customer 360 platform that integrates sales, service, marketing, commerce, and analytics solutions. Headquartered in San Francisco, Salesforce serves various industries by enabling businesses to deliver connected, personalized customer experiences. Established in 1999, it has a market cap of approximately 219B USD and employs over 76K people.
Paycom Overview
Paycom Software, Inc. specializes in cloud-based human capital management (HCM) solutions tailored to small and mid-sized U.S. companies. Its SaaS platform covers the entire employment lifecycle, including talent acquisition, payroll, time management, and compliance. Founded in 1998 and based in Oklahoma City, Paycom has a market cap near 8.5B USD and employs about 7.3K staff, focusing on delivering comprehensive workforce management tools.
Key similarities and differences
Both Salesforce and Paycom operate in the software application industry with cloud-based platforms, but Salesforce targets broad CRM solutions across multiple sectors, while Paycom focuses on HCM for smaller U.S. businesses. Salesforce’s service range includes marketing, commerce, and analytics, whereas Paycom emphasizes payroll, talent management, and compliance. Salesforce’s scale and employee base far exceed those of Paycom, reflecting their differing market scopes and customer segments.
Income Statement Comparison
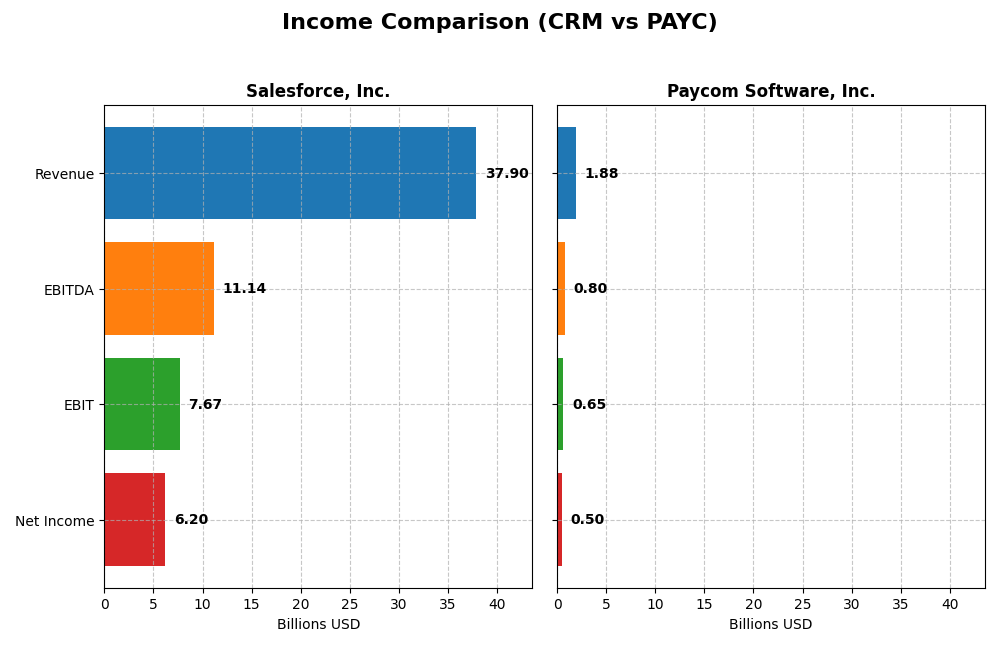
This table presents a side-by-side comparison of key income statement metrics for Salesforce, Inc. and Paycom Software, Inc. for their most recent fiscal years.
| Metric | Salesforce, Inc. (CRM) | Paycom Software, Inc. (PAYC) |
|---|---|---|
| Market Cap | 219B | 8.5B |
| Revenue | 37.9B | 1.88B |
| EBITDA | 11.1B | 798M |
| EBIT | 7.67B | 652M |
| Net Income | 6.20B | 502M |
| EPS | 6.44 | 8.93 |
| Fiscal Year | 2025 | 2024 |
Income Statement Interpretations
Salesforce, Inc.
Salesforce’s revenue grew steadily from $21.3B in 2021 to $37.9B in 2025, with net income rising from $4.07B to $6.20B over the same period. Margins mostly improved, with a strong gross margin of 77.19% in 2025 and an EBIT margin of 20.23%. The latest year showed favorable growth rates, including an 8.72% revenue increase and a 37.82% net margin expansion, indicating solid profitability momentum.
Paycom Software, Inc.
Paycom’s revenue expanded from $841M in 2020 to $1.88B in 2024, while net income surged from $143M to $502M. Margins remained robust, highlighted by an 82.23% gross margin and a 34.64% EBIT margin in 2024. The company delivered strong growth in the latest year, with an 11.19% revenue increase and a 32.48% rise in net margin, reflecting efficient cost management and operational leverage.
Which one has the stronger fundamentals?
Both companies present favorable income statement fundamentals, with Paycom showing stronger margin metrics and more pronounced net income growth over the period. Salesforce exhibits higher absolute revenue and net income figures and solid margin improvement, but its net margin declined overall. Paycom’s consistent margin expansion and faster growth rates suggest comparatively stronger profitability fundamentals based on the analyzed financials.
Financial Ratios Comparison
Below is a comparison of the latest key financial ratios for Salesforce, Inc. and Paycom Software, Inc. based on their 2025 and 2024 fiscal year-end data respectively.
| Ratios | Salesforce, Inc. (CRM) FY 2025 | Paycom Software, Inc. (PAYC) FY 2024 |
|---|---|---|
| ROE | 10.13% | 31.85% |
| ROIC | 7.95% | 24.86% |
| P/E | 53.04 | 22.95 |
| P/B | 5.37 | 7.31 |
| Current Ratio | 1.06 | 1.10 |
| Quick Ratio | 1.06 | 1.10 |
| D/E | 0.19 | 0.05 |
| Debt-to-Assets | 11.07% | 1.42% |
| Interest Coverage | 26.49 | 186.56 |
| Asset Turnover | 0.37 | 0.32 |
| Fixed Asset Turnover | 7.03 | 2.93 |
| Payout ratio | 24.80% | 16.89% |
| Dividend yield | 0.47% | 0.74% |
Interpretation of the Ratios
Salesforce, Inc.
Salesforce shows a mixed ratio profile with favorable net margin (16.35%) and strong solvency indicated by low debt-to-equity (0.19) and high interest coverage (28.18). However, elevated valuation multiples like a PE of 53.04 and PB of 5.37 raise concerns. The dividend yield is low at 0.47%, reflecting modest shareholder returns supported by a stable dividend payout.
Paycom Software, Inc.
Paycom demonstrates robust profitability with a 26.66% net margin and high returns on equity (31.85%) and invested capital (24.86%). It maintains strong financial health with low debt ratios and exceptional interest coverage (191.88). Despite a higher PB ratio (7.31), the PE ratio is reasonable at 22.95. Dividend yield is modest at 0.74%, indicating measured income distribution to shareholders.
Which one has the best ratios?
Paycom exhibits a more favorable overall ratio profile, with stronger profitability, better capital returns, and superior solvency ratios. Salesforce, while financially solid, shows less attractive valuation metrics and lower profitability ratios. Both companies maintain modest dividend yields, but Paycom’s broader favorable metrics suggest stronger financial fundamentals in this comparison.
Strategic Positioning
This section compares the strategic positioning of Salesforce, Inc. and Paycom Software, Inc. in terms of Market position, Key segments, and Exposure to technological disruption:
Salesforce, Inc.
- Leading global CRM provider with large market cap and high competitive pressure in software applications.
- Diverse business segments including Sales, Service, Marketing, Commerce, Integration, Analytics, and Platform.
- Exposure to disruption through integration and analytics platforms, with ongoing innovation in cloud services.
Paycom Software, Inc.
- Focused on cloud-based HCM for small to mid-sized US companies, facing moderate competitive pressure.
- Concentrated on human capital management software with recurring revenue from talent acquisition and payroll.
- Emphasizes proprietary tech like Microfence Bluetooth and analytics, addressing evolving workforce needs.
Salesforce, Inc. vs Paycom Software, Inc. Positioning
Salesforce pursues a diversified approach across multiple cloud-based CRM and analytics segments, offering broad market coverage. Paycom focuses on a concentrated HCM niche with specialized solutions, potentially limiting diversification but enhancing domain expertise.
Which has the best competitive advantage?
Paycom exhibits a very favorable MOAT with ROIC well above WACC and growing profitability, indicating a durable competitive advantage. Salesforce shows a slightly unfavorable MOAT despite growing ROIC, suggesting current value destruction but improving performance.
Stock Comparison
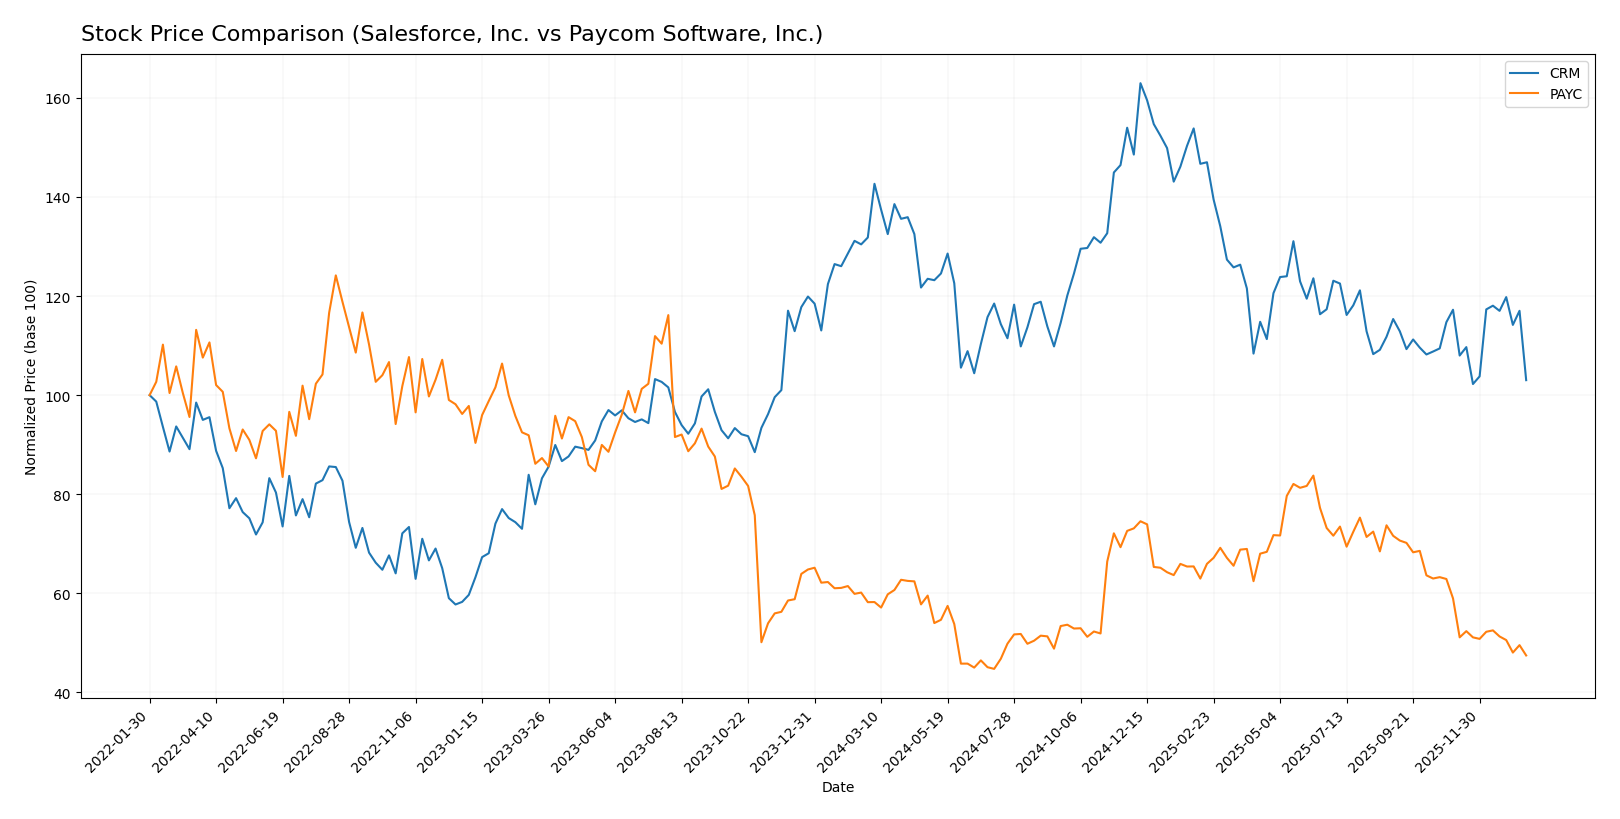
The stock price movements of Salesforce, Inc. (CRM) and Paycom Software, Inc. (PAYC) over the past 12 months reveal significant bearish trends with contrasting acceleration and volume dynamics influencing their trading patterns.
Trend Analysis
Salesforce, Inc. (CRM) experienced a bearish trend over the past year with a price decline of 21.84%, showing acceleration in the downtrend and a high volatility indicated by a 31.79 std deviation. The stock hit a high of 361.99 and a low of 227.11.
Paycom Software, Inc. (PAYC) also faced a bearish trend over the same period with an 18.47% price drop, but its decline is decelerating. Volatility is comparable at 31.89 std deviation, with a peak price of 265.71 and a low of 141.96.
Comparing both, CRM’s stock delivered a larger negative return than PAYC, indicating a steeper market performance decline for Salesforce relative to Paycom over the past year.
Target Prices
The target price consensus for Salesforce, Inc. and Paycom Software, Inc. indicates moderate upside potential based on current analyst estimates.
| Company | Target High | Target Low | Consensus |
|---|---|---|---|
| Salesforce, Inc. | 400 | 250 | 324.17 |
| Paycom Software, Inc. | 290 | 165 | 221.67 |
Analysts expect Salesforce’s price to appreciate from its current 228.88 USD to around 324.17 USD on average, signaling attractive growth potential. Paycom’s consensus target of 221.67 USD also suggests a significant upside from the current 150.21 USD market price.
Analyst Opinions Comparison
This section compares analysts’ ratings and grades for Salesforce, Inc. and Paycom Software, Inc.:
Rating Comparison
Salesforce, Inc. Rating
- Rating: B+, considered very favorable by analysts.
- Discounted Cash Flow Score: 4, favorable assessment of valuation.
- ROE Score: 4, favorable efficiency in generating shareholder profit.
- ROA Score: 4, favorable asset utilization for earnings.
- Debt To Equity Score: 3, moderate financial risk profile.
- Overall Score: 3, moderate overall financial standing.
Paycom Software, Inc. Rating
- Rating: A, rated very favorable, indicating stronger analyst support.
- Discounted Cash Flow Score: 5, very favorable valuation score.
- ROE Score: 5, very favorable, showing superior equity profitability.
- ROA Score: 5, very favorable, demonstrating excellent asset use.
- Debt To Equity Score: 4, favorable indication of lower financial risk.
- Overall Score: 4, favorable overall financial standing.
Which one is the best rated?
Paycom Software, Inc. holds a higher overall rating (A) and superior scores across discounted cash flow, ROE, ROA, and debt to equity metrics compared to Salesforce’s B+ rating and moderate overall score.
Scores Comparison
The following table compares the Altman Z-Score and Piotroski Score of Salesforce and Paycom:
Salesforce Scores
- Altman Z-Score: 5.26, indicating a safe zone with low bankruptcy risk.
- Piotroski Score: 7, reflecting strong financial health.
Paycom Scores
- Altman Z-Score: 3.84, indicating a safe zone with low bankruptcy risk.
- Piotroski Score: 5, reflecting average financial health.
Which company has the best scores?
Salesforce has a higher Altman Z-Score and a stronger Piotroski Score compared to Paycom. Based strictly on the scores, Salesforce demonstrates better financial stability and strength.
Grades Comparison
Here is a detailed comparison of recent grades from recognized grading companies for Salesforce, Inc. and Paycom Software, Inc.:
Salesforce, Inc. Grades
The following table summarizes the latest grades given by established financial institutions for Salesforce, Inc.:
| Grading Company | Action | New Grade | Date |
|---|---|---|---|
| Barclays | Maintain | Overweight | 2026-01-12 |
| RBC Capital | Maintain | Sector Perform | 2026-01-05 |
| Morgan Stanley | Maintain | Overweight | 2025-12-09 |
| Citigroup | Maintain | Neutral | 2025-12-08 |
| DA Davidson | Maintain | Neutral | 2025-12-05 |
| Citizens | Maintain | Market Outperform | 2025-12-04 |
| Deutsche Bank | Maintain | Buy | 2025-12-04 |
| Wedbush | Maintain | Outperform | 2025-12-04 |
| Northland Capital Markets | Maintain | Market Perform | 2025-12-04 |
| Canaccord Genuity | Maintain | Buy | 2025-12-04 |
Overall, Salesforce shows a strong positive trend with multiple “Buy,” “Overweight,” and “Outperform” ratings, indicating confidence among analysts.
Paycom Software, Inc. Grades
The following table presents the recent grades from reputable financial firms for Paycom Software, Inc.:
| Grading Company | Action | New Grade | Date |
|---|---|---|---|
| Barclays | Maintain | Equal Weight | 2026-01-12 |
| TD Cowen | Maintain | Buy | 2026-01-08 |
| Citigroup | Maintain | Neutral | 2025-12-23 |
| Keybanc | Maintain | Overweight | 2025-11-06 |
| TD Cowen | Maintain | Buy | 2025-11-06 |
| UBS | Maintain | Buy | 2025-11-06 |
| Jefferies | Maintain | Hold | 2025-11-06 |
| JP Morgan | Maintain | Neutral | 2025-11-06 |
| Mizuho | Maintain | Neutral | 2025-11-06 |
| Barclays | Maintain | Equal Weight | 2025-11-06 |
The grades for Paycom are more mixed, with a consensus leaning towards “Hold” and several “Buy” and “Neutral” ratings, reflecting a cautious stance among analysts.
Which company has the best grades?
Salesforce, Inc. has received generally stronger and more consistent positive grades compared to Paycom Software, Inc., whose ratings are more varied and include more neutral and hold positions. This difference may influence investors by signaling a higher analyst confidence in Salesforce’s growth prospects and market positioning relative to Paycom.
Strengths and Weaknesses
Below is a comparison of key strengths and weaknesses for Salesforce, Inc. (CRM) and Paycom Software, Inc. (PAYC), based on their recent financial and operational data.
| Criterion | Salesforce, Inc. (CRM) | Paycom Software, Inc. (PAYC) |
|---|---|---|
| Diversification | Highly diversified with multiple cloud segments generating $35.9B in 2025 revenue, including Service Cloud and Sales Cloud | Less diversified, primarily focused on recurring payroll software, $1.76B recurring revenue in 2024 |
| Profitability | Moderate profitability: net margin 16.35%, ROIC 7.95% (slightly unfavorable moat) | High profitability: net margin 26.66%, ROIC 24.86%, very favorable moat |
| Innovation | Strong innovation with growing ROIC trend (+762%) but currently shedding value | Sustained innovation with growing ROIC (+54%), creating significant value |
| Global presence | Extensive global presence across multiple cloud solutions | Primarily North American market focus with solid growth |
| Market Share | Leading CRM market share with $90B+ in multi-cloud revenues | Smaller market share but rapidly growing in HR/payroll software |
Key takeaways: Salesforce offers broad market exposure and strong innovation but faces challenges in value creation. Paycom, with a narrower focus, demonstrates superior profitability and a durable competitive advantage, making it an attractive choice for investors seeking high returns with manageable risk.
Risk Analysis
Below is a comparative table of key risks for Salesforce, Inc. (CRM) and Paycom Software, Inc. (PAYC) based on the most recent data from 2025 and 2024 respectively.
| Metric | Salesforce, Inc. (CRM) | Paycom Software, Inc. (PAYC) |
|---|---|---|
| Market Risk | Beta 1.27, higher volatility typical of large tech firms | Beta 0.82, lower volatility reflecting smaller market cap |
| Debt Level | Debt-to-Equity 0.19, low leverage, favorable | Debt-to-Equity 0.05, very low leverage, highly favorable |
| Regulatory Risk | Moderate, due to global operations and data privacy laws | Moderate, focused on US market with labor regulations impact |
| Operational Risk | High complexity with diverse cloud and platform services | Moderate, SaaS model with fewer integration complexities |
| Environmental Risk | Moderate, with increasing ESG commitments in tech sector | Low to moderate, limited direct environmental footprint |
| Geopolitical Risk | Exposure to global markets including Europe and Asia | Primarily US-focused, lower geopolitical exposure |
The most impactful and likely risks for these companies relate to market volatility and regulatory challenges. Salesforce’s higher beta indicates greater sensitivity to market swings, while its global footprint increases regulatory and geopolitical risks. Paycom, with its smaller scale and US-centric operations, shows lower leverage and less geopolitical risk but remains exposed to evolving labor laws. Both maintain strong financial health with favorable leverage and liquidity metrics, reducing bankruptcy risk significantly.
Which Stock to Choose?
Salesforce, Inc. (CRM) shows a favorable income evolution with strong revenue and net income growth, a slightly favorable global financial ratio profile, moderate debt levels, and a very favorable B+ rating. Its MOAT evaluation is slightly unfavorable due to ROIC below WACC despite a growing ROIC trend.
Paycom Software, Inc. (PAYC) exhibits favorable income growth and profitability metrics, a favorable ratio assessment with mostly strong financials, minimal debt, and a very favorable A rating. Its MOAT evaluation is very favorable, indicating value creation and a durable competitive advantage with increasing profitability.
Investors focused on growth and strong value creation might find PAYC’s very favorable MOAT and rating more appealing, while those prioritizing a company with a long-term improving profitability trend and moderate ratios could interpret CRM’s profile as slightly favorable. The choice may appear to depend on risk tolerance and investment strategy.
Disclaimer: Investment carries a risk of loss of initial capital. The past performance is not a reliable indicator of future results. Be sure to understand risks before making an investment decision.
Go Further
I encourage you to read the complete analyses of Salesforce, Inc. and Paycom Software, Inc. to enhance your investment decisions: