In the fast-evolving software application industry, Paycom Software, Inc. and Perfect Corp. stand out with distinct yet overlapping innovation strategies. Paycom excels in cloud-based human capital management solutions for U.S. businesses, while Perfect Corp. leads in AI-driven augmented reality beauty and fashion tech globally. This comparison explores their market positions and growth potential, guiding investors to identify the most promising opportunity for their portfolio.
Table of contents
Companies Overview
I will begin the comparison between Paycom Software and Perfect Corp. by providing an overview of these two companies and their main differences.
Paycom Software Overview
Paycom Software, Inc. offers cloud-based human capital management (HCM) solutions as software-as-a-service targeting small to mid-sized U.S. companies. Its platform covers the entire employment lifecycle, including talent acquisition, time and labor management, payroll, and talent management applications. Founded in 1998 and headquartered in Oklahoma City, Paycom positions itself as a comprehensive provider of workforce management tools.
Perfect Corp. Overview
Perfect Corp. delivers SaaS artificial intelligence and augmented reality solutions for beauty and fashion tech businesses. Its offerings include virtual try-on technologies for makeup, hair, accessories, and more, along with AI-powered analysis tools. Established in 2015 and based in New Taipei City, Taiwan, Perfect Corp. focuses on enhancing consumer engagement through innovative digital experiences.
Key similarities and differences
Both companies operate in the software application industry within the technology sector, offering SaaS solutions to improve business or consumer processes. Paycom emphasizes human capital management for workforce administration, mainly in the U.S. market, while Perfect Corp. specializes in AI and AR-driven beauty and fashion tech globally. Their business models differ significantly in target markets, application focus, and scale, with Paycom having a larger workforce and market capitalization.
Income Statement Comparison
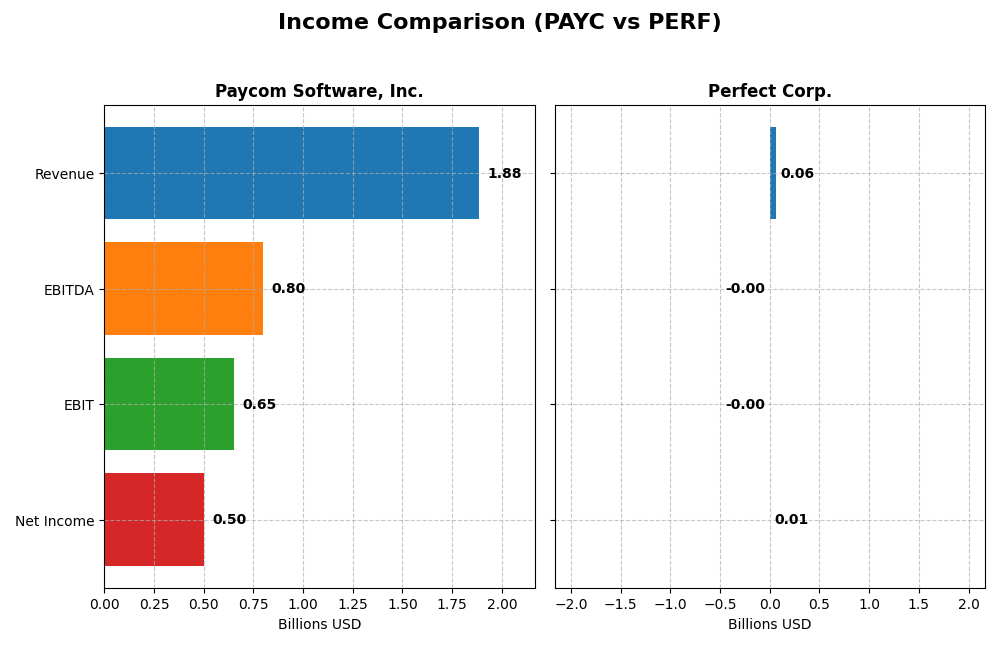
The table below compares the most recent fiscal year income statement figures for Paycom Software, Inc. and Perfect Corp., highlighting key financial metrics for 2024.
| Metric | Paycom Software, Inc. (PAYC) | Perfect Corp. (PERF) |
|---|---|---|
| Market Cap | 8.35B | 179M |
| Revenue | 1.88B | 60.2M |
| EBITDA | 798.3M | -2.05M |
| EBIT | 652.4M | -2.84M |
| Net Income | 502M | 5.02M |
| EPS | 8.93 | 0.05 |
| Fiscal Year | 2024 | 2024 |
Income Statement Interpretations
Paycom Software, Inc.
Paycom demonstrated strong revenue growth from 2020 to 2024, rising from $841M to $1.88B, with net income expanding from $143M to $502M. Margins remained robust and improved, with a gross margin above 82% and net margin near 27%. The 2024 fiscal year saw favorable growth in revenue (11.2%) and net income (32.5%), alongside improved EPS up 51.7%, highlighting solid operational efficiency.
Perfect Corp.
Perfect Corp. showed steady revenue growth from $29.9M in 2020 to $60.2M in 2024, accompanied by net income recovery from negative $5.6M to positive $5M. Gross margin stayed favorable at nearly 78%, though EBIT margin remained negative at -4.7%. The latest year’s growth slowed in net margin (-17.6%) and EBIT declined sharply, despite a 12.5% revenue increase, indicating challenges in controlling operating expenses.
Which one has the stronger fundamentals?
Paycom exhibits stronger fundamentals with consistently favorable margin profiles, significant growth in revenue and net income, and expanding profitability metrics. Perfect Corp. also improved but shows mixed results, with positive revenue and net income growth overshadowed by persistent negative EBIT margins and recent declines in net margin. Overall, Paycom displays more stable and favorable income statement trends.
Financial Ratios Comparison
The table below compares key financial ratios for Paycom Software, Inc. (PAYC) and Perfect Corp. (PERF) based on their most recent fiscal year data ending 2024.
| Ratios | Paycom Software, Inc. (PAYC) | Perfect Corp. (PERF) |
|---|---|---|
| ROE | 31.85% | 3.42% |
| ROIC | 24.86% | -2.10% |
| P/E | 22.95 | 56.6 |
| P/B | 7.31 | 1.93 |
| Current Ratio | 1.10 | 5.52 |
| Quick Ratio | 1.10 | 5.52 |
| D/E (Debt-to-Equity) | 0.053 | 0.0035 |
| Debt-to-Assets | 1.42% | 0.28% |
| Interest Coverage | 186.56 | -449 |
| Asset Turnover | 0.32 | 0.33 |
| Fixed Asset Turnover | 2.93 | 57.94 |
| Payout Ratio | 16.89% | 0% |
| Dividend Yield | 0.74% | 0% |
Interpretation of the Ratios
Paycom Software, Inc.
Paycom shows a generally favorable ratio profile with strong net margin at 26.66% and a robust return on equity of 31.85%, indicating efficient profitability. However, a high price-to-book ratio of 7.31 and a low dividend yield of 0.74% suggest valuation concerns and modest income return. The company pays dividends with coverage supported by free cash flow, though the yield remains low.
Perfect Corp.
Perfect Corp. exhibits a mixed ratio set with neutral net margin at 8.34% but unfavorable returns on equity (3.42%) and invested capital (-2.1%), signaling profitability challenges. Its zero dividend yield reflects a no-dividend policy consistent with reinvestment or growth focus. The company maintains low debt and a strong quick ratio, yet interest coverage is negative, raising caution on financial stability.
Which one has the best ratios?
Paycom Software, Inc. presents a more favorable overall ratios evaluation, with over 57% of metrics rated positively and solid profitability indicators. In contrast, Perfect Corp. has a slightly unfavorable profile due to weak return ratios and negative interest coverage, despite some favorable liquidity and leverage measures. Paycom’s financial metrics currently suggest stronger operational and financial health.
Strategic Positioning
This section compares the strategic positioning of Paycom Software, Inc. and Perfect Corp., focusing on market position, key segments, and exposure to technological disruption:
Paycom Software, Inc.
- Leading US-based HCM SaaS provider with strong market presence and moderate competitive pressure.
- Focuses on cloud-based human capital management for small to mid-sized US companies, driven by recurring revenue streams.
- Offers proprietary technologies like Microfence and advanced analytics, with ongoing innovation in workforce management.
Perfect Corp.
- Smaller market cap, Taiwan-based beauty and fashion AI/AR SaaS provider facing niche competition.
- Delivers AI and AR beauty and fashion tech solutions, including virtual try-ons and AI analysis apps.
- Relies on AI/AR innovations for virtual try-ons and personalized beauty tech, adapting to tech trends.
Paycom vs Perfect Positioning
Paycom operates a concentrated business model with a strong focus on US HCM SaaS recurring revenues and proprietary tech, while Perfect Corp. pursues a specialized niche in AI/AR beauty and fashion solutions. Paycom’s larger scale contrasts with Perfect’s innovative but narrower scope.
Which has the best competitive advantage?
Paycom demonstrates a very favorable moat with growing ROIC well above WACC, indicating durable competitive advantage. Perfect Corp. shows a slightly unfavorable moat with negative value creation despite improving profitability, reflecting weaker competitive positioning.
Stock Comparison
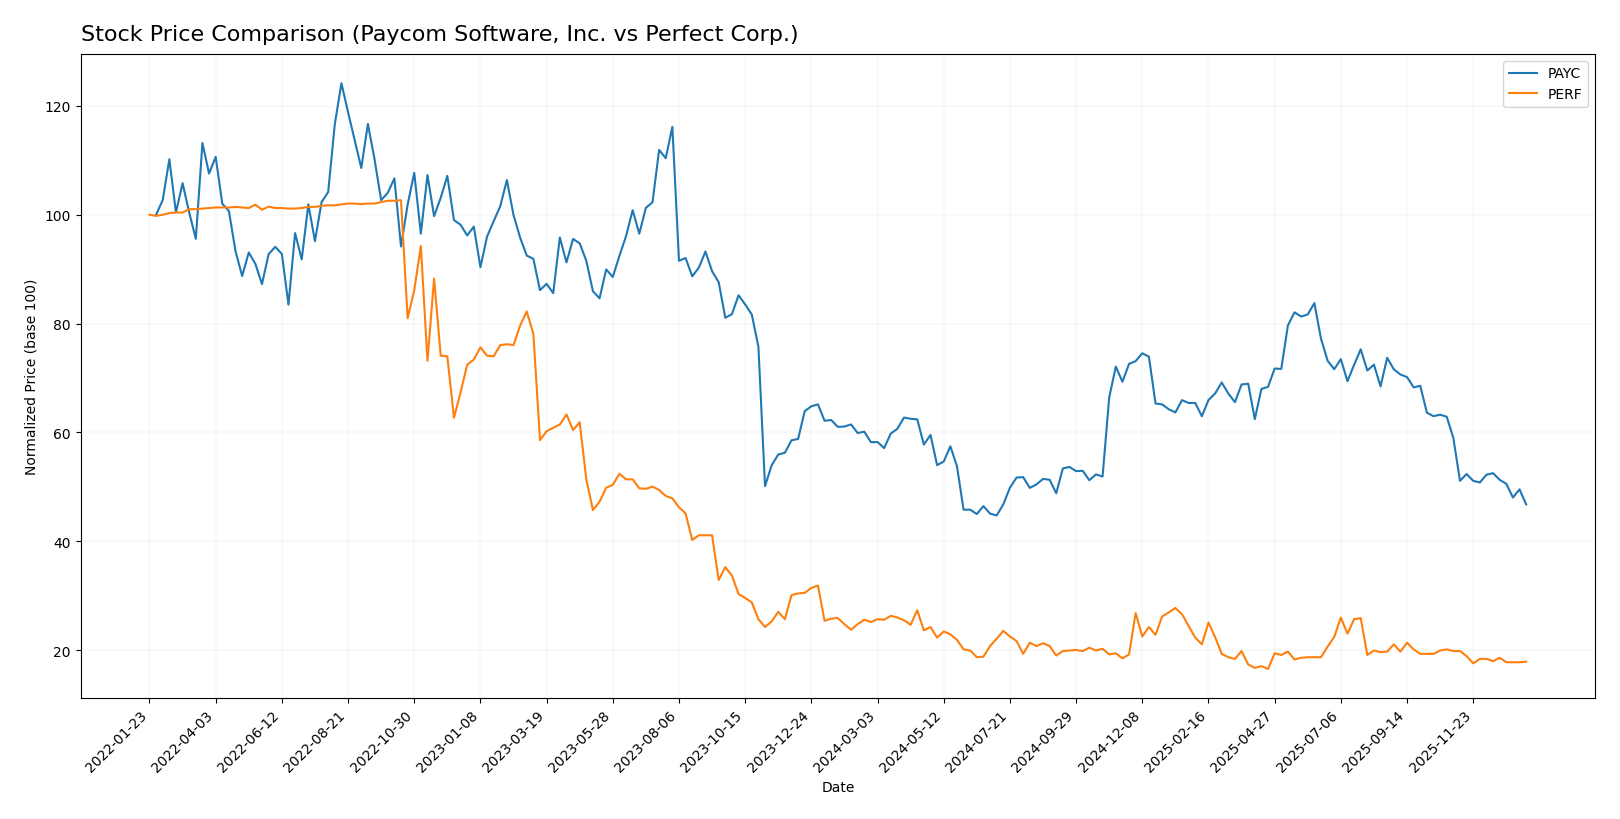
The stock prices of Paycom Software, Inc. (PAYC) and Perfect Corp. (PERF) have both exhibited significant bearish trends over the past 12 months, with notable price declines and decelerating momentum.
Trend Analysis
Paycom Software, Inc. experienced a bearish trend over the past 12 months, with its stock price declining by 19.64%. The trend shows deceleration, with a high volatility level indicated by a 31.92 standard deviation and a price range between 141.96 and 265.71.
Perfect Corp. also exhibited a bearish trend, with a steeper price decline of 28.98% over the same period. This trend is decelerating as well, but with low volatility reflected by a 0.27 standard deviation and a price range from 1.61 to 2.7.
Comparing the two, Paycom Software, Inc. delivered a higher market performance, declining less than Perfect Corp. during the last 12 months despite both showing bearish trends.
Target Prices
Analysts provide a clear target price consensus for Paycom Software, Inc. and Perfect Corp.
| Company | Target High | Target Low | Consensus |
|---|---|---|---|
| Paycom Software, Inc. | 290 | 165 | 215 |
| Perfect Corp. | 7 | 7 | 7 |
The consensus target for Paycom Software at $215 suggests upside potential from the current $148.41 price, while Perfect Corp.’s consensus target of $7 far exceeds its current $1.74 share price, indicating strong analyst optimism.
Analyst Opinions Comparison
This section compares analysts’ ratings and grades for Paycom Software, Inc. and Perfect Corp.:
Rating Comparison
PAYC Rating
- Rating: A, considered Very Favorable overall by analysts.
- Discounted Cash Flow Score: 5, indicating very favorable valuation prospects.
- ROE Score: 5, showing very efficient profit generation from equity.
- ROA Score: 5, denoting very effective asset utilization to generate earnings.
- Debt To Equity Score: 4, suggesting favorable financial risk management.
- Overall Score: 4, a favorable summary of financial standing.
PERF Rating
- Rating: A-, also rated Very Favorable by analysts.
- Discounted Cash Flow Score: 5, also very favorable for valuation.
- ROE Score: 2, reflecting moderate efficiency in generating profit from equity.
- ROA Score: 3, showing moderate effectiveness in asset utilization.
- Debt To Equity Score: 4, similarly favorable in managing financial risk.
- Overall Score: 4, equally favorable financial summary.
Which one is the best rated?
Paycom Software, Inc. holds a stronger position in key profitability metrics with perfect scores in ROE and ROA, while Perfect Corp. has moderate scores in these areas. Both have equally favorable overall and debt-to-equity scores.
Scores Comparison
Here is a comparison of the Altman Z-Score and Piotroski Score for Paycom Software, Inc. and Perfect Corp.:
Paycom Scores
- Altman Z-Score: 3.84, indicating a safe zone with low bankruptcy risk.
- Piotroski Score: 5, considered average financial strength.
Perfect Scores
- Altman Z-Score: 1.31, indicating distress zone with high bankruptcy risk.
- Piotroski Score: 6, considered average financial strength.
Which company has the best scores?
Paycom Software, Inc. shows a stronger Altman Z-Score, placing it in a safer financial zone compared to Perfect Corp., which is in distress. Both companies have average Piotroski Scores, with Perfect slightly higher at 6 versus Paycom’s 5.
Grades Comparison
The grades assigned by reputable financial institutions for Paycom Software, Inc. and Perfect Corp. are as follows:
Paycom Software, Inc. Grades
Below is a summary of recent grades from established grading companies for Paycom Software, Inc.:
| Grading Company | Action | New Grade | Date |
|---|---|---|---|
| Barclays | Maintain | Equal Weight | 2026-01-12 |
| TD Cowen | Maintain | Buy | 2026-01-08 |
| Citigroup | Maintain | Neutral | 2025-12-23 |
| Keybanc | Maintain | Overweight | 2025-11-06 |
| TD Cowen | Maintain | Buy | 2025-11-06 |
| UBS | Maintain | Buy | 2025-11-06 |
| Jefferies | Maintain | Hold | 2025-11-06 |
| JP Morgan | Maintain | Neutral | 2025-11-06 |
| Mizuho | Maintain | Neutral | 2025-11-06 |
| Barclays | Maintain | Equal Weight | 2025-11-06 |
The overall trend in Paycom Software’s grades reflects a stable outlook with a balance of Buy, Hold, and Neutral ratings from key analysts.
Perfect Corp. Grades
Below is a summary of recent grades from established grading companies for Perfect Corp.:
| Grading Company | Action | New Grade | Date |
|---|---|---|---|
| Piper Sandler | Maintain | Neutral | 2024-02-29 |
| Goldman Sachs | Maintain | Neutral | 2023-10-26 |
| Piper Sandler | Maintain | Neutral | 2023-10-25 |
| Piper Sandler | Maintain | Neutral | 2023-07-26 |
| Piper Sandler | Maintain | Neutral | 2023-07-25 |
| Piper Sandler | Maintain | Neutral | 2023-04-27 |
| Oppenheimer | Downgrade | Perform | 2023-04-20 |
| Oppenheimer | Downgrade | Perform | 2023-04-19 |
| Oppenheimer | Downgrade | Perform | 2023-04-18 |
| Piper Sandler | Maintain | Neutral | 2023-03-08 |
Grades for Perfect Corp. predominantly reflect a Neutral consensus, with a recent downgrade from Outperform to Perform by Oppenheimer.
Which company has the best grades?
Paycom Software, Inc. has received more Buy and Overweight grades compared to Perfect Corp.’s consistent Neutral ratings. This suggests that Paycom’s outlook is viewed more positively by analysts, potentially indicating greater confidence in its near-term performance, which investors might consider when assessing risk and opportunity.
Strengths and Weaknesses
Below is a comparison of key strengths and weaknesses for Paycom Software, Inc. (PAYC) and Perfect Corp. (PERF) based on their recent financial and strategic performance.
| Criterion | Paycom Software, Inc. (PAYC) | Perfect Corp. (PERF) |
|---|---|---|
| Diversification | Moderate; strong focus on recurring HR software revenue (1.73B USD in 2024) | Limited data; product segmentation unclear |
| Profitability | High profitability with 26.66% net margin and 31.85% ROE | Low profitability; 8.34% net margin, 3.42% ROE |
| Innovation | Demonstrates durable competitive advantage via growing ROIC (+54%) | Improving profitability but still destroying value (ROIC -2.1%) |
| Global presence | Established with efficient use of capital (ROIC 24.86%, WACC 7.66%) | Smaller scale, less efficient capital use (negative ROIC) |
| Market Share | Strong position in HR tech with recurring revenues dominating | Niche player with uncertain market share |
Key takeaways: Paycom exhibits robust financial health, a clear competitive moat, and consistent value creation, making it a safer investment choice. Perfect Corp. shows improving trends but remains a riskier option due to ongoing value destruction and weaker profitability.
Risk Analysis
Below is a comparative overview of key risks affecting Paycom Software, Inc. (PAYC) and Perfect Corp. (PERF) based on the most recent data from 2024-2026.
| Metric | Paycom Software, Inc. (PAYC) | Perfect Corp. (PERF) |
|---|---|---|
| Market Risk | Moderate (Beta 0.82, stable US market exposure) | Low (Beta 0.45, niche AR/AI sector) |
| Debt level | Very Low (Debt-to-Equity 0.05, strong interest coverage) | Negligible (Debt-to-Equity 0.0, but negative interest coverage) |
| Regulatory Risk | Moderate (US labor and data regulations) | Moderate (Global tech and data privacy laws in Taiwan and US) |
| Operational Risk | Low (Established SaaS platform with 7,300+ employees) | Moderate (Smaller size, 340+ employees, emerging tech) |
| Environmental Risk | Low (Software sector, minimal direct impact) | Low (Software sector, minimal direct impact) |
| Geopolitical Risk | Moderate (US-based, sensitive to domestic policy changes) | Higher (Taiwan-based, exposed to cross-strait tensions) |
The most impactful risks are Perfect Corp.’s geopolitical exposure due to its Taiwan headquarters and financial distress indicated by its Altman Z-score in the distress zone. Paycom exhibits strong financial health with low debt and stable market risk but faces moderate regulatory scrutiny in the US. Investors should weigh geopolitical and financial stability risks carefully when considering these stocks.
Which Stock to Choose?
Paycom Software, Inc. (PAYC) shows strong income growth with a 123.81% revenue increase over five years and a favorable 26.66% net margin in 2024. It maintains excellent profitability ratios, low debt levels, and a very favorable overall rating of A, supported by a very favorable moat indicating durable competitive advantage.
Perfect Corp. (PERF) also reports favorable revenue growth of 101.53% over five years but with a lower 8.34% net margin and negative returns on invested capital. Its debt is minimal, and the overall rating is very favorable A-, although its moat is slightly unfavorable, suggesting the company is currently shedding value despite improving profitability.
Investors focused on quality and value creation might find PAYC’s strong profitability and very favorable moat more appealing, while those tolerant of risk and seeking growth opportunities could view PERF’s improving trends and favorable rating as signaling potential, despite its current challenges.
Disclaimer: Investment carries a risk of loss of initial capital. The past performance is not a reliable indicator of future results. Be sure to understand risks before making an investment decision.
Go Further
I encourage you to read the complete analyses of Paycom Software, Inc. and Perfect Corp. to enhance your investment decisions: