Home > Comparison > Technology > PEGA vs PAYC
The strategic rivalry between Pegasystems Inc. and Paycom Software, Inc. shapes the evolution of enterprise software solutions. Pegasystems operates as a platform-focused innovator in customer engagement and process automation, while Paycom delivers a specialized, cloud-based human capital management service. This analysis pits platform versatility against niche mastery to identify which trajectory offers superior risk-adjusted returns for diversified portfolios navigating the competitive Technology sector.
Table of contents
Companies Overview
Pegasystems Inc. and Paycom Software, Inc. stand as influential players in the evolving software landscape, each commanding significant market attention.
Pegasystems Inc.: Enterprise Software Innovator
Pegasystems Inc. leads in enterprise software applications, generating revenue primarily through licensing, hosting, and supporting its Pega Platform and Pega Infinity. Its 2026 strategy focuses on unifying customer engagement and digital process automation, targeting sectors like financial services and healthcare with advanced intelligent automation and cloud solutions.
Paycom Software, Inc.: Cloud-Based HCM Specialist
Paycom Software, Inc. dominates the cloud-based human capital management (HCM) space, monetizing via SaaS subscriptions that cover the entire employment lifecycle. In 2026, Paycom sharpened its focus on enhancing payroll, talent acquisition, and compliance tools for small to mid-sized U.S. companies, leveraging proprietary technology like Microfence and advanced analytics to deepen client integration.
Strategic Collision: Similarities & Divergences
Both companies operate in application software but diverge sharply: Pegasystems builds a broad enterprise automation ecosystem, while Paycom delivers specialized, end-to-end HCM cloud services. They compete primarily in digital transformation but target distinct enterprise functions. This contrast defines their investment profiles—Pegasystems offers platform versatility; Paycom delivers focused operational efficiency.
Income Statement Comparison
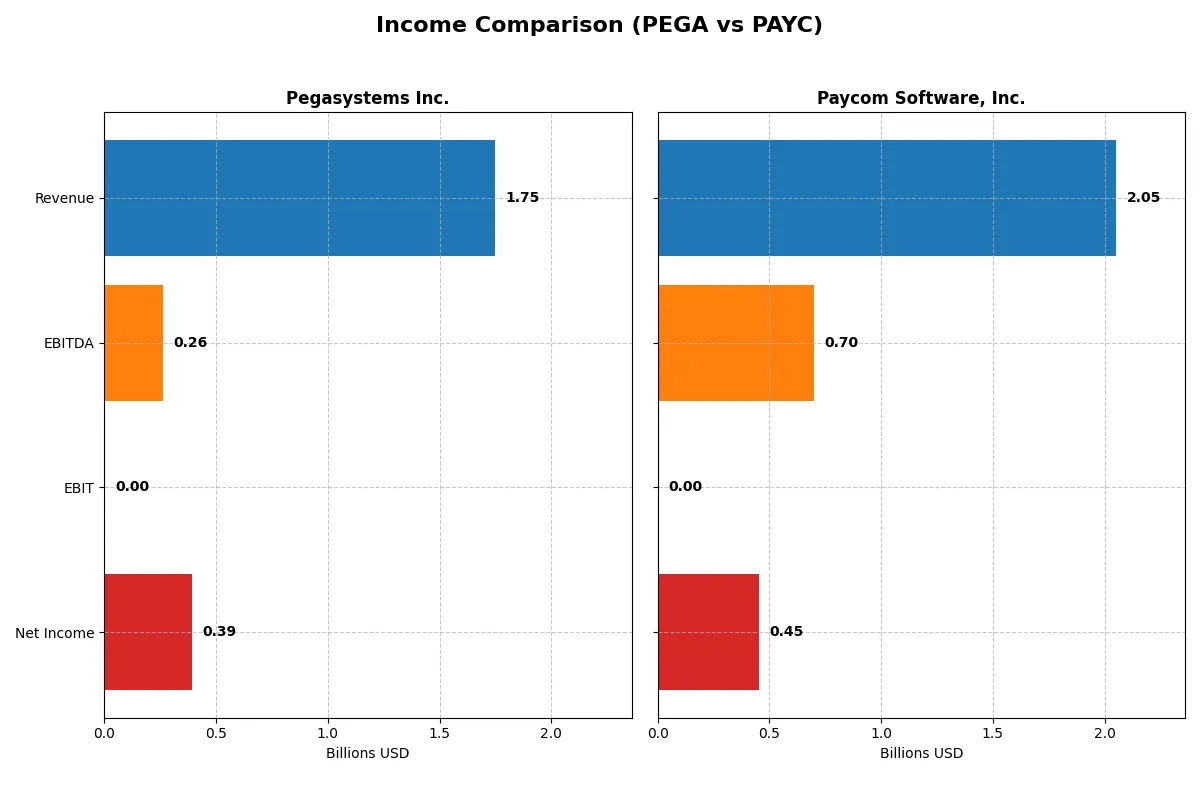
This data dissects the core profitability and scalability of both corporate engines to reveal who dominates the bottom line:
| Metric | Pegasystems Inc. (PEGA) | Paycom Software, Inc. (PAYC) |
|---|---|---|
| Revenue | 1.75B | 2.05B |
| Cost of Revenue | 421M | 345M |
| Operating Expenses | 1.04B | 1.05B |
| Gross Profit | 1.32B | 1.71B |
| EBITDA | 263M | 698M |
| EBIT | 0 | 0 |
| Interest Expense | -1.3M | -3.4M |
| Net Income | 393M | 453M |
| EPS | 2.3 | 8.13 |
| Fiscal Year | 2025 | 2025 |
Income Statement Analysis: The Bottom-Line Duel
This income statement comparison reveals which company runs a more efficient and profitable business engine in 2025.
Pegasystems Inc. Analysis
Pegasystems grew revenue 17% in 2025 to $1.75B and surged net income by over 295% to $393M. Its gross margin sustained a strong 75.9%, driving healthy profitability. Despite a flat EBIT margin, net margin expanded to 22.5%, reflecting operational leverage and disciplined cost control that boosted bottom-line momentum.
Paycom Software, Inc. Analysis
Paycom’s revenue rose 9% to $2.05B in 2025, with net income dipping 10% to $453M. It maintains a superior gross margin of 83.2%, yet net margin slightly contracted to 22.1%. While revenue scale leads, slower net margin growth and a 100% EBIT decline indicate pressure on operating efficiency and margin sustainability.
Margin Strength vs. Revenue Growth
Pegasystems posts sharper net income growth and margin expansion despite smaller revenue scale. Paycom outpaces in top-line size and gross margin but shows signs of margin compression and slower profit growth. For investors, Pegasystems presents a more compelling profile of improving profitability and operational efficiency.
Financial Ratios Comparison
These vital ratios act as a diagnostic tool to expose the underlying fiscal health, valuation premiums, and capital efficiency of the companies compared below:
| Ratios | Pegasystems Inc. (PEGA) | Paycom Software, Inc. (PAYC) |
|---|---|---|
| ROE | 49.97% | N/A |
| ROIC | 29.43% | N/A |
| P/E | 25.92 | 19.61 |
| P/B | 12.95 | N/A |
| Current Ratio | 1.33 | 0 |
| Quick Ratio | 1.33 | 0 |
| D/E | 0.08 | 0 |
| Debt-to-Assets | 3.73% | 0 |
| Interest Coverage | -204.75 | -166.82 |
| Asset Turnover | 1.07 | 0 |
| Fixed Asset Turnover | 0 | 0 |
| Payout ratio | 3.92% | 18.70% |
| Dividend yield | 0.15% | 0.95% |
| Fiscal Year | 2025 | 2025 |
Efficiency & Valuation Duel: The Vital Signs
Financial ratios serve as a company’s DNA, uncovering hidden operational strengths and potential risks for investors.
Pegasystems Inc.
Pegasystems exhibits strong profitability with a 50% ROE and 22.5% net margin, reflecting impressive operational efficiency. Its valuation is stretched, trading at a P/E of nearly 26 and a high P/B of 13. Shareholder returns remain modest, with a low 0.15% dividend yield, while significant R&D investment fuels growth and innovation.
Paycom Software, Inc.
Paycom shows a favorable net margin of 22.1% but reports zero ROE and ROIC, signaling potential accounting or reporting gaps. The stock trades at a more reasonable P/E of 19.6, with a zero P/B ratio flagged as favorable. Despite a higher dividend yield near 1%, its liquidity and asset turnover ratios raise caution for operational efficiency.
Premium Valuation vs. Operational Safety
Pegasystems combines strong profitability with higher valuation multiples, balancing growth with operational robustness. Paycom’s metrics reveal valuation appeal but weak returns and liquidity. Investors seeking growth may lean toward Pegasystems’ reinvestment strategy, while cautious profiles might weigh Paycom’s lower valuation against operational risks.
Which one offers the Superior Shareholder Reward?
I see Pegasystems Inc. (PEGA) pays a minimal dividend yield of 0.15% in 2025 with a low payout ratio around 4%. Its buybacks are modest, focusing on preserving cash amid moderate leverage (debt/equity ~0.08). Paycom Software, Inc. (PAYC) yields 0.95% with a higher payout ratio near 19%. PAYC maintains aggressive buybacks supported by robust free cash flow (7.3/share) and a strong operating margin of 27.6%. Historically, PAYC’s higher yield and buyback intensity suggest a more shareholder-friendly distribution mix. I favor PAYC’s blend of dividends and buybacks as more sustainable, backed by superior cash flow conversion and profitability. For 2026, PAYC offers a more attractive total return profile, balancing income and growth capital return.
Comparative Score Analysis: The Strategic Profile
The radar chart reveals the fundamental DNA and trade-offs of Pegasystems Inc. and Paycom Software, Inc., highlighting their financial strengths and valuation nuances:
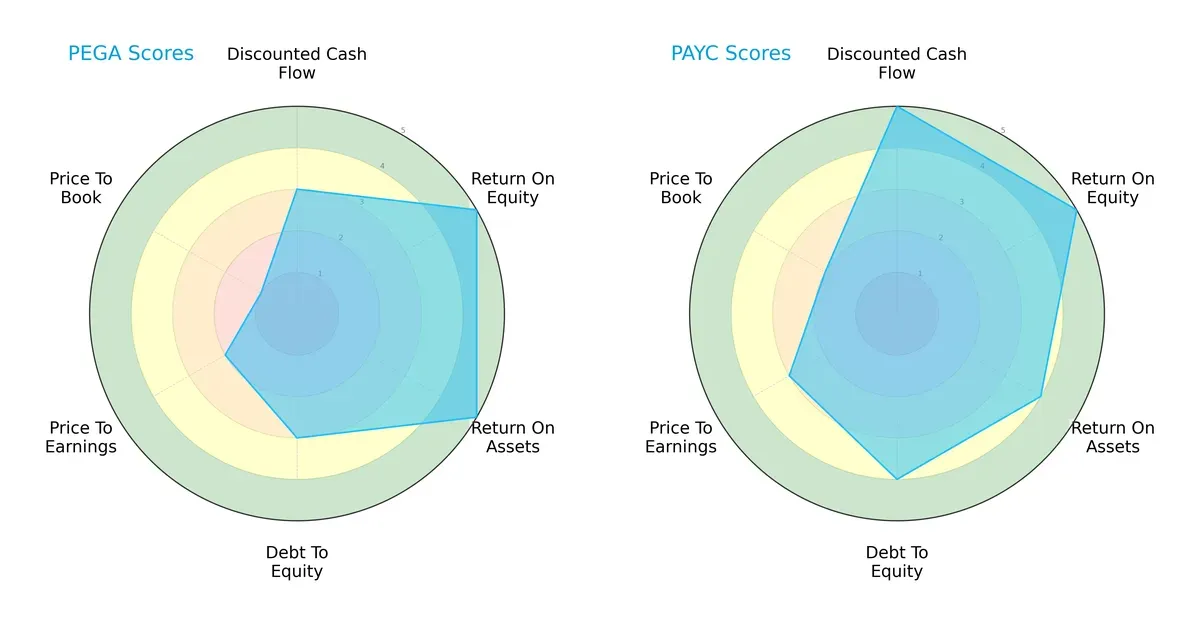
Paycom leads with a more balanced and favorable profile, scoring very high on discounted cash flow (5) and debt-to-equity (4), indicating strong cash generation and prudent leverage. Pegasystems excels in return on equity and assets (both 5), showing operational efficiency but lags in valuation metrics (PE 2, PB 1), signaling potential overvaluation or market skepticism. Paycom’s higher overall score (4 vs. 3) suggests a steadier investment candidate with diversified advantages.
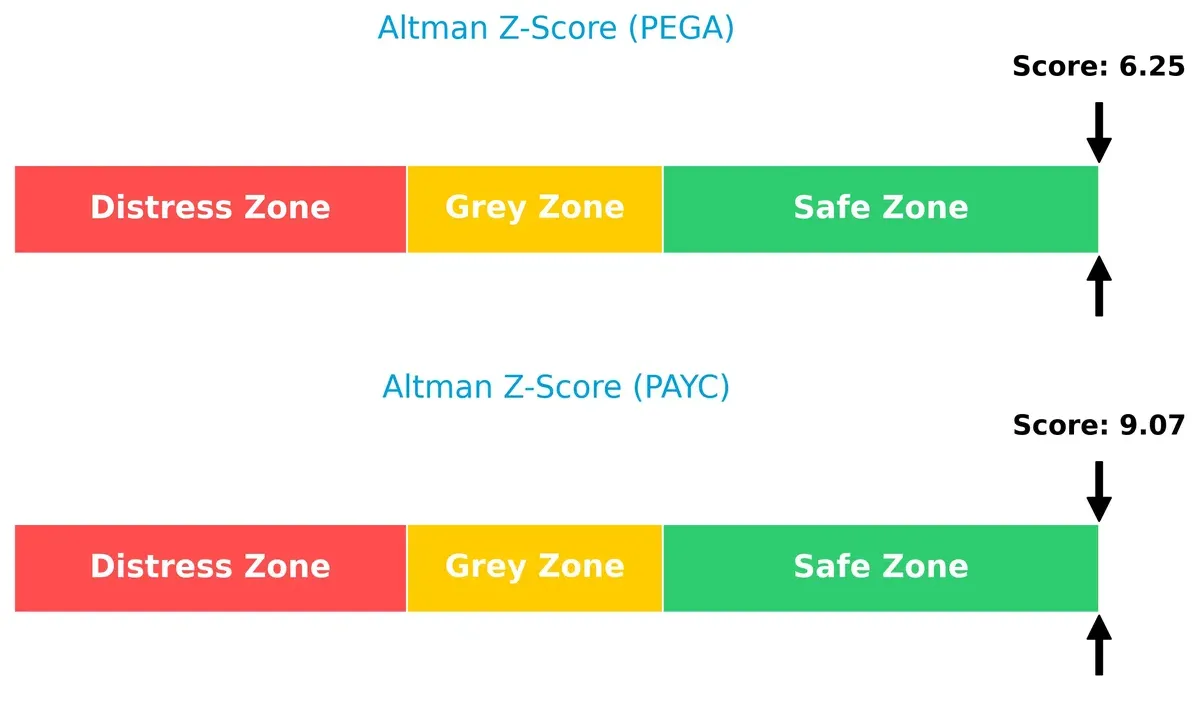
Bankruptcy Risk: Solvency Showdown
Paycom’s Altman Z-Score (9.07) significantly surpasses Pegasystems’ (6.25), both firmly in the safe zone. This gap highlights Paycom’s superior resilience and lower bankruptcy risk in an uncertain economic environment:
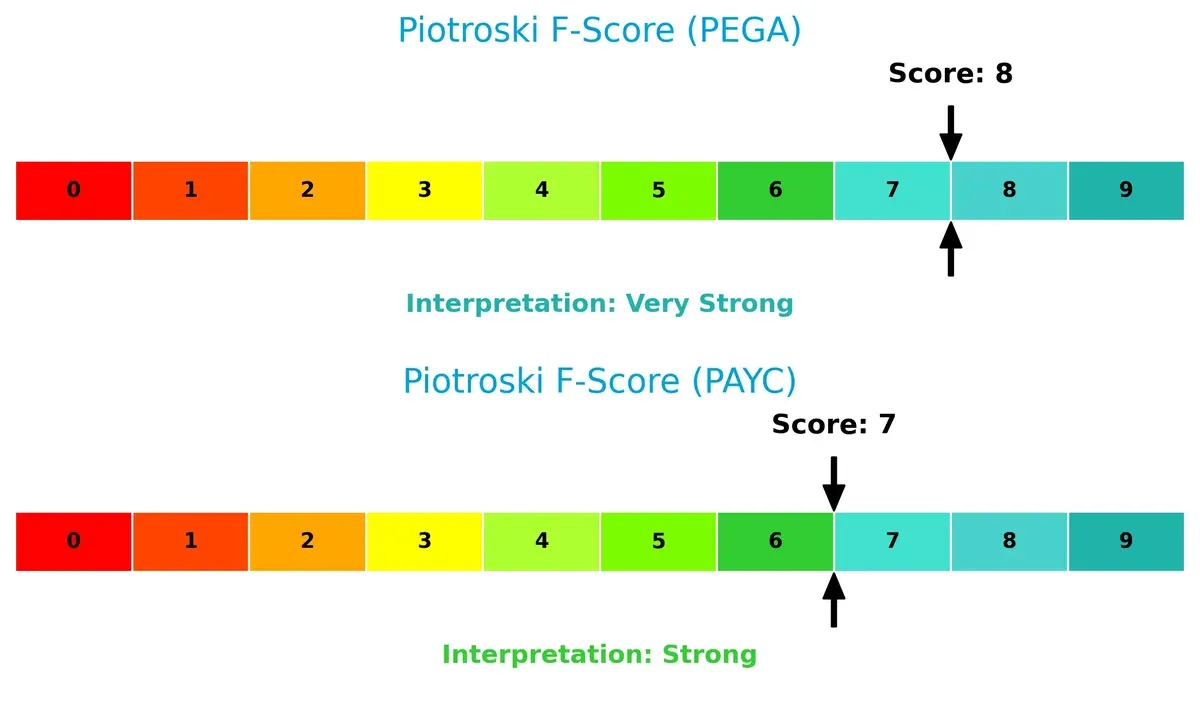
Financial Health: Quality of Operations
Pegasystems scores an 8 on the Piotroski F-Score, indicating very strong financial health. Paycom follows closely with a 7, signaling strong but slightly less robust operational metrics. Neither shows red flags, but Pegasystems edges ahead in internal financial quality:
How are the two companies positioned?
This section dissects the operational DNA of PEGA and PAYC by comparing revenue distribution and internal strengths and weaknesses. The goal is to confront their economic moats and identify the more resilient, sustainable competitive advantage today.
Revenue Segmentation: The Strategic Mix
This visual comparison dissects how Pegasystems Inc. and Paycom Software, Inc. diversify their income streams and where their primary sector bets lie:
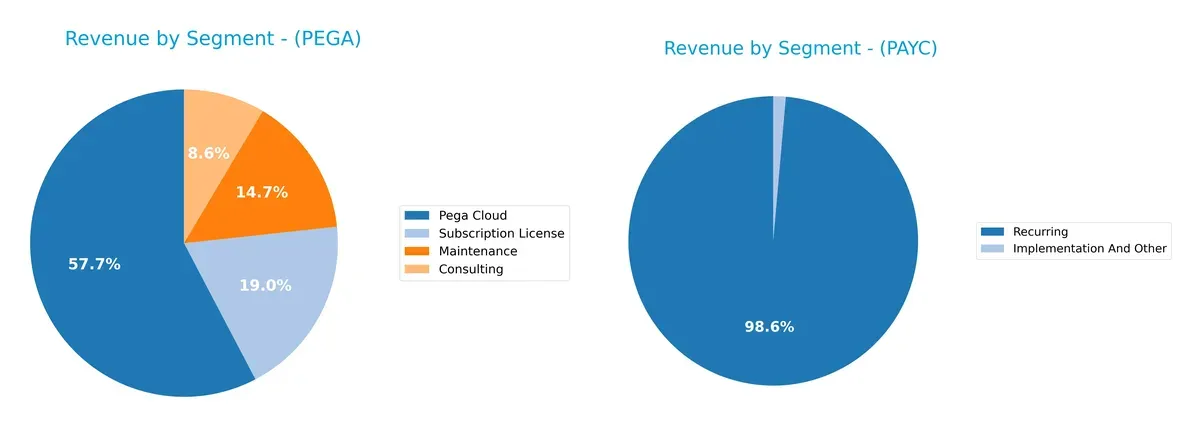
Pegasystems anchors growth in Pega Cloud with $1.54B, complemented by $507M in Subscription License and $393M Maintenance, showing a diversified SaaS and service mix. Paycom pivots almost entirely on Recurring revenue at $1.73B, with minimal Implementation income ($24M), indicating high concentration risk. Pegasystems’ strategy fosters ecosystem lock-in, while Paycom’s dominance in one segment heightens vulnerability to market shifts.
Strengths and Weaknesses Comparison
This table compares the strengths and weaknesses of Pegasystems Inc. and Paycom Software, Inc.:
Pegasystems Inc. Strengths
- Strong profitability with 22.54% net margin and 49.97% ROE
- High ROIC of 29.43% above WACC (8.63%)
- Low debt-to-equity (0.08) and debt-to-assets (3.73%) ratios
- Diverse revenue streams including consulting, cloud, maintenance, and subscription licenses
- Broad global presence with significant US, EMEA, and Asia Pacific revenue
Paycom Software, Inc. Strengths
- Solid net margin at 22.1%
- Favorable price-to-book ratio indicating undervaluation potential
- Debt-free capital structure with 0 debt-to-assets and debt-to-equity ratios
- Large recurring revenue base driving steady cash flows
Pegasystems Inc. Weaknesses
- High valuation multiples with P/E of 25.92 and P/B of 12.95
- Interest coverage nearly zero, signaling potential risk in meeting interest obligations
- Dividend yield low at 0.15%
- Fixed asset turnover at zero signals asset utilization concerns
- Some ratio neutrality and unfavorable metrics reduce overall financial robustness
Paycom Software, Inc. Weaknesses
- Zero ROE and ROIC indicate poor capital profitability
- Poor liquidity ratios with current and quick ratios at zero
- Negative interest coverage ratio
- Asset turnover and fixed asset turnover at zero suggest inefficient operations
- Dividend yield unfavorable at 0.95%
Pegasystems shows strength in profitability and diversified global revenue but faces valuation and asset utilization challenges. Paycom’s strengths lie in recurring revenues and debt-free structure but its poor capital returns and liquidity ratios pose risks for operational efficiency and financial flexibility.
The Moat Duel: Analyzing Competitive Defensibility
A structural moat is the only true shield guarding long-term profits from relentless competition erosion. Let’s dissect the moats of two software firms:
Pegasystems Inc.: Platform Integration & Customer Engagement Moat
Pegasystems leverages its intangible assets and platform integration to sustain high ROIC over WACC by delivering margin stability and steady revenue growth. Expansion into AI-driven automation deepens this moat in 2026.
Paycom Software, Inc.: Human Capital Management Specialization
Paycom’s moat rests on its specialized HCM SaaS and data analytics, creating switching costs distinct from Pegasystems. Yet, its declining ROIC trend signals pressure on competitive positioning despite solid revenue gains.
Platform Integration vs. Specialized SaaS: A Moat Strength Showdown
Pegasystems exhibits a wider and growing moat with strong value creation and profitability sustainability. Paycom’s narrowing moat and ROIC decline suggest less resilience in defending market share long term.
Which stock offers better returns?
The past year reveals sharply divergent stock trajectories: Pegasystems Inc. surged over 34%, though slowing recently, while Paycom Software, Inc. faced a steep 35% decline with accelerating losses.
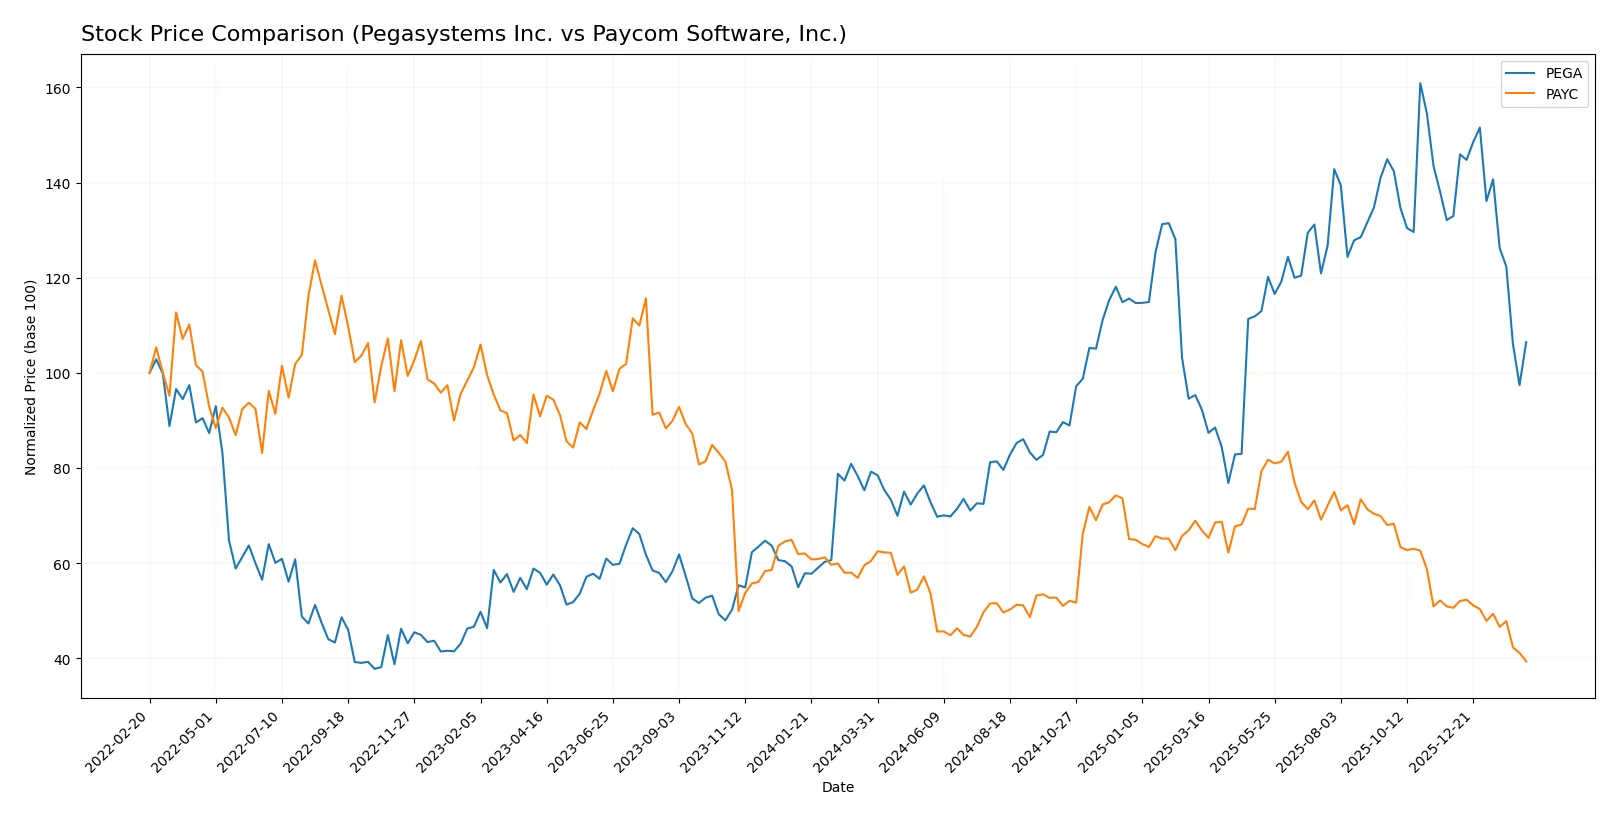
Trend Comparison
Pegasystems Inc. shows a bullish 34.39% gain over 12 months with decelerating momentum. The stock peaked near 66.27, bottomed at 28.73, and volatility remains moderate (10.53 std dev). Recent months saw a 19.94% pullback.
Paycom Software, Inc. experienced a bearish 34.89% drop over the same period, marked by decelerating downside acceleration. High volatility (34.03 std dev) accompanied a peak of 265.71 and trough near 125.31. Recent losses deepened by 22.25%.
Pegasystems outperformed Paycom with a strong positive return versus a sharp decline. Pegasystems remains the higher performer over the past year based on price trends.
Target Prices
Analysts show a cautiously optimistic outlook based on target price consensus for both Pegasystems Inc. and Paycom Software, Inc.
| Company | Target Low | Target High | Consensus |
|---|---|---|---|
| Pegasystems Inc. | 48 | 65 | 58.25 |
| Paycom Software, Inc. | 115 | 210 | 151.82 |
The consensus targets imply upside potential of roughly 33% for Pegasystems and 21% for Paycom versus current prices. Analysts expect solid growth despite market volatility.

Don’t Let Luck Decide Your Entry Point
Optimize your entry points with our advanced ProRealTime indicators. You’ll get efficient buy signals with precise price targets for maximum performance. Start outperforming now!
How do institutions grade them?
Pegasystems Inc. Grades
The table below shows recent grades assigned to Pegasystems Inc. by various institutions:
| Grading Company | Action | New Grade | Date |
|---|---|---|---|
| Rosenblatt | Maintain | Buy | 2026-02-12 |
| RBC Capital | Maintain | Outperform | 2026-02-12 |
| Citizens | Maintain | Market Outperform | 2026-02-12 |
| Barclays | Upgrade | Overweight | 2026-02-12 |
| Wedbush | Maintain | Outperform | 2026-02-12 |
| Citigroup | Maintain | Buy | 2026-02-12 |
| Rosenblatt | Maintain | Buy | 2026-02-06 |
| JP Morgan | Maintain | Overweight | 2025-12-05 |
| RBC Capital | Maintain | Outperform | 2025-10-23 |
| Wedbush | Maintain | Outperform | 2025-10-23 |
Paycom Software, Inc. Grades
This table presents recent institutional grades for Paycom Software, Inc.:
| Grading Company | Action | New Grade | Date |
|---|---|---|---|
| Citigroup | Maintain | Neutral | 2026-02-13 |
| BMO Capital | Maintain | Market Perform | 2026-02-12 |
| Guggenheim | Maintain | Buy | 2026-02-12 |
| Keybanc | Maintain | Overweight | 2026-02-12 |
| Mizuho | Maintain | Neutral | 2026-02-12 |
| BTIG | Maintain | Buy | 2026-02-12 |
| Barclays | Maintain | Equal Weight | 2026-02-12 |
| Jefferies | Maintain | Hold | 2026-02-12 |
| Cantor Fitzgerald | Maintain | Neutral | 2026-02-12 |
| Cantor Fitzgerald | Maintain | Neutral | 2026-01-29 |
Which company has the best grades?
Pegasystems Inc. holds consistently higher grades, including multiple “Outperform” and “Overweight” ratings, plus an upgrade from Barclays. Paycom’s ratings trend toward “Neutral” and “Market Perform.” This suggests stronger institutional confidence in Pegasystems, potentially influencing investor sentiment positively.
Risks specific to each company
The following categories identify the critical pressure points and systemic threats facing both firms in the 2026 market environment:
1. Market & Competition
Pegasystems Inc.
- Faces pressure from diversified enterprise software providers; moderate market share growth potential amid strong incumbents.
Paycom Software, Inc.
- Operates in a competitive HCM SaaS space with rapid innovation; struggles to scale beyond US mid-market clients.
2. Capital Structure & Debt
Pegasystems Inc.
- Maintains very low debt-to-equity ratio (0.08), signaling financial prudence and low leverage risk.
Paycom Software, Inc.
- Zero debt reported, reflecting a conservative capital structure but possibly limiting financial flexibility for growth.
3. Stock Volatility
Pegasystems Inc.
- Beta near 1.07 suggests volatility slightly above market average, exposing investors to moderate price swings.
Paycom Software, Inc.
- Lower beta at 0.79 indicates less sensitivity to market fluctuations, offering relative price stability.
4. Regulatory & Legal
Pegasystems Inc.
- Global operations expose the firm to varied data privacy and software compliance regulations across regions.
Paycom Software, Inc.
- Primarily US-focused, Paycom faces concentrated regulatory risk from domestic labor and data protection laws.
5. Supply Chain & Operations
Pegasystems Inc.
- Relies on cloud infrastructure partners; operational risks relate to service continuity and cybersecurity threats.
Paycom Software, Inc.
- Entirely cloud-based SaaS model reduces physical supply chain risks but depends heavily on data center uptime and security.
6. ESG & Climate Transition
Pegasystems Inc.
- Moderate ESG risks; technology sector scrutiny on data ethics and energy consumption of cloud services.
Paycom Software, Inc.
- Faces growing investor pressure to enhance ESG disclosures and governance practices amid rising stakeholder demands.
7. Geopolitical Exposure
Pegasystems Inc.
- Diverse international footprint heightens exposure to geopolitical tensions, trade restrictions, and currency fluctuations.
Paycom Software, Inc.
- Limited international presence minimizes geopolitical risks but constrains global growth opportunities.
Which company shows a better risk-adjusted profile?
Pegasystems’ most impactful risk stems from its broad geopolitical exposure and regulatory complexity across multiple regions. Paycom’s key risk lies in its concentrated domestic market and regulatory environment, which could limit expansion and increase vulnerability to US policy shifts. Despite higher volatility, Pegasystems offers a more balanced risk profile due to diversified operations and strong capital structure. Paycom’s zero-debt stance and low beta reduce financial and market risks but its unfavorable financial ratios and weaker profitability metrics raise concerns about sustainable growth. The recent data reveal Pegasystems’ superior Altman Z-score and Piotroski score, underscoring stronger financial health and risk resilience.
Final Verdict: Which stock to choose?
Pegasystems Inc. shines with a powerful value creation engine, boasting a very favorable moat and rapidly growing returns on invested capital. Its superpower lies in efficient capital allocation and strong profitability. A point of vigilance remains its stretched valuation metrics. It suits portfolios aiming for aggressive growth with appetite for some valuation risk.
Paycom Software, Inc. commands a strategic moat rooted in high recurring revenue and operational efficiency. Despite less clarity on capital returns, it offers better financial stability and a safer balance sheet than Pegasystems. Its profile fits well with GARP investors seeking stable growth at a reasonable price, balanced by prudent risk management.
If you prioritize aggressive growth and can tolerate valuation premiums, Pegasystems outshines due to its expanding economic moat and superior value creation. However, if you seek steadier returns with a stronger safety cushion, Paycom offers better stability and a more conservative risk profile. Both present distinct analytical scenarios aligned with different investor strategies.
Disclaimer: Investment carries a risk of loss of initial capital. The past performance is not a reliable indicator of future results. Be sure to understand risks before making an investment decision.
Go Further
I encourage you to read the complete analyses of Pegasystems Inc. and Paycom Software, Inc. to enhance your investment decisions: