Paycom Software, Inc. and monday.com Ltd. stand out as key players in the software application industry, each driving innovation through cloud-based solutions that streamline business operations. Paycom focuses on human capital management for U.S. companies, while monday.com offers a versatile work operating system with global reach. Their overlapping markets and distinct strategies make this comparison essential to identify which company offers the most compelling investment opportunity. Let’s explore which one deserves a spot in your portfolio.

Table of contents
Companies Overview
I will begin the comparison between Paycom Software, Inc. and monday.com Ltd. by providing an overview of these two companies and their main differences.
Paycom Software, Inc. Overview
Paycom Software, Inc. delivers cloud-based human capital management (HCM) solutions as software-as-a-service, targeting small to mid-sized U.S. companies. Its comprehensive platform covers the employment lifecycle from recruitment to retirement, including payroll, talent management, and compliance tools. Founded in 1998 and based in Oklahoma City, Paycom holds a strong position in the U.S. market with a $8.3B market cap and over 7,300 employees.
monday.com Ltd. Overview
monday.com Ltd. provides a cloud-based visual work operating system known as Work OS, enabling users to build customized software applications and work management tools. Its solutions span marketing, CRM, project management, and software development sectors globally. Incorporated in 2012 and headquartered in Tel Aviv, Israel, monday.com has a $6.5B market cap and employs about 2,500 staff worldwide.
Key similarities and differences
Both companies operate in the software application industry with cloud-based platforms emphasizing flexibility and user empowerment. Paycom focuses on specialized HCM solutions primarily for U.S. small and mid-sized firms, while monday.com offers broader work management tools internationally across various industries. Paycom’s larger workforce and longer market presence contrast with monday.com’s newer, globally diversified business model and higher beta, reflecting differing risk profiles.
Income Statement Comparison
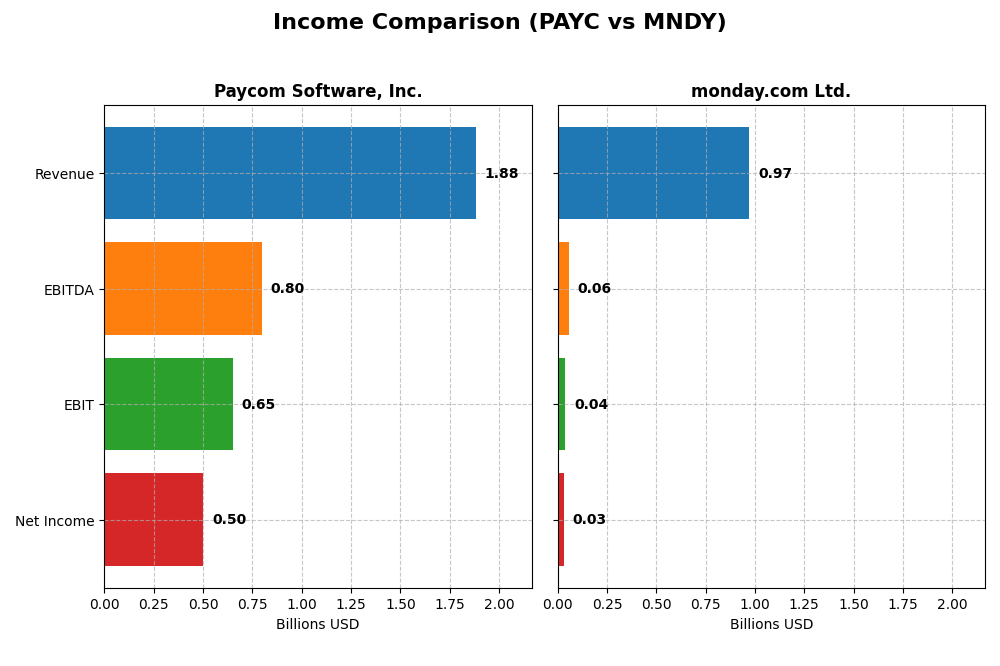
The table below presents a side-by-side comparison of the latest fiscal year income statements for Paycom Software, Inc. and monday.com Ltd., highlighting key financial metrics.
| Metric | Paycom Software, Inc. (PAYC) | monday.com Ltd. (MNDY) |
|---|---|---|
| Market Cap | 8.35B | 6.53B |
| Revenue | 1.88B | 972M |
| EBITDA | 798M | 58M |
| EBIT | 652M | 40M |
| Net Income | 502M | 32M |
| EPS | 8.93 | 0.65 |
| Fiscal Year | 2024 | 2024 |
Income Statement Interpretations
Paycom Software, Inc.
Paycom’s revenue and net income have shown consistent growth from 2020 to 2024, with revenue increasing from $841M to $1.88B and net income rising from $143M to $502M. Margins remain strong and stable, with a gross margin of 82.23% and net margin improving to 26.66% in 2024. The latest fiscal year saw revenue grow by 11.19% and net income by 32.48%, reflecting enhanced profitability and operational efficiency.
monday.com Ltd.
Monday.com’s revenue surged significantly from $161M in 2020 to $972M in 2024, with net income turning positive recently, reaching $32M after years of losses. The company maintains an impressive gross margin of 89.33%, though EBIT and net margins are modest at 4.09% and 3.33%, respectively. The 2024 fiscal year exhibited strong growth, with revenue up 33.21% and net margin improving substantially, signaling progress toward profitability.
Which one has the stronger fundamentals?
Paycom demonstrates stronger fundamentals with consistent high margins and robust profitability growth over five years, supported by favorable income statement metrics across the board. Monday.com shows remarkable top-line expansion and a move to profitability but maintains lower EBIT and net margins with more variability. Thus, Paycom’s financials reflect more stable and mature earnings quality.
Financial Ratios Comparison
Below is a comparison of key financial ratios for Paycom Software, Inc. (PAYC) and monday.com Ltd. (MNDY) based on their most recent fiscal year data (2024).
| Ratios | Paycom Software, Inc. (PAYC) | monday.com Ltd. (MNDY) |
|---|---|---|
| ROE | 31.9% | 3.14% |
| ROIC | 24.9% | -1.73% |
| P/E | 22.95 | 363.0 |
| P/B | 7.31 | 11.41 |
| Current Ratio | 1.10 | 2.66 |
| Quick Ratio | 1.10 | 2.66 |
| D/E (Debt-to-Equity) | 0.053 | 0.103 |
| Debt-to-Assets | 1.42% | 6.29% |
| Interest Coverage | 186.6 | 0 |
| Asset Turnover | 0.32 | 0.58 |
| Fixed Asset Turnover | 2.93 | 7.13 |
| Payout ratio | 16.9% | 0 |
| Dividend yield | 0.74% | 0 |
Interpretation of the Ratios
Paycom Software, Inc.
Paycom shows a generally favorable ratio profile with strong net margin (26.66%) and high return on equity (31.85%) and invested capital (24.86%), indicating efficient profitability and capital use. However, a high price-to-book ratio (7.31) and low dividend yield (0.74%) are less attractive. The company pays dividends with a modest yield and maintains coverage by free cash flow, limiting risks of unsustainable payouts.
monday.com Ltd.
monday.com exhibits weak profitability ratios, including net margin (3.33%) and return on equity (3.14%), reflecting challenges in generating profits. Its valuation measures such as price-to-earnings (363) and price-to-book (11.41) ratios are unfavorable, suggesting high market expectations. The company does not pay dividends, likely due to reinvestment in growth and research, with no buyback programs reported.
Which one has the best ratios?
Based on the evaluations, Paycom Software, Inc. has the more favorable overall financial ratios, demonstrating stronger profitability and capital efficiency. monday.com Ltd. presents a mixed profile with weaker earnings and higher valuation multiples, resulting in a neutral rating. Thus, Paycom’s ratios appear more robust in comparison.
Strategic Positioning
This section compares the strategic positioning of Paycom Software, Inc. (PAYC) and monday.com Ltd. (MNDY) on market position, key segments, and exposure to technological disruption:
Paycom Software, Inc.
- Leading US-based HCM SaaS provider facing competition in software applications.
- Focus on cloud-based human capital management for small to mid-sized US companies, emphasizing payroll and talent management.
- Exposure through proprietary Bluetooth tech and continual HCM innovation within a competitive software environment.
monday.com Ltd.
- International Work OS platform with presence across multiple regions, competing in software applications.
- Provides modular Work OS for work management across varied fields including marketing, CRM, and project management.
- Operates cloud-based visual work OS with modular software blocks, adapting to diverse business needs globally.
Paycom vs monday.com Positioning
Paycom concentrates on US small to mid-sized HCM SaaS with deep payroll and talent solutions, while monday.com pursues a diversified global approach with modular work OS applications. Paycom’s narrow focus contrasts with monday.com’s broader, multi-segment model.
Which has the best competitive advantage?
Paycom demonstrates a very favorable moat with strong, growing ROIC above WACC, indicating durable competitive advantage. monday.com shows slightly unfavorable moat status, shedding value despite improving profitability.
Stock Comparison
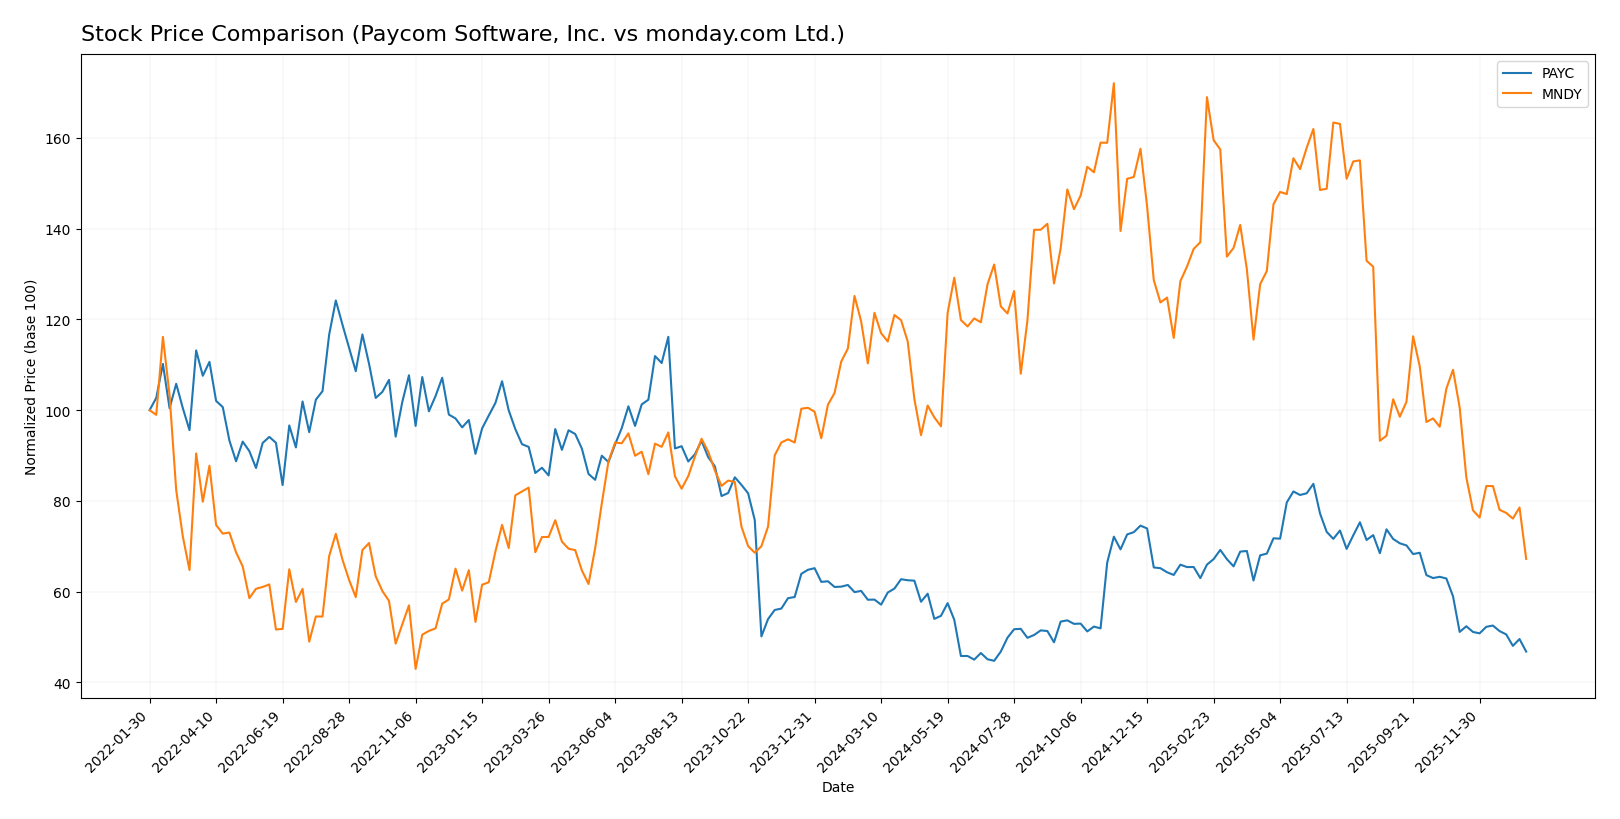
The stock price movements of Paycom Software, Inc. (PAYC) and monday.com Ltd. (MNDY) over the past 12 months exhibit pronounced bearish trends with notable price declines and varying trading volume dynamics.
Trend Analysis
Paycom Software, Inc. (PAYC) experienced a bearish trend over the past 12 months with a price decline of -19.64%. The trend shows deceleration, with a high volatility indicated by a standard deviation of 31.92, and a recent further decline of -20.67%.
monday.com Ltd. (MNDY) also showed a bearish trend, with a sharper price drop of -39.06% over the same period. The trend decelerated amid higher volatility, reflected by a standard deviation of 47.32, and a recent price decrease of -38.27%.
Comparing the two, PAYC delivered a less severe decline than MNDY over the past year, indicating relatively better market performance despite both stocks trending downward.
Target Prices
Analysts present a positive target price consensus for Paycom Software, Inc. and monday.com Ltd., indicating potential upside from current levels.
| Company | Target High | Target Low | Consensus |
|---|---|---|---|
| Paycom Software, Inc. | 290 | 165 | 215 |
| monday.com Ltd. | 330 | 194 | 264.42 |
The consensus targets suggest Paycom’s stock, currently at $148.41, could see significant growth up to $215 on average. Monday.com’s target consensus of $264.42 also implies strong upside potential from its current price of $126.70.
Analyst Opinions Comparison
This section compares analysts’ ratings and grades for Paycom Software, Inc. (PAYC) and monday.com Ltd. (MNDY):
Rating Comparison
PAYC Rating
- Rating: A, classified as Very Favorable
- Discounted Cash Flow Score: 5, Very Favorable
- ROE Score: 5, Very Favorable
- ROA Score: 5, Very Favorable
- Debt To Equity Score: 4, Favorable
- Overall Score: 4, Favorable
MNDY Rating
- Rating: B-, classified as Very Favorable
- Discounted Cash Flow Score: 4, Favorable
- ROE Score: 3, Moderate
- ROA Score: 3, Moderate
- Debt To Equity Score: 3, Moderate
- Overall Score: 3, Moderate
Which one is the best rated?
Based strictly on the provided data, PAYC holds superior ratings with an overall score of 4 and very favorable scores on key metrics like DCF, ROE, and ROA. MNDY’s ratings are moderate overall, reflecting a comparatively lower assessment.
Scores Comparison
Here is a comparison of the Altman Z-Score and Piotroski Score for Paycom Software, Inc. and monday.com Ltd.:
PAYC Scores
- Altman Z-Score: 3.84, indicating a safe zone, low bankruptcy risk.
- Piotroski Score: 5, reflecting average financial strength.
MNDY Scores
- Altman Z-Score: 6.33, indicating a safe zone, very low bankruptcy risk.
- Piotroski Score: 5, reflecting average financial strength.
Which company has the best scores?
Based on the provided data, monday.com Ltd. shows a higher Altman Z-Score, suggesting stronger financial stability, while both companies have the same average Piotroski Score of 5.
Grades Comparison
Here is a comparison of the latest grades assigned to Paycom Software, Inc. and monday.com Ltd.:
Paycom Software, Inc. Grades
The following table summarizes recent grades from reputable grading companies for Paycom Software, Inc.:
| Grading Company | Action | New Grade | Date |
|---|---|---|---|
| Barclays | Maintain | Equal Weight | 2026-01-12 |
| TD Cowen | Maintain | Buy | 2026-01-08 |
| Citigroup | Maintain | Neutral | 2025-12-23 |
| Keybanc | Maintain | Overweight | 2025-11-06 |
| TD Cowen | Maintain | Buy | 2025-11-06 |
| UBS | Maintain | Buy | 2025-11-06 |
| Jefferies | Maintain | Hold | 2025-11-06 |
| JP Morgan | Maintain | Neutral | 2025-11-06 |
| Mizuho | Maintain | Neutral | 2025-11-06 |
| Barclays | Maintain | Equal Weight | 2025-11-06 |
Paycom Software’s grades show a balanced sentiment with multiple “Buy” and “Overweight” ratings but also several “Neutral” and “Hold” assessments, indicating mixed but generally cautious optimism.
monday.com Ltd. Grades
The following table presents recent grades from recognized grading companies for monday.com Ltd.:
| Grading Company | Action | New Grade | Date |
|---|---|---|---|
| BTIG | Maintain | Buy | 2026-01-15 |
| Barclays | Maintain | Overweight | 2026-01-12 |
| Jefferies | Maintain | Buy | 2026-01-05 |
| Citigroup | Maintain | Buy | 2025-12-23 |
| Tigress Financial | Maintain | Buy | 2025-12-11 |
| Baird | Maintain | Outperform | 2025-11-11 |
| Wells Fargo | Maintain | Overweight | 2025-11-11 |
| DA Davidson | Maintain | Buy | 2025-11-11 |
| Morgan Stanley | Maintain | Overweight | 2025-11-11 |
| Piper Sandler | Maintain | Overweight | 2025-11-11 |
monday.com Ltd. consistently receives predominantly positive ratings, with numerous “Buy,” “Overweight,” and “Outperform” grades, reflecting strong confidence from analysts.
Which company has the best grades?
monday.com Ltd. has received notably more favorable grades compared to Paycom Software, Inc., with a stronger consensus leaning towards “Buy” and “Outperform.” This divergence may influence investors seeking growth potential and analyst confidence, highlighting monday.com’s perceived stronger momentum in the marketplace.
Strengths and Weaknesses
The table below summarizes the key strengths and weaknesses of Paycom Software, Inc. (PAYC) and monday.com Ltd. (MNDY) based on their diversification, profitability, innovation, global presence, and market share using the most recent data.
| Criterion | Paycom Software, Inc. (PAYC) | monday.com Ltd. (MNDY) |
|---|---|---|
| Diversification | Moderate – mainly recurring revenue (1.73B USD in 2024), limited product segmentation | Low – product segmentation data unavailable, likely focused on project management tools |
| Profitability | High – net margin 26.66%, ROIC 24.86%, ROE 31.85%, creating strong value | Low – net margin 3.33%, negative ROIC (-1.73%), value destroying but improving |
| Innovation | Strong – growing ROIC by 54%, durable competitive advantage | Moderate – ROIC growing near 100%, but still slightly unfavorable moat status |
| Global presence | Established – significant recurring revenue suggests wide adoption | Emerging – strong liquidity ratios but smaller scale and less profitability |
| Market Share | Leading in payroll software with durable moat | Niche player in collaboration tools with room to grow |
In summary, PAYC demonstrates a robust financial and competitive position with strong profitability and a durable moat, making it a safer investment choice. MNDY shows promising growth and improving profitability but still faces challenges in value creation and market diversification, requiring more cautious consideration.
Risk Analysis
Below is a comparative table of key risks for Paycom Software, Inc. (PAYC) and monday.com Ltd. (MNDY) based on the latest available data for 2024.
| Metric | Paycom Software, Inc. (PAYC) | monday.com Ltd. (MNDY) |
|---|---|---|
| Market Risk | Moderate (Beta 0.82, stable US market exposure) | Higher (Beta 1.26, more volatile NASDAQ and international exposure) |
| Debt level | Very low (Debt-to-Equity 0.05, favorable) | Low (Debt-to-Equity 0.10, manageable but higher than PAYC) |
| Regulatory Risk | Moderate (US-focused, compliance-heavy HR sector) | Moderate to High (International operations including Europe/Israel, diverse regulatory environments) |
| Operational Risk | Low (Strong financial metrics and operational efficiency) | Moderate (Lower net margin and ROIC indicate operational challenges) |
| Environmental Risk | Low (Software sector, minimal direct impact) | Low (Similar software sector profile) |
| Geopolitical Risk | Low (US domestic focus) | Moderate (Exposure to geopolitical tensions in Middle East and Europe) |
The most impactful risks are monday.com’s higher market volatility and geopolitical exposure, given its international footprint. Paycom’s main risk lies in market competition and regulatory compliance within the US HR software niche, but its low debt and strong financial health mitigate major threats. Investors should weigh higher operational uncertainties and valuation concerns in monday.com against Paycom’s steadier profile.
Which Stock to Choose?
Paycom Software, Inc. (PAYC) shows a favorable income evolution with 11.19% revenue growth in 2024 and strong profitability metrics: a 26.66% net margin and 31.85% ROE. Its debt levels remain low, supported by a 0.05 debt-to-equity ratio and excellent interest coverage, earning a very favorable overall rating.
monday.com Ltd. (MNDY) experienced higher revenue growth at 33.21% in 2024 but with lower profitability, reflected in a 3.33% net margin and 3.14% ROE. Despite a stronger liquidity position and manageable debt, its financial ratios are mixed, resulting in a neutral global ratios opinion and a very favorable but moderate overall rating.
Investors prioritizing stability and strong profitability might find PAYC’s consistent value creation and very favorable rating appealing, while those seeking higher growth potential but facing profitability challenges could interpret MNDY as a growth candidate with a slightly unfavorable moat status.
Disclaimer: Investment carries a risk of loss of initial capital. The past performance is not a reliable indicator of future results. Be sure to understand risks before making an investment decision.
Go Further
I encourage you to read the complete analyses of Paycom Software, Inc. and monday.com Ltd. to enhance your investment decisions: