Home > Comparison > Industrials > XYL vs PSN
The strategic rivalry between Xylem Inc. and Parsons Corporation shapes the industrial machinery sector’s evolution. Xylem operates as a capital-intensive leader in water infrastructure and smart water technology. Parsons focuses on integrated defense, intelligence, and critical infrastructure solutions with a technology-driven approach. This analysis pits asset-heavy manufacturing against high-tech services to identify which trajectory offers superior risk-adjusted returns for a diversified industrial portfolio in 2026.
Table of contents
Companies Overview
Xylem Inc. and Parsons Corporation stand as pivotal players in industrial machinery with distinct market footprints and strategic priorities in 2026.
Xylem Inc.: Water Technology Powerhouse
Xylem Inc. dominates the water and wastewater solutions market through engineered products and services. Its revenue stems from diversified segments: Water Infrastructure, Applied Water, and Measurement & Control Solutions. In 2026, Xylem sharpens its focus on smart water technologies and advanced analytics, reinforcing its competitive edge in sustainable water management worldwide.
Parsons Corporation: Defense and Infrastructure Integrator
Parsons Corporation specializes in integrated solutions for defense, intelligence, and critical infrastructure sectors. Its core revenue derives from Federal Solutions and Critical Infrastructure services, including cybersecurity, missile defense, and smart transportation systems. For 2026, Parsons prioritizes expanding cyber defense capabilities and space situational awareness, emphasizing innovation in government and industrial applications.
Strategic Collision: Similarities & Divergences
Both companies operate in the industrial machinery space but follow contrasting business models. Xylem pursues a product and service ecosystem centered on water technology, while Parsons emphasizes integrated defense and infrastructure solutions. Their primary battleground is critical infrastructure innovation, yet Xylem appeals to sustainable resource management investors, whereas Parsons attracts those focused on government contracting and advanced technology integration.
Income Statement Comparison
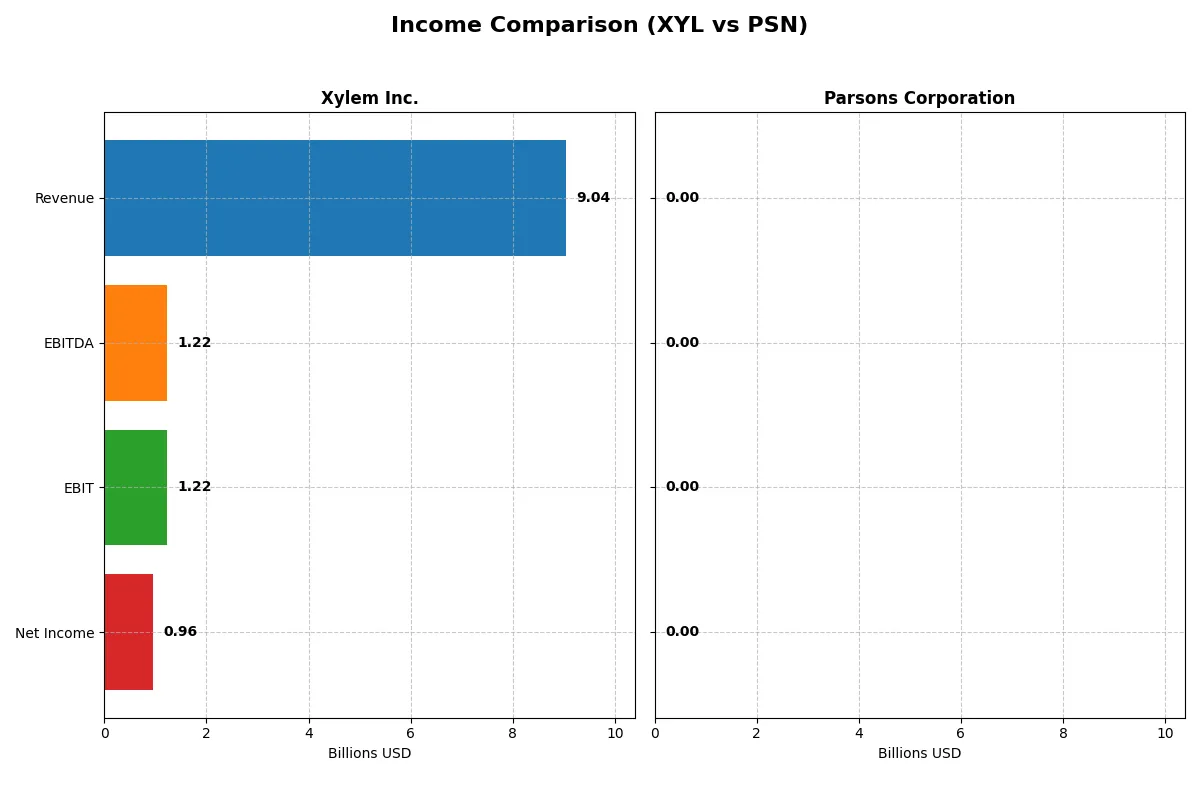
This data dissects the core profitability and scalability of both corporate engines to reveal who dominates the bottom line:
| Metric | Xylem Inc. (XYL) | Parsons Corporation (PSN) |
|---|---|---|
| Revenue | 9.04B | 100K |
| Cost of Revenue | 5.56B | 0 |
| Operating Expenses | 2.25B | 16K |
| Gross Profit | 3.48B | 0 |
| EBITDA | 1.22B | 6.6K |
| EBIT | 1.22B | 0 |
| Interest Expense | 29M | -800 |
| Net Income | 957M | 3.8K |
| EPS | 3.93 | 0 |
| Fiscal Year | 2025 | 2025 |
Income Statement Analysis: The Bottom-Line Duel
This income statement comparison reveals the true efficiency and profitability of two distinct corporate engines over recent fiscal years.
Xylem Inc. Analysis
Xylem Inc. shows a strong upward trajectory in revenue, hitting $9.04B in 2025 with net income rising to $957M. Its gross margin remains healthy at 38.5%, while the net margin stands at a solid 10.6%. The company’s efficiency improved in 2025, with favorable growth in gross profit (+8.2%) and EBIT (+8.1%), supporting steady momentum.
Parsons Corporation Analysis
Parsons Corporation’s revenue collapsed from $6.75B in 2024 to just $100K in 2025, erasing previous earnings momentum. Gross profit and EBIT margins plunged to zero in the latest year, reflecting operational inactivity or a major restructuring. Despite a slight net margin improvement to 3.8%, the overall income statement paints a challenging picture for 2025.
Margin Strength vs. Revenue Collapse
Xylem dominates with consistent revenue and profit growth, boasting robust margins and improving operational efficiency. Parsons suffers a dramatic revenue collapse, erasing its prior scale and profitability. For investors prioritizing stable earnings and margin health, Xylem’s profile clearly stands out as more attractive and dependable.
Financial Ratios Comparison
These vital ratios act as a diagnostic tool to expose the underlying fiscal health, valuation premiums, and capital efficiency of the companies compared below:
| Ratios | Xylem Inc. (XYL) | Parsons Corporation (PSN) |
|---|---|---|
| ROE | 8.3% | ~0.0% |
| ROIC | 6.4% | ~0.0% |
| P/E | 34.6 | 0 |
| P/B | 2.89 | 0 |
| Current Ratio | 1.63 | 1.75 |
| Quick Ratio | 1.28 | 1.75 |
| D/E (Debt-to-Equity) | 0.17 | 0.52 |
| Debt-to-Assets | 11.0% | 23.9% |
| Interest Coverage | 42.2 | -8.25 |
| Asset Turnover | 0.51 | 0.00002 |
| Fixed Asset Turnover | 7.80 | 0.00036 |
| Payout ratio | 40.9% | 0 |
| Dividend yield | 1.18% | 0 |
| Fiscal Year | 2025 | 2025 |
Efficiency & Valuation Duel: The Vital Signs
Financial ratios act as a company’s DNA, uncovering hidden risks and operational strengths that shape investor decisions.
Xylem Inc.
Xylem posts a solid 10.6% net margin but an unimpressive 8.3% ROE, signaling moderate profitability. Its P/E of 34.6 suggests the stock trades at a premium, reflecting stretched valuation. The company supports shareholders with a 1.18% dividend yield, balancing income with reinvestment in R&D for future growth.
Parsons Corporation
Parsons struggles with weak profitability metrics, including a near-zero ROE and 3.8% net margin. The valuation metrics are favorable due to zero P/E and P/B ratios, but these reflect a lack of earnings rather than attractiveness. Parsons does not pay dividends, likely reinvesting in operations amid financial challenges.
Premium Valuation vs. Operational Safety
Xylem offers a better blend of operational efficiency and shareholder returns despite a higher valuation. Parsons’ financial weaknesses and absent profitability ratios increase risk. Investors seeking stability may lean toward Xylem, while those tolerant of uncertainty might consider Parsons’ turnaround potential.
Which one offers the Superior Shareholder Reward?
Xylem Inc. (XYL) delivers steady dividends with a 1.18% yield and a sustainable 41% payout ratio, supported by free cash flow coverage at 73%. Its share buyback program enhances total returns, reflecting prudent capital allocation. Parsons Corporation (PSN) pays no dividend but invests heavily in growth, showing robust free cash flow with a 100% buyback coverage ratio. Historically, I’ve observed that in cyclical sectors, consistent dividends plus buybacks, like XYL’s, reward shareholders more reliably over market cycles. Therefore, I conclude XYL offers the superior total return profile for 2026 investors, balancing income and capital appreciation with sustainable distributions.
Comparative Score Analysis: The Strategic Profile
The radar chart reveals the fundamental DNA and trade-offs of both firms, highlighting their financial strengths and valuation challenges:
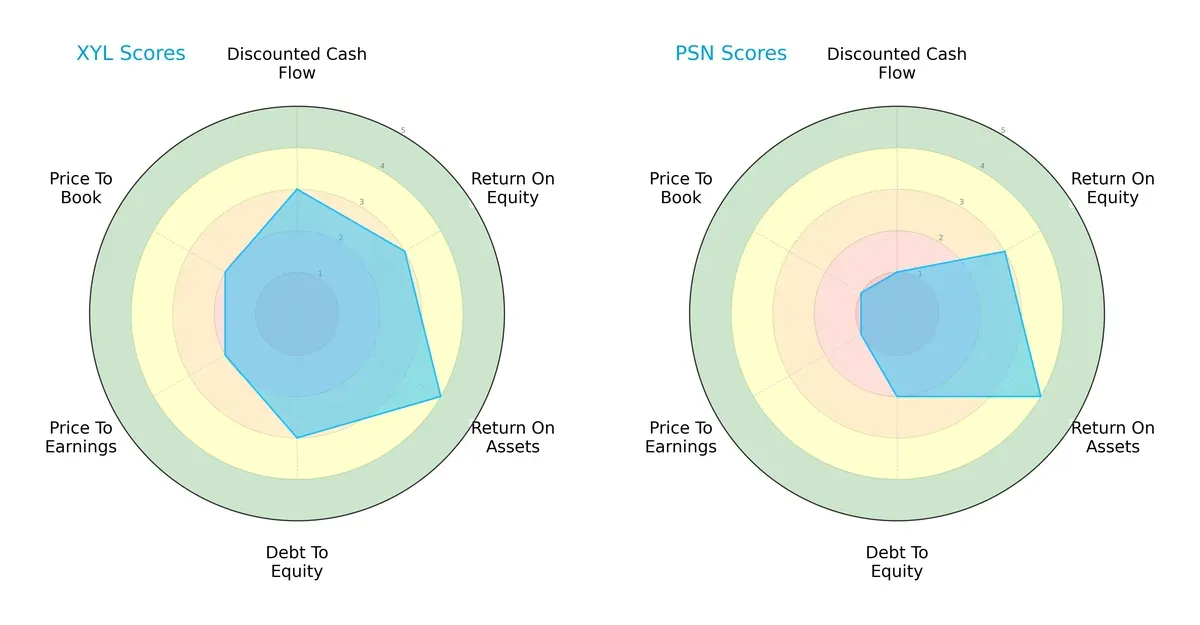
Xylem Inc. (XYL) shows a more balanced profile with moderate DCF, ROE, and debt-to-equity scores, and a favorable ROA score. Parsons Corporation (PSN) relies heavily on asset efficiency but lags in DCF and leverage metrics, reflecting higher financial risk and valuation pressure. XYL’s moderate edge in capital allocation and stability suggests a steadier investment stance.
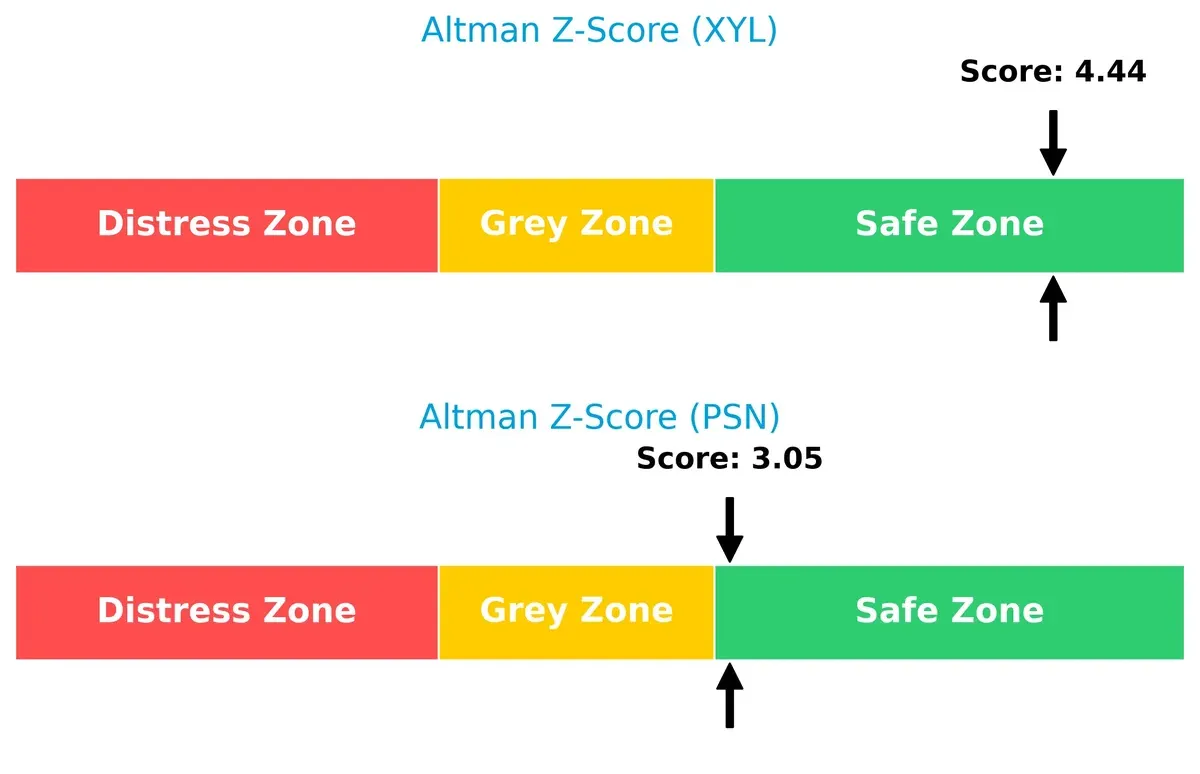
Bankruptcy Risk: Solvency Showdown
Xylem’s Altman Z-Score of 4.44 versus Parsons’ 3.05 confirms both firms are in the safe zone, but XYL enjoys a stronger cushion against distress in this cycle:
Financial Health: Quality of Operations
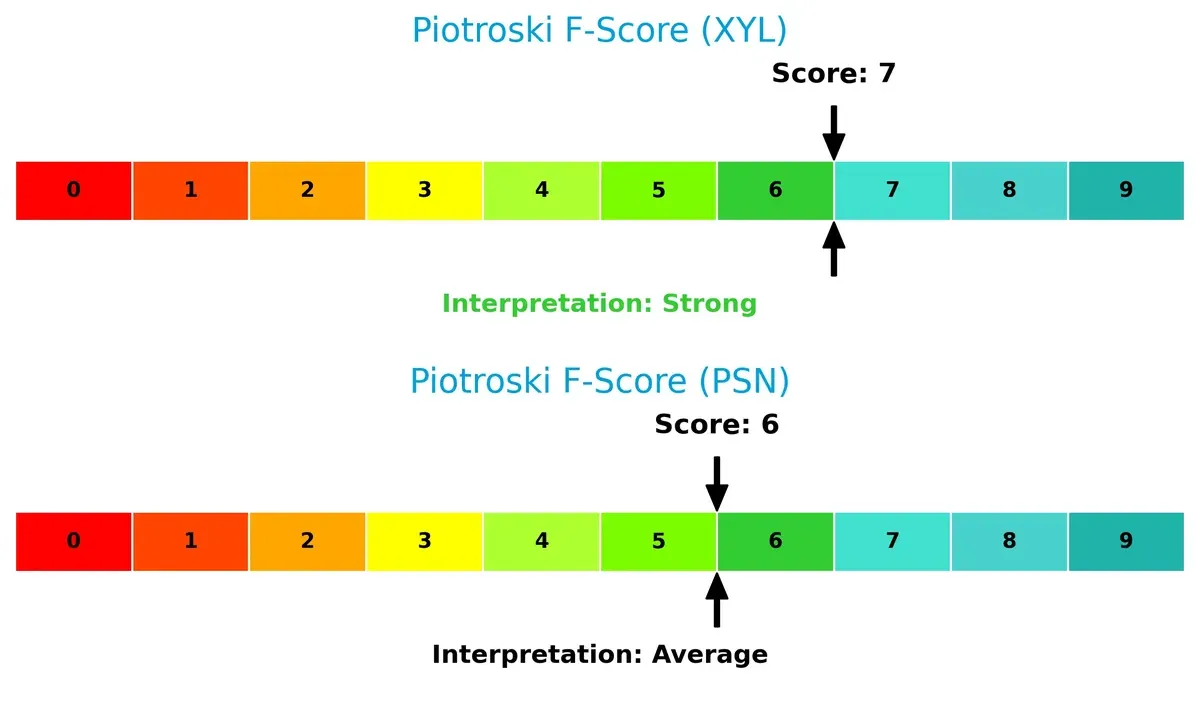
Xylem’s Piotroski F-Score of 7 surpasses Parsons’ 6, indicating stronger internal financial metrics and operational quality. Parsons’ average score flags some caution on its financial robustness:
How are the two companies positioned?
This section dissects the operational DNA of Xylem and Parsons by comparing their revenue distribution and internal dynamics. The goal is to confront their economic moats and identify the more resilient competitive advantage today.
Revenue Segmentation: The Strategic Mix
This visual comparison dissects how Xylem Inc. and Parsons Corporation diversify their income streams and reveals where their primary sector bets lie:
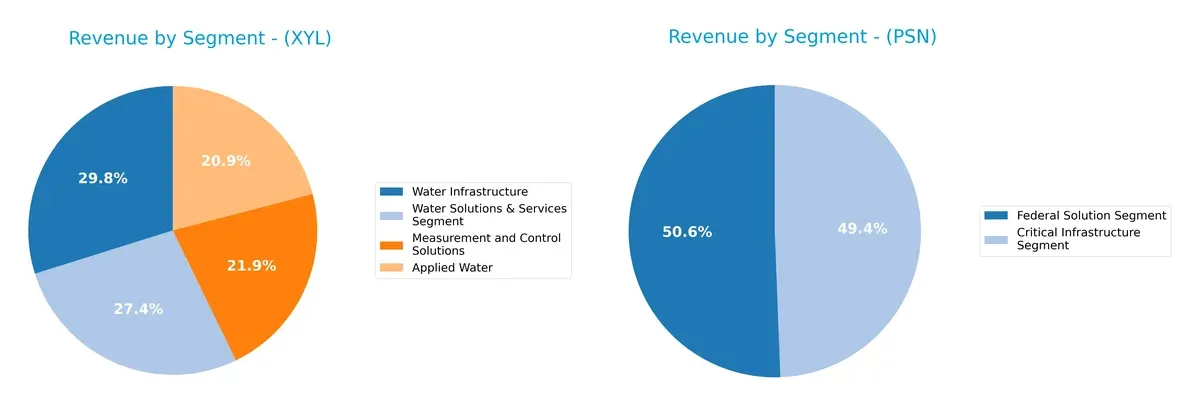
Xylem anchors revenue in Water Infrastructure at $2.56B and Water Solutions & Services at $2.34B, showing a balanced portfolio across four segments. Parsons pivots between Federal Solutions at $4B and Critical Infrastructure at $2.74B, revealing a dual-segment focus. Xylem’s diversified mix reduces concentration risk, while Parsons relies heavily on government contracting, indicating ecosystem lock-in but higher exposure to public spending cycles.
Strengths and Weaknesses Comparison
This table compares the Strengths and Weaknesses of Xylem Inc. and Parsons Corporation:
Xylem Inc. Strengths
- Diversified revenue streams across Applied Water, Measurement Control, Water Infrastructure, and Services
- Strong profitability with 10.59% net margin
- Healthy liquidity ratios: current 1.62, quick 1.28
- Low leverage with debt-to-assets at 11.01%
- Significant global presence in US, Europe, Asia Pacific
- Favorable fixed asset turnover at 7.8
Parsons Corporation Strengths
- Focus on Federal and Critical Infrastructure segments with strong revenue
- Favorable cost of capital with WACC at 2.19%
- Solid liquidity ratios: current and quick at 1.75
- Favorable price-to-earnings and price-to-book ratios
- Growing presence in North America and Middle East
- Debt-to-assets moderate at 23.87%
Xylem Inc. Weaknesses
- Return on equity (8.34%) below cost of capital (8.75%) indicates weak capital efficiency
- Elevated P/E ratio at 34.64 suggests high valuation risk
- Neutral asset turnover at 0.51 implies moderate operational efficiency
- ROIC (6.42%) slightly below WACC (8.75%) signals limited value creation
- Dividend yield modest at 1.18%
Parsons Corporation Weaknesses
- Weak profitability with net margin 3.8% and ROE, ROIC at 0%
- Negative interest coverage ratio signals difficulty covering interest expenses
- Poor asset turnover metrics at zero indicate operational inefficiency
- Absence of dividend yield limits income for investors
- High proportion of unfavorable financial ratios (50%)
Xylem’s strengths lie in diversified business segments and solid liquidity, but its returns lag cost of capital, limiting value creation. Parsons shows strong liquidity and favorable capital cost but suffers from weak profitability and operational inefficiency. Both companies must address distinct challenges to enhance shareholder value.
The Moat Duel: Analyzing Competitive Defensibility
A structural moat is the only thing protecting long-term profits from relentless competition erosion. Let’s dissect the defensive strengths of these two industrial players:
Xylem Inc.: Intangible Assets and Brand Depth
Xylem’s moat centers on intangible assets—trusted water technology brands and integrated solutions. This manifests in stable 10.6% net margins and 5.5% revenue growth in 2025. However, its declining ROIC signals pressure on capital efficiency, risking moat erosion unless it innovates in emerging water markets.
Parsons Corporation: Specialized Government Contracting
Parsons relies on specialized federal defense and infrastructure contracts, creating high switching costs. Yet, zero gross margin and negative revenue growth in 2025 reveal operational challenges. Its shrinking ROIC reflects difficulty maintaining value, but expanding cybersecurity and intelligence solutions offer a path to restore competitive edge.
Verdict: Intangible Brand Strength vs. Contract Specialization
Both firms suffer declining ROIC and value destruction, indicating weak moats. I see Xylem’s intangible assets as a wider moat due to diversified end markets and higher margin stability. Parsons’ niche contracts are deeper but more vulnerable to budget shifts. Xylem is better positioned to defend its market share if it reverses capital inefficiencies.
Which stock offers better returns?
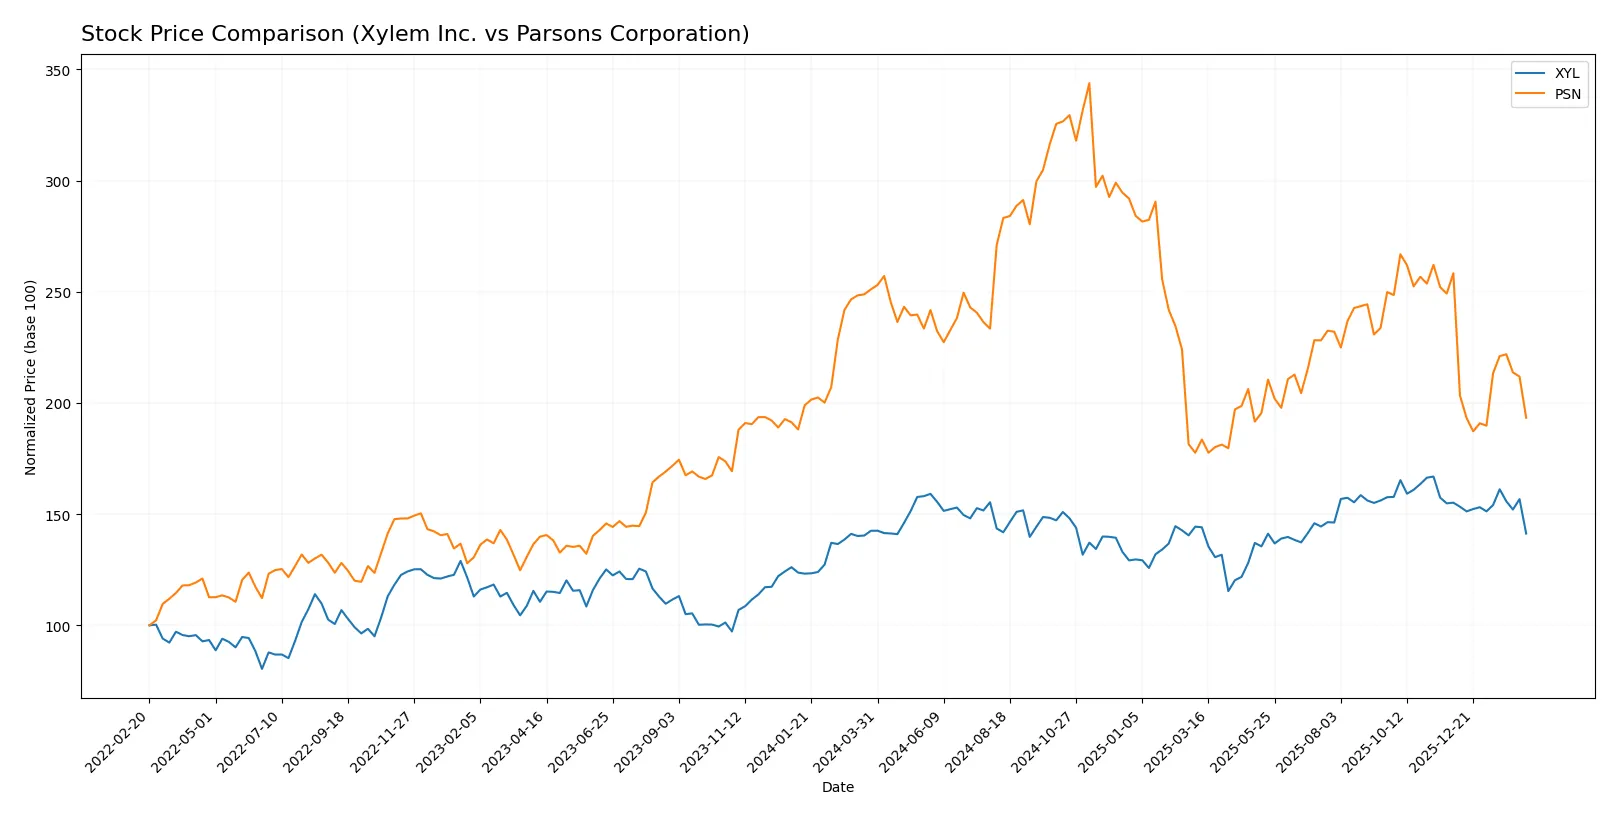
The past year shows both Xylem Inc. and Parsons Corporation under bearish pressure, with notable price declines and decelerating trends highlighting weakening momentum.
Trend Comparison
Xylem Inc. experienced a mild 0.87% price decline over 12 months, signaling a bearish trend with decelerating momentum and a high volatility of 9.59%. The stock ranged between 104.6 and 151.31.
Parsons Corporation faced a steep 23% drop over the same period, confirming a strong bearish trend with deceleration and higher volatility at 13.2%. Its price fluctuated from 58.22 to 112.69.
Comparing trends, Parsons showed a significantly larger loss than Xylem, delivering the weaker market performance among the two stocks.
Target Prices
Analysts present a clear target price consensus for both Xylem Inc. and Parsons Corporation.
| Company | Target Low | Target High | Consensus |
|---|---|---|---|
| Xylem Inc. | 138 | 176 | 162.67 |
| Parsons Corporation | 78 | 104 | 86.8 |
The target consensus for Xylem Inc. stands significantly above its current price of 128.09, signaling expected upside. Parsons Corporation’s consensus price of 86.8 also suggests considerable appreciation potential from its current 63.38.

Don’t Let Luck Decide Your Entry Point
Optimize your entry points with our advanced ProRealTime indicators. You’ll get efficient buy signals with precise price targets for maximum performance. Start outperforming now!
How do institutions grade them?
Xylem Inc. Grades
The following table summarizes recent grades from leading financial institutions for Xylem Inc.:
| Grading Company | Action | New Grade | Date |
|---|---|---|---|
| Citigroup | Maintain | Buy | 2026-02-11 |
| Stifel | Maintain | Buy | 2026-02-11 |
| RBC Capital | Maintain | Outperform | 2026-02-11 |
| Barclays | Maintain | Overweight | 2026-02-11 |
| Barclays | Maintain | Overweight | 2026-01-07 |
| Mizuho | Maintain | Neutral | 2026-01-05 |
| TD Cowen | Maintain | Hold | 2025-12-05 |
| UBS | Maintain | Buy | 2025-11-06 |
| Stifel | Maintain | Buy | 2025-10-29 |
| RBC Capital | Maintain | Outperform | 2025-10-29 |
Parsons Corporation Grades
The table below shows recent grades from reputable institutions for Parsons Corporation:
| Grading Company | Action | New Grade | Date |
|---|---|---|---|
| UBS | Maintain | Buy | 2026-02-12 |
| Truist Securities | Maintain | Buy | 2026-02-12 |
| Keybanc | Maintain | Overweight | 2026-02-12 |
| Barclays | Maintain | Overweight | 2026-01-23 |
| Keybanc | Maintain | Overweight | 2026-01-20 |
| UBS | Maintain | Buy | 2026-01-15 |
| Citigroup | Maintain | Buy | 2026-01-13 |
| B of A Securities | Maintain | Buy | 2025-12-30 |
| Stifel | Maintain | Buy | 2025-12-23 |
| Jefferies | Maintain | Hold | 2025-12-11 |
Which company has the best grades?
Parsons Corporation has consistently received Buy and Overweight ratings from a broad range of institutions. Xylem Inc. also shows strong Buy and Outperform ratings but includes more Neutral and Hold grades. Investors might view Parsons as having slightly stronger consensus support.
Risks specific to each company
The following categories identify the critical pressure points and systemic threats facing both firms in the 2026 market environment:
1. Market & Competition
Xylem Inc.
- Operates in water infrastructure with strong brand presence, facing competition from diversified industrial firms.
Parsons Corporation
- Focuses on defense and critical infrastructure, competing with specialized contractors and tech firms in government sectors.
2. Capital Structure & Debt
Xylem Inc.
- Low debt-to-equity (0.17) and strong interest coverage (42.17) signal solid financial stability.
Parsons Corporation
- Higher leverage (debt-to-equity 0.52) and negative interest coverage suggest elevated financial risk.
3. Stock Volatility
Xylem Inc.
- Beta 1.16 indicates moderate market sensitivity, typical for industrial machinery.
Parsons Corporation
- Beta 0.66 shows lower volatility but potentially less market responsiveness.
4. Regulatory & Legal
Xylem Inc.
- Subject to environmental regulations in water treatment, with compliance costs manageable.
Parsons Corporation
- Faces complex defense contracting regulations and cybersecurity compliance risks.
5. Supply Chain & Operations
Xylem Inc.
- Global manufacturing and distribution expose it to supply chain disruptions but diversified sourcing mitigates risk.
Parsons Corporation
- Operation in sensitive defense sectors requires secure and reliable supply chain, vulnerable to geopolitical shifts.
6. ESG & Climate Transition
Xylem Inc.
- Water sustainability focus aligns with ESG trends, enhancing reputation and access to green financing.
Parsons Corporation
- ESG risks tied to defense contracts and environmental impact of infrastructure projects.
7. Geopolitical Exposure
Xylem Inc.
- International presence exposes it to trade tensions but less dependent on government contracts.
Parsons Corporation
- Heavy reliance on U.S. defense spending and international military alliances creates geopolitical sensitivity.
Which company shows a better risk-adjusted profile?
Xylem’s most impactful risk lies in market competition amid broad industrial peers. Parsons faces critical financial risk from high leverage and weak interest coverage. I find Xylem’s robust balance sheet and strong ESG positioning give it a superior risk-adjusted profile. Parsons’ financial strain and geopolitical reliance remain key vulnerabilities in 2026.
Final Verdict: Which stock to choose?
Xylem Inc. wields unmatched efficiency in cash flow generation and operational resilience. Its strength lies in solid liquidity and a favorable income statement, though its declining ROIC signals a point of vigilance. It suits investors seeking steady growth with moderate risk tolerance.
Parsons Corporation’s strategic moat hinges on its asset-light model and recent operational improvements, offering a leaner balance sheet and higher free cash flow yield than Xylem. Despite weaker profitability and value destruction signs, it may appeal to value-focused investors who prioritize capital discipline over growth.
If you prioritize operational efficiency and consistent income growth, Xylem stands out due to its superior cash conversion and financial stability. However, if you seek value plays with potential turnaround characteristics, Parsons offers better capital structure metrics but carries higher risk from profitability challenges.
Disclaimer: Investment carries a risk of loss of initial capital. The past performance is not a reliable indicator of future results. Be sure to understand risks before making an investment decision.
Go Further
I encourage you to read the complete analyses of Xylem Inc. and Parsons Corporation to enhance your investment decisions: