Home > Comparison > Industrials > PSN vs TDY
The strategic rivalry between Parsons Corporation and Teledyne Technologies shapes the future of industrial and technology sectors. Parsons operates as a capital-intensive industrial machinery provider focused on defense and critical infrastructure. Teledyne, a technology-driven hardware and equipment specialist, dominates digital imaging and aerospace electronics. This head-to-head pits industrial scale against technological innovation. My analysis will reveal which company offers a superior risk-adjusted opportunity for a diversified portfolio in today’s complex market environment.

Table of contents
Companies Overview
Parsons Corporation and Teledyne Technologies Incorporated are key players in critical industrial and technology sectors.
Parsons Corporation: Integrated Defense and Infrastructure Solutions
Parsons Corporation dominates the defense and critical infrastructure markets by delivering integrated solutions. Its revenue stems from cybersecurity, geospatial intelligence, missile defense, and smart city infrastructure. In 2026, Parsons focuses strategically on expanding advanced cybersecurity platforms and command-and-control solutions for U.S. defense agencies and critical public utilities.
Teledyne Technologies Incorporated: Advanced Instrumentation and Imaging
Teledyne Technologies specializes in cutting-edge instrumentation and digital imaging for industrial growth markets worldwide. Its revenue engine includes instrumentation for environmental monitoring, aerospace electronics, and precision digital imaging systems. The company’s 2026 strategy emphasizes innovation in aerospace defense electronics and electrochemical energy systems for military applications.
Strategic Collision: Similarities & Divergences
Both firms prioritize defense-related technologies but diverge in approach: Parsons integrates systems for infrastructure resilience, while Teledyne advances specialized instrumentation and electronic components. Their primary battleground is the U.S. government’s defense and aerospace spending. Parsons appeals with broad infrastructure solutions; Teledyne attracts investors seeking exposure to high-tech instrumentation and imaging markets.
Income Statement Comparison
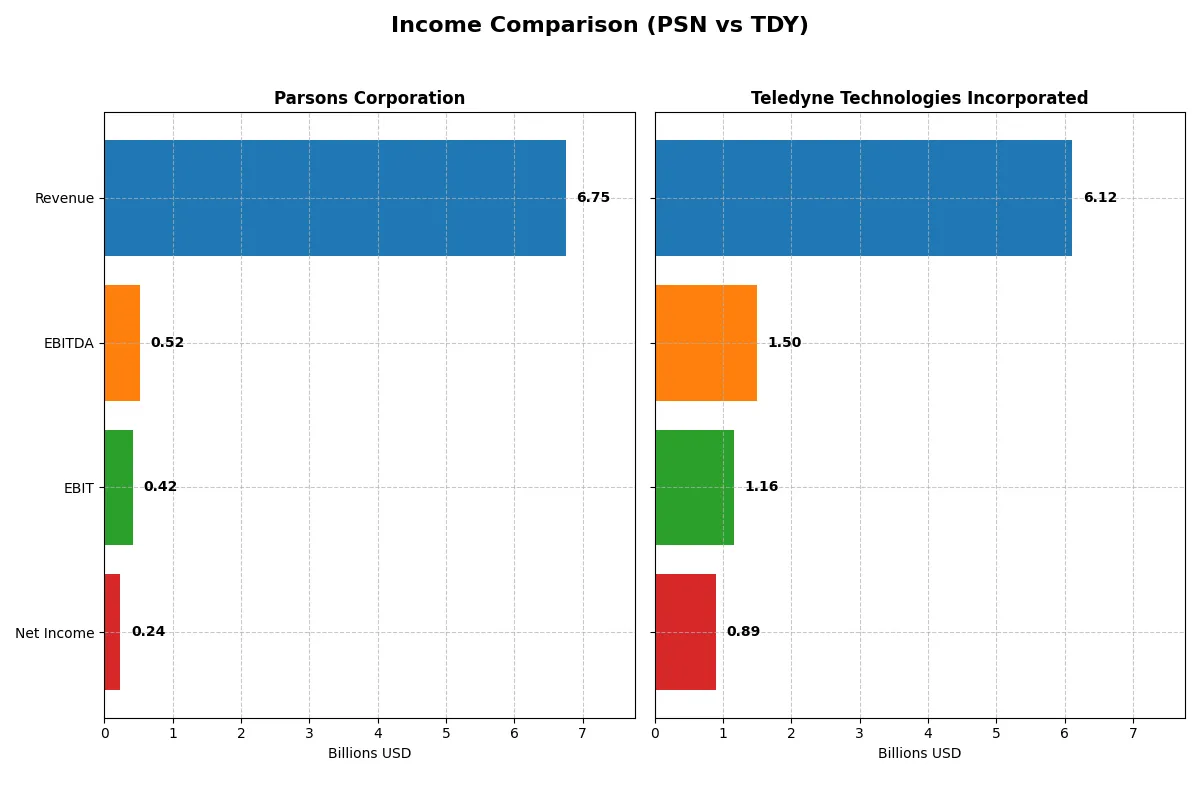
This table dissects the core profitability and scalability of both corporate engines to reveal who dominates the bottom line:
| Metric | Parsons Corporation (PSN) | Teledyne Technologies Incorporated (TDY) |
|---|---|---|
| Revenue | 6.75B | 5.67B |
| Cost of Revenue | 5.34B | 3.24B |
| Operating Expenses | 978M | 1.45B |
| Gross Profit | 1.41B | 2.43B |
| EBITDA | 518M | 1.31B |
| EBIT | 419M | 996M |
| Interest Expense | 52M | 58M |
| Net Income | 238M | 819M |
| EPS | 2.21 | 17.43 |
| Fiscal Year | 2024 | 2024 |
Income Statement Analysis: The Bottom-Line Duel
This income statement comparison reveals which company runs its operations more efficiently and generates stronger profits from its revenues.
Parsons Corporation Analysis
Parsons shows a robust revenue climb from 3.7B in 2021 to 6.8B in 2024, with net income growing sharply from 64M to 238M. Its gross margin at 20.8% remains favorable, while a modest 3.5% net margin signals room for margin expansion. The latest year highlights strong momentum, with a 24% revenue jump and a 49% EPS surge.
Teledyne Technologies Incorporated Analysis
Teledyne delivers steady revenue growth from 4.6B in 2021 to 6.1B in 2025, with net income doubling from 445M to 895M. Its gross margin of 39.2% and healthy 14.6% net margin confirm operational strength. Despite a slight dip in gross profit growth last year, EBIT and EPS show solid double-digit gains, underscoring efficient capital use.
Margin Efficiency vs. Growth Momentum
Teledyne boasts superior margins and higher absolute profits, reflecting strong operational leverage. Parsons impresses with rapid revenue and earnings growth, albeit from a smaller base and lower margins. For investors prioritizing margin power and scale, Teledyne leads. Those focused on growth acceleration may find Parsons’ profile more compelling.
Financial Ratios Comparison
These vital ratios act as a diagnostic tool to expose the underlying fiscal health, valuation premiums, and capital efficiency of the companies analyzed:
| Ratios | Parsons Corporation (PSN) | Teledyne Technologies Incorporated (TDY) |
|---|---|---|
| ROE | 9.7% | 8.5% |
| ROIC | 8.3% | 6.8% |
| P/E | 41.7 | 27.3 |
| P/B | 4.06 | 2.33 |
| Current Ratio | 1.29 | 1.64 |
| Quick Ratio | 1.29 | 1.08 |
| D/E | 0.59 | 0.24 |
| Debt-to-Assets | 26% | 16% |
| Interest Coverage | 8.30 | 19.3 |
| Asset Turnover | 1.23 | 0.40 |
| Fixed Asset Turnover | 25.5 | 7.29 |
| Payout ratio | 0 | 0 |
| Dividend yield | 0 | 0 |
| Fiscal Year | 2024 | 2025 |
Efficiency & Valuation Duel: The Vital Signs
Ratios act as a company’s DNA, uncovering hidden risks and operational strengths that raw numbers alone cannot reveal.
Parsons Corporation
Parsons shows moderate profitability with a 9.7% ROE but weak net margins at 3.5%. Its valuation is stretched, marked by a high P/E of 41.7 and a P/B of 4.06. Parsons does not pay dividends, instead reinvesting cash flow to support growth and maintain operational efficiency.
Teledyne Technologies Incorporated
Teledyne delivers strong net margins at 14.6%, indicating superior profitability despite a slightly lower ROE of 8.5%. The stock trades at a more reasonable P/E of 27.4 and a neutral P/B of 2.33. Teledyne currently does not pay dividends, likely prioritizing R&D to fuel innovation and long-term value.
Balanced Profitability vs. Valuation Stretch
Teledyne offers better net margin efficiency and a more moderate valuation, while Parsons exhibits higher ROE but stretched multiples. Teledyne’s profile suits investors seeking operational safety and growth, whereas Parsons appeals to those betting on reinvestment-driven returns.
Which one offers the Superior Shareholder Reward?
I see Parsons Corporation (PSN) pays no dividends and has no buyback activity, focusing on reinvestment in growth and capital expenditures, with free cash flow per share around 4.5. Teledyne Technologies (TDY) also pays no dividends but executes significant share buybacks, supported by robust free cash flow per share near 23.7 in 2025. TDY’s stronger margins, higher FCF, and aggressive buybacks suggest a more sustainable, shareholder-friendly distribution model. I conclude Teledyne offers a superior total return profile for 2026 investors.
Comparative Score Analysis: The Strategic Profile
The radar chart reveals the fundamental DNA and trade-offs of Parsons Corporation and Teledyne Technologies Incorporated, highlighting their financial strengths and valuation nuances:
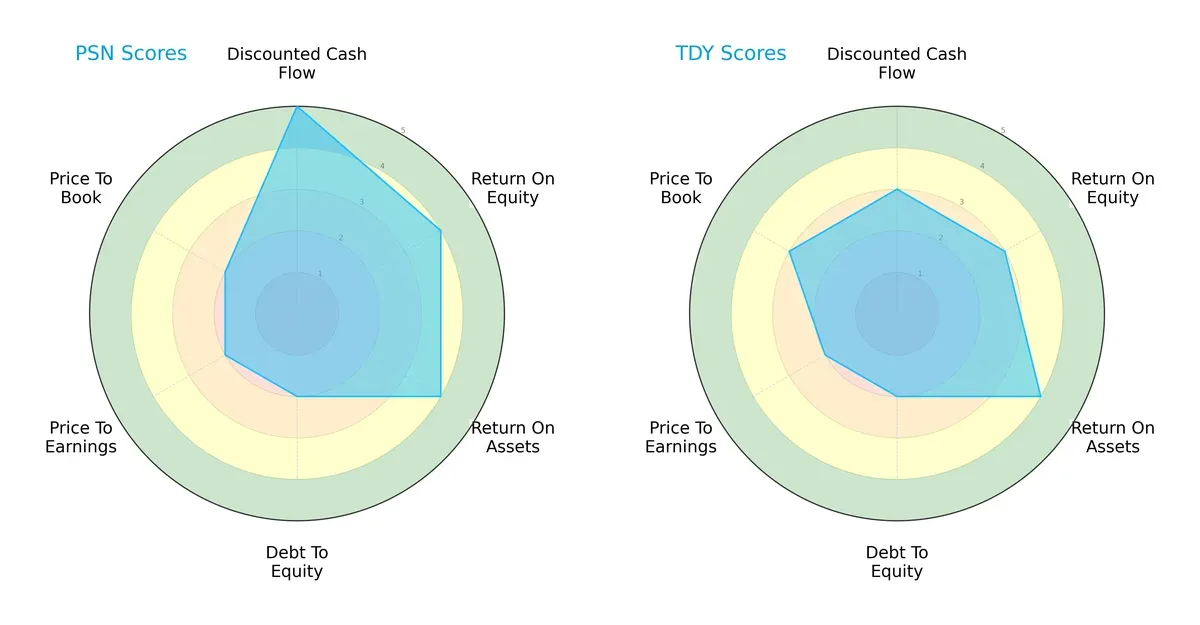
Parsons leads with a very favorable DCF score (5) and stronger ROE (4) and ROA (4) scores, indicating efficient profitability and asset use. Teledyne matches Parsons on ROA (4) but has moderate DCF (3) and ROE (3) scores, suggesting a more conservative growth outlook. Both share moderate debt-to-equity (2) and P/E (2) scores, but Teledyne edges Parsons in price-to-book (3 vs. 2), hinting at slightly better market valuation discipline. Parsons presents a more balanced profile with a clear cash flow advantage, while Teledyne relies more on asset efficiency and valuation stability.
—
Bankruptcy Risk: Solvency Showdown
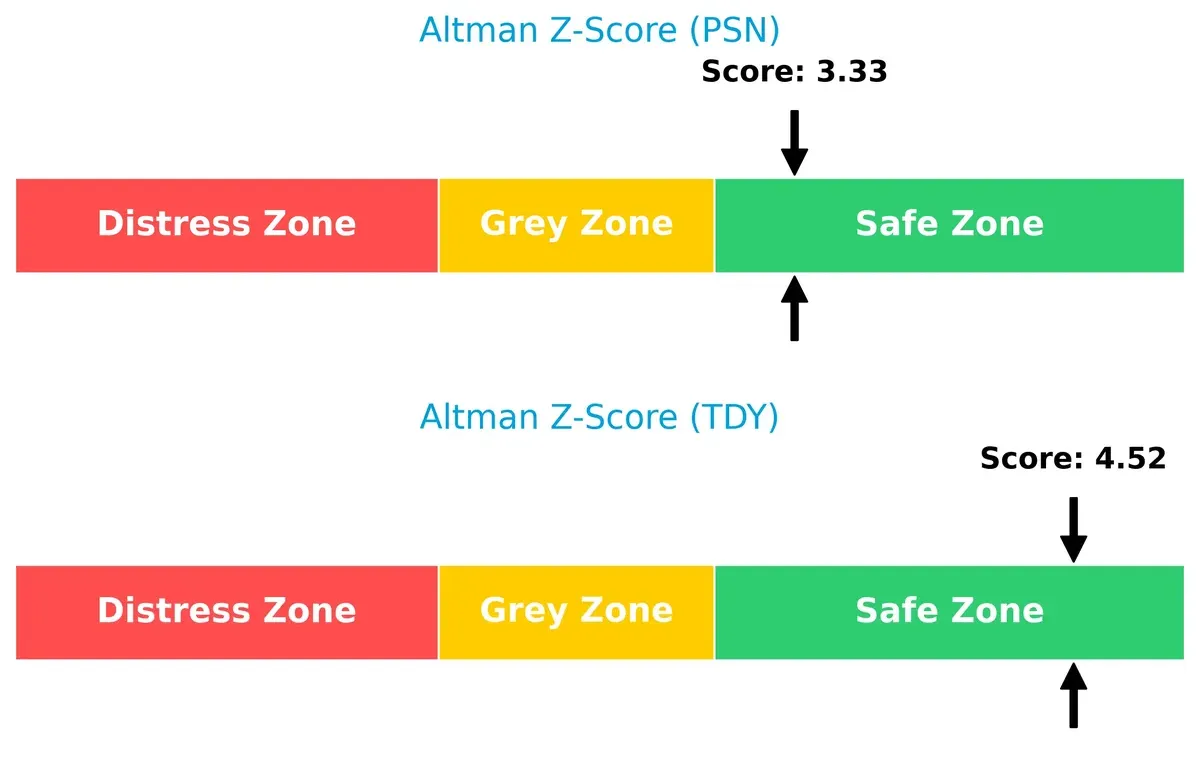
The Altman Z-Score gap shows both firms sit safely above distress thresholds, but Teledyne’s higher score signals stronger long-term solvency and resilience in this cycle:
—
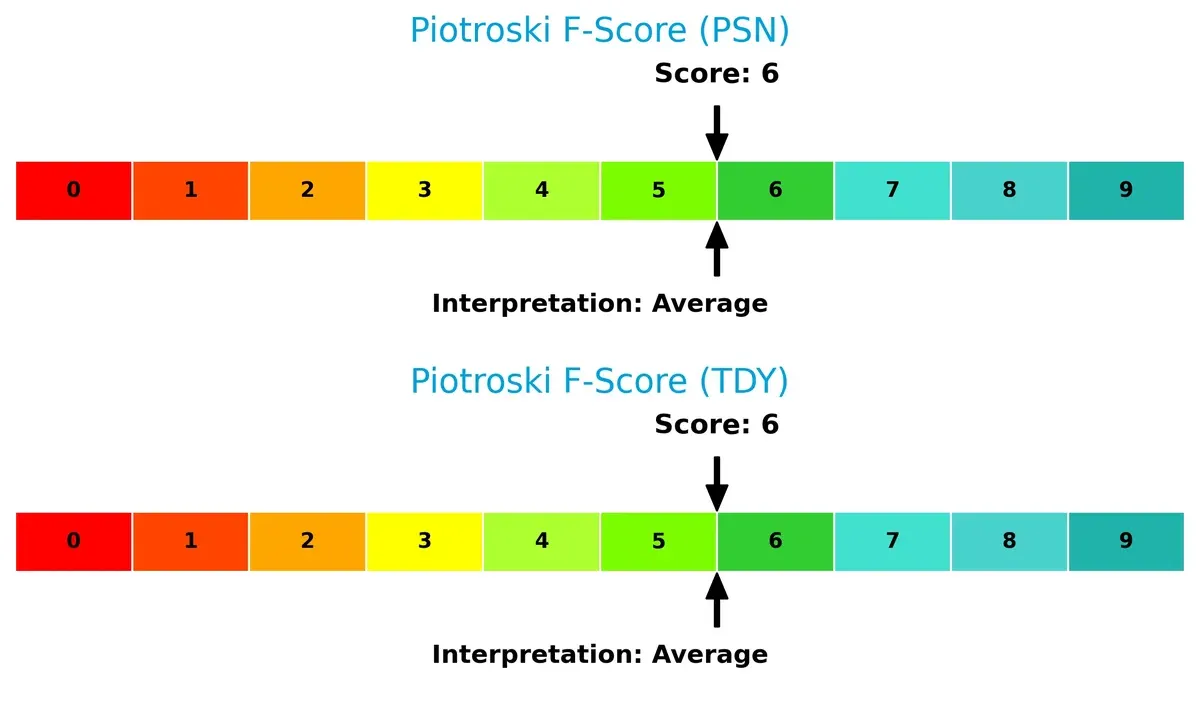
Financial Health: Quality of Operations
Both companies score an average 6 on the Piotroski F-Score, reflecting solid but not peak financial health. Neither shows critical red flags in operational metrics:
How are the two companies positioned?
This section dissects the operational DNA of PSN and TDY by comparing their revenue distribution and internal strengths and weaknesses. The goal is to confront their economic moats to identify which model offers the most resilient competitive advantage today.
Revenue Segmentation: The Strategic Mix
This comparison dissects how Parsons Corporation and Teledyne Technologies diversify income streams and where their primary sector bets lie:
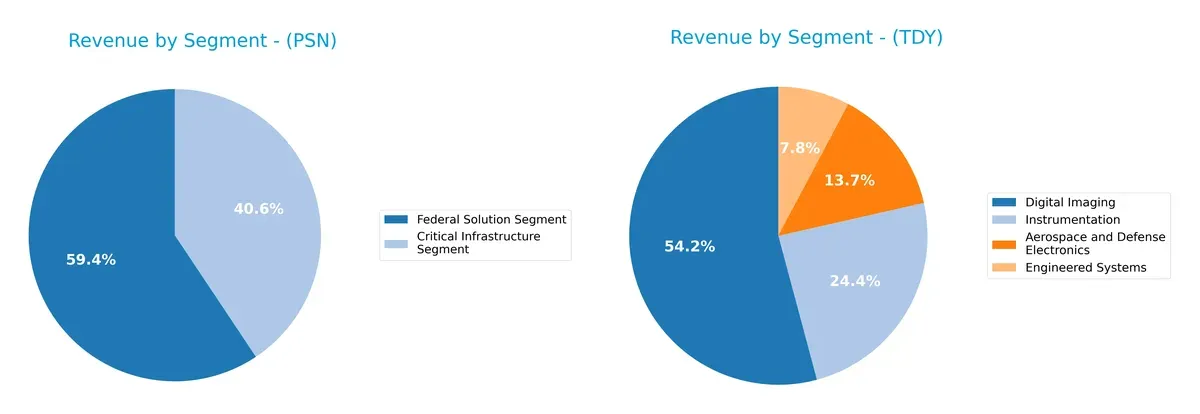
Parsons anchors revenue in two major segments: $4B from Federal Solutions and $2.7B from Critical Infrastructure, showing a clear focus. Teledyne’s $3.1B Digital Imaging dwarfs other segments but its $776M Aerospace and Defense, $1.38B Instrumentation, and $440M Engineered Systems create a more diversified portfolio. Parsons’ concentration poses higher sector risk, while Teledyne’s spread supports resilience and cross-market ecosystem strength.
Strengths and Weaknesses Comparison
This table compares the Strengths and Weaknesses of Parsons Corporation and Teledyne Technologies Incorporated:
Parsons Corporation Strengths
- Strong federal solutions segment of $4B
- Favorable WACC at 6.24%
- Good asset and fixed asset turnover
- Favorable interest coverage and manageable debt ratios
Teledyne Technologies Strengths
- Diversified revenue across four segments
- High net margin at 14.63%
- Strong interest coverage of 19.47
- Favorable current ratio and low debt-to-assets
Parsons Corporation Weaknesses
- Low net margin at 3.48%
- Unfavorable ROE and valuation multiples
- No dividend yield
- Limited non-US revenue exposure
Teledyne Technologies Weaknesses
- Unfavorable ROE and high P/E multiple
- Lower asset turnover at 0.4
- No dividend yield despite profitability
Parsons shows strength in operational efficiency and federal segment scale but struggles with profitability and valuation metrics. Teledyne benefits from diversified revenues and better margins but faces challenges in asset utilization and return on equity. Each company’s financial profile suggests strategic focus areas differ significantly.
The Moat Duel: Analyzing Competitive Defensibility
A structural moat is the only true shield protecting long-term profits from relentless competition erosion. Let’s dissect their defensive strengths:
Parsons Corporation: Intangible Assets & Government Contract Expertise
Parsons leverages deep government ties and cyber-intelligence platforms, reflected in a growing ROIC 2% above WACC and stable margins. Expansion in missile defense and smart infrastructure should fortify this moat through 2026.
Teledyne Technologies Incorporated: Technological Innovation & Diversified Hardware
Teledyne’s moat stems from its advanced instrumentation and aerospace electronics, yet ROIC trails WACC, signaling value erosion despite strong margin profiles. Growth in thermal imaging and defense subsystems offers upside but demands capital discipline.
Moat Battle: Intangible Expertise vs. Technological Breadth
Parsons boasts a deeper, more sustainable moat with superior capital efficiency and less risk of value destruction. Teledyne’s innovation edge is promising, but Parsons is better positioned to defend market share in a competitive landscape.
Which stock offers better returns?
The past year reveals divergent paths: Parsons Corporation’s stock declined sharply, while Teledyne Technologies surged significantly, reflecting contrasting trading dynamics and investor sentiment.
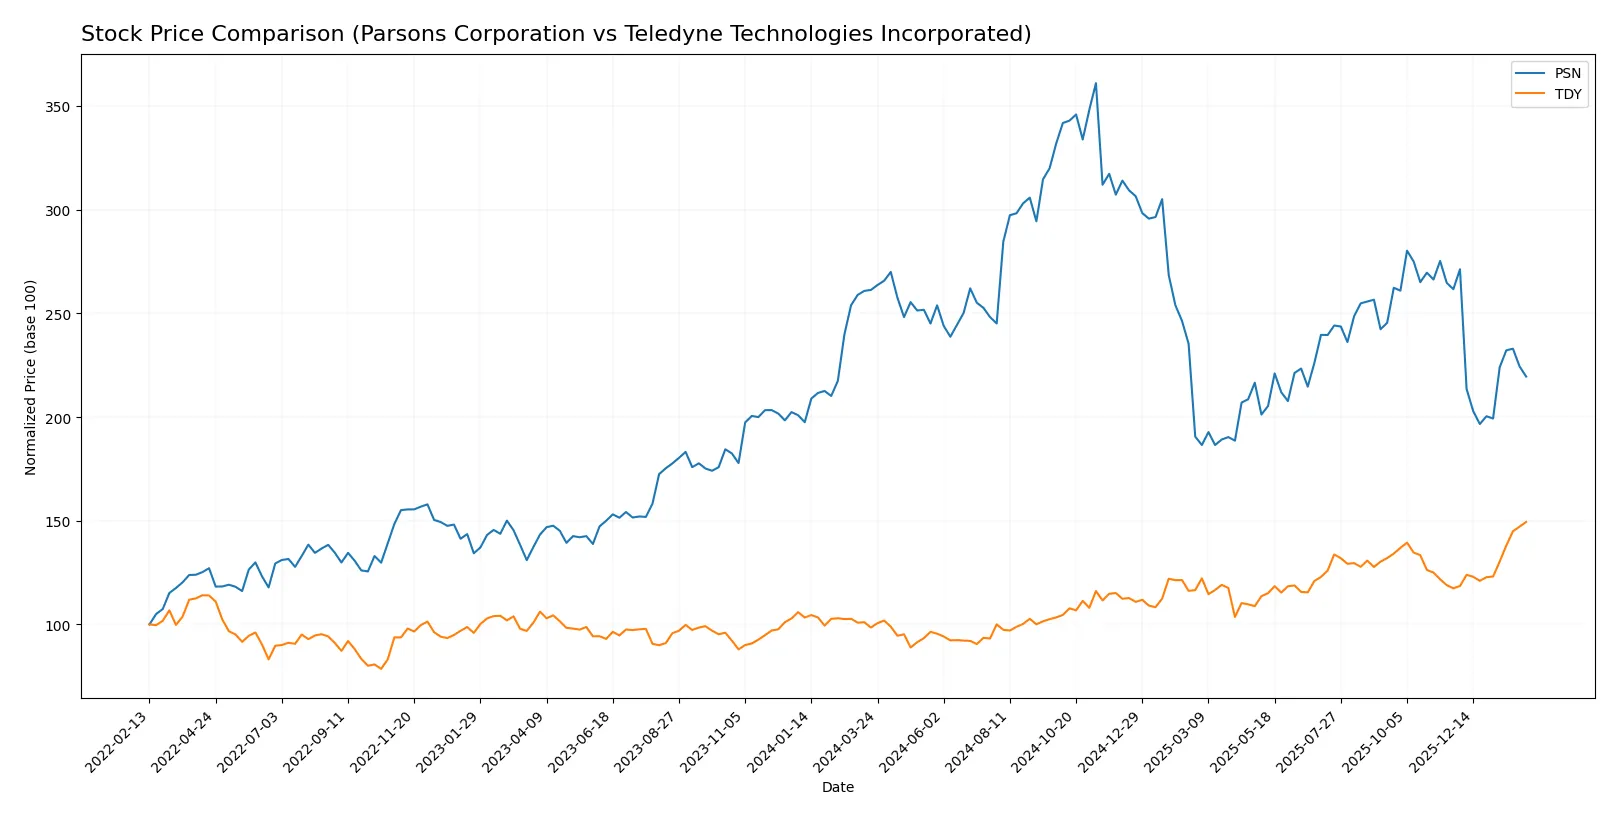
Trend Comparison
Parsons Corporation’s stock fell 16.0% over the past 12 months, confirming a bearish trend with decelerating losses. The price fluctuated between 58.22 and 112.69, exhibiting moderate volatility (std. dev. 13.1).
Teledyne Technologies gained 51.7% over the same period, showing a bullish trend with accelerating momentum. Price ranged from 374.64 to 629.73 and demonstrated high volatility (std. dev. 59.87).
Teledyne Technologies outperformed Parsons Corporation by a wide margin in total return and momentum, delivering the highest market gains during the last year.
Target Prices
Analysts present a cautiously optimistic target consensus for both Parsons Corporation and Teledyne Technologies.
| Company | Target Low | Target High | Consensus |
|---|---|---|---|
| Parsons Corporation | 78 | 104 | 86.8 |
| Teledyne Technologies Incorporated | 599 | 720 | 638.5 |
The target consensus for Parsons stands about 27% above its current price of $68.51, reflecting expected operational improvements. Teledyne’s target consensus is roughly 1.4% above its current price of $629.73, indicating modest upside with some near-term risks.

Don’t Let Luck Decide Your Entry Point
Optimize your entry points with our advanced ProRealTime indicators. You’ll get efficient buy signals with precise price targets for maximum performance. Start outperforming now!
How do institutions grade them?
Parsons Corporation Grades
The following table summarizes recent institutional grades for Parsons Corporation:
| Grading Company | Action | New Grade | Date |
|---|---|---|---|
| Barclays | Maintain | Overweight | 2026-01-23 |
| Keybanc | Maintain | Overweight | 2026-01-20 |
| UBS | Maintain | Buy | 2026-01-15 |
| Citigroup | Maintain | Buy | 2026-01-13 |
| B of A Securities | Maintain | Buy | 2025-12-30 |
| Stifel | Maintain | Buy | 2025-12-23 |
| Jefferies | Maintain | Hold | 2025-12-11 |
| TD Cowen | Upgrade | Buy | 2025-12-10 |
| Truist Securities | Maintain | Buy | 2025-12-08 |
| Baird | Maintain | Outperform | 2025-12-08 |
Teledyne Technologies Incorporated Grades
The following table summarizes recent institutional grades for Teledyne Technologies Incorporated:
| Grading Company | Action | New Grade | Date |
|---|---|---|---|
| Barclays | Maintain | Equal Weight | 2026-01-22 |
| Stifel | Maintain | Buy | 2026-01-22 |
| Needham | Maintain | Buy | 2026-01-22 |
| Citigroup | Maintain | Neutral | 2026-01-13 |
| Barclays | Maintain | Equal Weight | 2026-01-12 |
| Barclays | Maintain | Equal Weight | 2025-10-23 |
| Needham | Maintain | Buy | 2025-10-23 |
| Stifel | Maintain | Buy | 2025-10-23 |
| Morgan Stanley | Maintain | Equal Weight | 2025-10-15 |
| UBS | Maintain | Buy | 2025-07-24 |
Which company has the best grades?
Parsons Corporation consistently receives Buy and Overweight ratings, with one Hold, showing stronger institutional confidence. Teledyne Technologies has a mix of Buy and Equal Weight/Neutral grades, indicating more cautious sentiment. Investors may view Parsons as more favored by analysts based on these grades.
Risks specific to each company
The following categories identify the critical pressure points and systemic threats facing both firms in the 2026 market environment:
1. Market & Competition
Parsons Corporation
- Faces intense competition in defense and infrastructure markets with moderate net margin (3.48%) indicating pricing pressure.
Teledyne Technologies Incorporated
- Operates in diverse tech segments with higher net margin (14.63%), but faces competitive pressure in industrial and aerospace sectors.
2. Capital Structure & Debt
Parsons Corporation
- Debt-to-assets at 25.89% is favorable; interest coverage strong at 8.13x, reflecting manageable leverage.
Teledyne Technologies Incorporated
- Lower leverage with debt-to-assets at 16.19% and interest coverage exceptionally strong at 19.47x, signaling robust financial stability.
3. Stock Volatility
Parsons Corporation
- Beta of 0.665 suggests lower volatility than market; price range relatively narrow (54.56-89.5).
Teledyne Technologies Incorporated
- Beta near 1.014 indicates volatility close to market average; wider price range (419-646.64) suggests higher price swings.
4. Regulatory & Legal
Parsons Corporation
- Significant exposure to U.S. defense regulations and international compliance risks in sensitive tech areas.
Teledyne Technologies Incorporated
- Subject to complex aerospace and environmental regulations; exposure to ITAR and export controls in defense electronics.
5. Supply Chain & Operations
Parsons Corporation
- Relies on integrated defense and infrastructure supply chains, vulnerable to geopolitical disruptions.
Teledyne Technologies Incorporated
- Diverse supply chain for advanced electronics and systems; complexity poses operational risk amid global chip shortages.
6. ESG & Climate Transition
Parsons Corporation
- Increasing pressure to align infrastructure projects with sustainability; potential regulatory costs rise.
Teledyne Technologies Incorporated
- Facing investor scrutiny on carbon footprint and environmental compliance in manufacturing and aerospace sectors.
7. Geopolitical Exposure
Parsons Corporation
- Heavy reliance on U.S. government contracts and Middle East operations increases geopolitical risk.
Teledyne Technologies Incorporated
- Global sales expose it to trade tensions and sanctions, especially in defense and aerospace markets.
Which company shows a better risk-adjusted profile?
Parsons’ most impactful risk is its moderate profitability under intense competitive and regulatory pressures in defense and infrastructure. Teledyne’s biggest risk lies in higher stock volatility and supply chain complexity amid global uncertainties. Teledyne’s stronger margins and robust capital structure confer a better risk-adjusted profile. Its Altman Z-score of 4.52 versus Parsons’ 3.33 confirms superior financial safety. However, Teledyne’s broader market exposure demands vigilance.
Final Verdict: Which stock to choose?
Parsons Corporation’s superpower lies in its efficient capital deployment, consistently creating value with a growing ROIC well above its cost of capital. Its point of vigilance is the relatively modest profitability compared to sector leaders, which may challenge investors seeking rapid margin expansion. It suits portfolios aiming for steady, value-creating industrial exposure.
Teledyne Technologies commands a strategic moat through its diversified technology portfolio and recurring revenue streams. It offers greater safety with a stronger current ratio and lower leverage than Parsons, despite a less favorable ROIC versus WACC. Teledyne fits well with investors seeking GARP profiles blending growth and reasonable valuation.
If you prioritize sustainable value creation and capital efficiency, Parsons outshines due to its very favorable moat and consistent improvement in profitability. However, if you seek superior stability with a robust technology moat and stronger balance sheet, Teledyne offers better risk management and resilient earnings growth. Both are slightly favorable choices in their respective strategic niches.
Disclaimer: Investment carries a risk of loss of initial capital. The past performance is not a reliable indicator of future results. Be sure to understand risks before making an investment decision.
Go Further
I encourage you to read the complete analyses of Parsons Corporation and Teledyne Technologies Incorporated to enhance your investment decisions: