In the dynamic world of industrial machinery, two companies stand out for their innovative approaches and market influence: Symbotic Inc. and Parsons Corporation. Symbotic specializes in advanced warehouse automation, enhancing efficiency for retailers and wholesalers, while Parsons offers integrated solutions in defense, intelligence, and critical infrastructure sectors. Both operate in overlapping industrial markets with distinct innovation strategies. This article will help you decide which company presents the most compelling investment opportunity.
Table of contents
Companies Overview
I will begin the comparison between Symbotic Inc. and Parsons Corporation by providing an overview of these two companies and their main differences.
Symbotic Inc. Overview
Symbotic Inc. is an automation technology company focused on enhancing efficiency for retailers and wholesalers in the US through robotics. Its primary offering, The Symbotic System, is a comprehensive warehouse automation solution designed to reduce costs, improve efficiency, and optimize inventory management. The company operates in the industrial machinery sector with a market cap of approximately 42.8B USD and employs around 1,650 people.
Parsons Corporation Overview
Parsons Corporation provides integrated solutions and services in defense, intelligence, and critical infrastructure markets globally. Its operations include cybersecurity, space and geospatial solutions, missile defense, and infrastructure services. Parsons serves government and private clients with a workforce of 20,000 employees, a market cap of about 7.5B USD, and trades on the NYSE under the symbol PSN.
Key similarities and differences
Both Symbotic and Parsons operate within the industrial machinery sector, focusing on technology-driven solutions. Symbotic emphasizes warehouse automation for commercial retail clients, while Parsons specializes in defense, intelligence, and infrastructure services with a broader geographic reach. Parsons has a significantly larger employee base and market cap, reflecting its diversified and international operations compared to Symbotic’s more focused US-centric automation business.
Income Statement Comparison
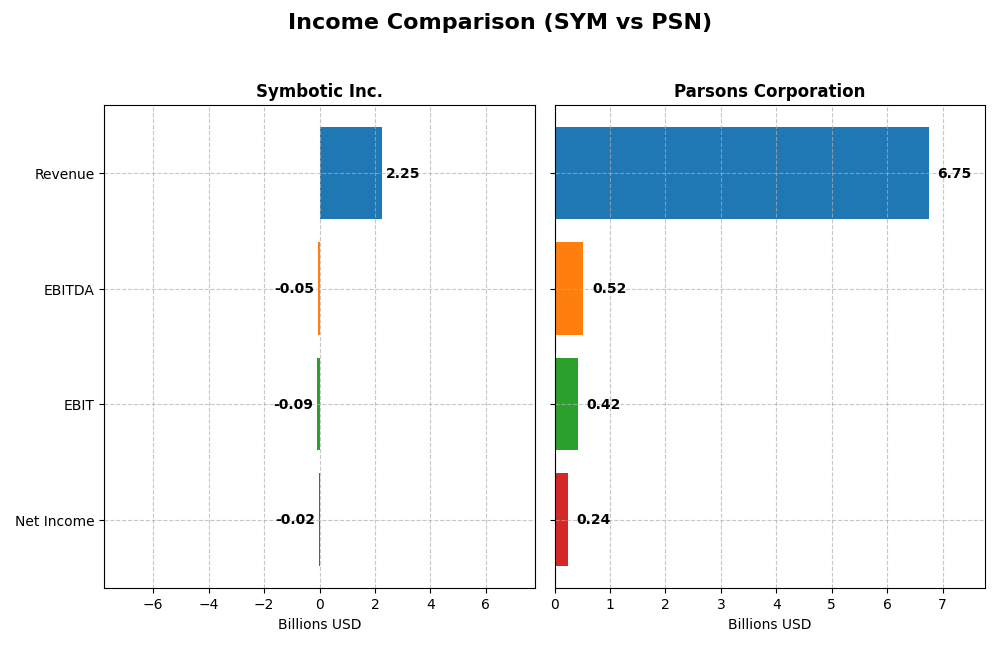
The table below compares the key income statement metrics for Symbotic Inc. and Parsons Corporation for their most recent fiscal years, highlighting their financial performance.
| Metric | Symbotic Inc. (SYM) | Parsons Corporation (PSN) |
|---|---|---|
| Market Cap | 42.8B | 7.5B |
| Revenue | 2.25B | 6.75B |
| EBITDA | -48.0M | 518.5M |
| EBIT | -92.1M | 419.2M |
| Net Income | -16.9M | 237.9M |
| EPS | -0.16 | 2.21 |
| Fiscal Year | 2025 | 2024 |
Income Statement Interpretations
Symbotic Inc.
Symbotic Inc. showed strong revenue growth from 2021 to 2025, rising from 251M to 2.25B USD. Despite this, the company reported persistent net losses, with a slight improvement in net margin but remaining negative at -0.75% in 2025. The gross margin stayed stable near 18.8%, while EBIT margin deteriorated to -4.1%. The latest year saw revenue growth slow to 25.6%, but operating expenses grew proportionally, leading to continued losses.
Parsons Corporation
Parsons Corporation experienced steady revenue growth from 3.66B USD in 2020 to 6.75B USD in 2024. Net income improved consistently, reaching 235M USD with a positive net margin of 3.48%. Gross margin held favorably at 20.8%, with EBIT margin remaining stable around 6.2%. In 2024, Parsons reported a 24% revenue increase and solid margin improvements, supported by efficient cost management and higher EBIT growth of 41.9%.
Which one has the stronger fundamentals?
Parsons Corporation exhibits stronger fundamentals with favorable margins, consistent profitability, and solid revenue and net income growth. Symbotic demonstrates impressive revenue expansion but continues to face challenges in profitability, reflected by negative EBIT and net margins. Parsons’ stable earnings and margin improvements position it with more balanced financial health compared to Symbotic’s ongoing losses despite rapid top-line growth.
Financial Ratios Comparison
The table below presents a side-by-side comparison of key financial ratios for Symbotic Inc. (SYM) and Parsons Corporation (PSN) based on their most recent fiscal year data.
| Ratios | Symbotic Inc. (SYM) 2025 | Parsons Corporation (PSN) 2024 |
|---|---|---|
| ROE | -7.65% | 9.73% |
| ROIC | -16.63% | 8.28% |
| P/E | -334.54 | 41.72 |
| P/B | 25.60 | 4.06 |
| Current Ratio | 1.08 | 1.29 |
| Quick Ratio | 0.99 | 1.29 |
| D/E (Debt-to-Equity) | 0.14 | 0.59 |
| Debt-to-Assets | 1.32% | 25.89% |
| Interest Coverage | 0 | 8.30 |
| Asset Turnover | 0.94 | 1.23 |
| Fixed Asset Turnover | 15.92 | 25.51 |
| Payout ratio | 0 | 0 |
| Dividend yield | 0 | 0 |
Interpretation of the Ratios
Symbotic Inc.
Symbotic shows several unfavorable profitability ratios, including a negative net margin of -0.75% and a return on equity of -7.65%, signaling operational challenges. The company’s price-to-book ratio is very high at 25.6, suggesting overvaluation concerns. Its current and quick ratios are around 1.08 and 0.99, respectively, indicating adequate liquidity. Symbotic does not pay dividends, likely due to ongoing losses and a growth-focused reinvestment strategy.
Parsons Corporation
Parsons presents mixed results with a positive net margin of 3.48% and a return on equity of 9.73%, yet these are still marked unfavorable in context. The company benefits from favorable liquidity and solvency ratios, including a current ratio of 1.29 and an interest coverage ratio of 8.13. Parsons does not distribute dividends, reflecting a possible focus on reinvestment or strategic priorities rather than shareholder payouts.
Which one has the best ratios?
Parsons Corporation has more favorable strengths in liquidity, solvency, and asset turnover ratios than Symbotic, which struggles with profitability and valuation metrics. Parsons’ slightly favorable global ratios compare to Symbotic’s slightly unfavorable stance, indicating Parsons is currently in a more stable financial position based on the provided data.
Strategic Positioning
This section compares the strategic positioning of Symbotic Inc. and Parsons Corporation, focusing on Market position, Key segments, and Exposure to technological disruption:
Symbotic Inc. (SYM)
- Large market cap (~43B), focused on automation technology, faces competitive pressure in industrial machinery.
- Key revenue from Systems automation (2.1B), with growing Software Maintenance and Operation Services segments.
- Exposure to disruption through robotics and warehouse automation technology innovation.
Parsons Corporation (PSN)
- Smaller market cap (~7.5B), operates in defense and critical infrastructure with steady demand.
- Two segments: Federal Solutions (4B) and Critical Infrastructure (2.7B), diversified services.
- Exposure through advanced cybersecurity, space, and integrated defense technologies.
Symbotic Inc. vs Parsons Corporation Positioning
Symbotic is concentrated on warehouse automation technology with high growth in software and services, whereas Parsons is diversified across defense and infrastructure sectors, offering broad integrated solutions with long-standing government contracts.
Which has the best competitive advantage?
Parsons demonstrates a very favorable moat with growing ROIC above WACC, indicating durable competitive advantage, while Symbotic shows a very unfavorable moat with declining ROIC and value destruction.
Stock Comparison
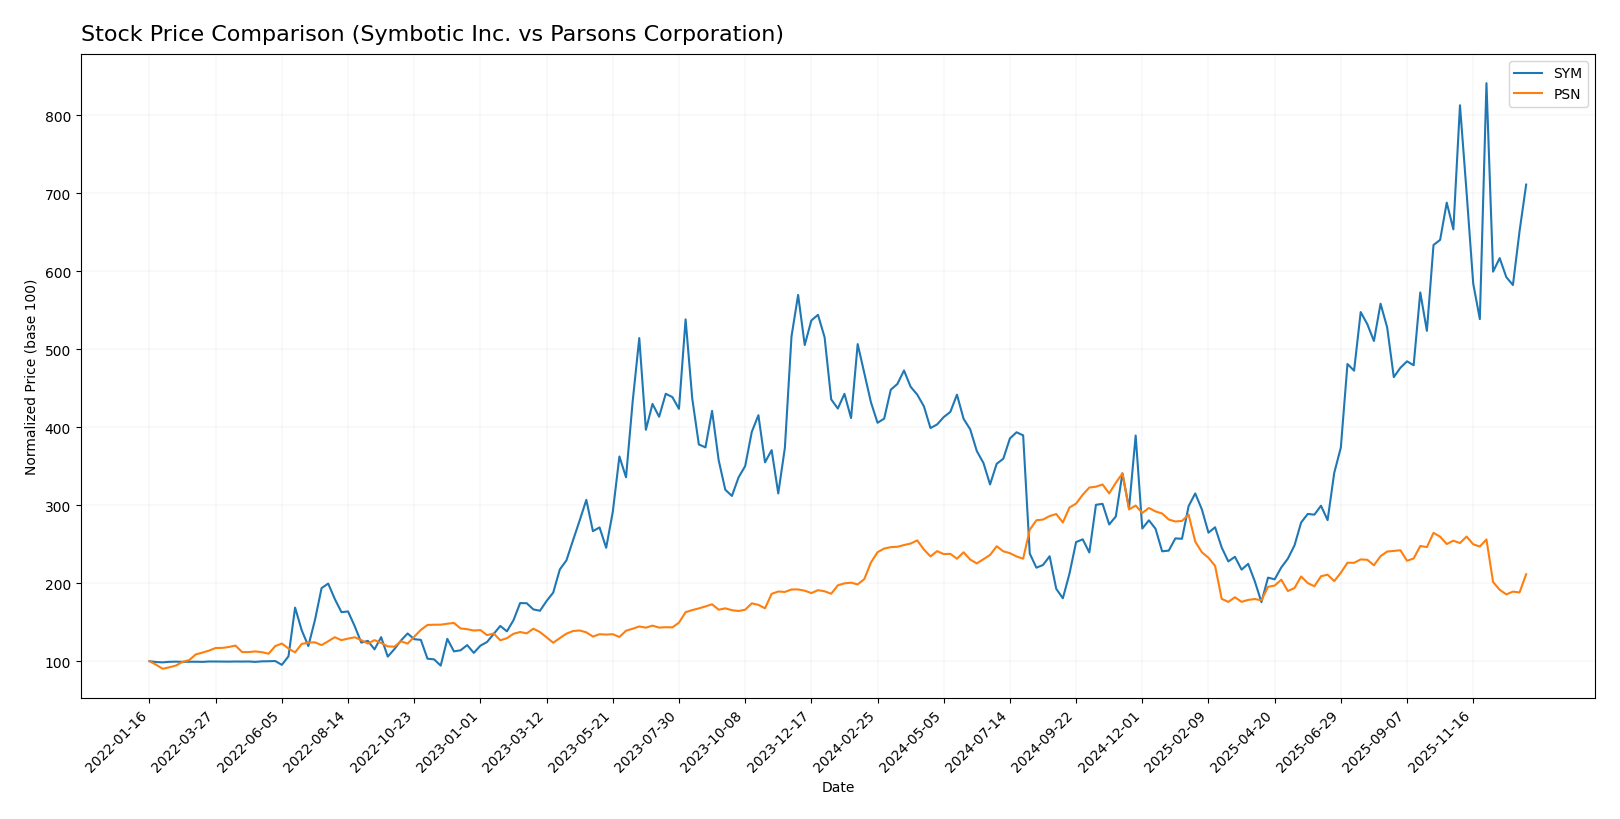
The past year showed divergent stock price dynamics between Symbotic Inc. and Parsons Corporation, with Symbotic exhibiting strong gains despite decelerating momentum, while Parsons faced a steady decline marked by significant recent weakness.
Trend Analysis
Symbotic Inc. (SYM) experienced a bullish trend over the past 12 months with a 64.58% price increase, although the upward momentum has decelerated. The stock traded between a low of 17.5 and a high of 83.77, with notable volatility at a 15.15 standard deviation.
Parsons Corporation (PSN) faced a bearish trend over the same period, declining by 6.64%. The downward trend also decelerated, with prices ranging from 58.22 to 112.69 and a volatility measure of 12.98 standard deviation.
Comparatively, Symbotic delivered the highest market performance with a substantial positive price change, while Parsons showed a negative return and weaker recent price action.
Target Prices
Analysts present a clear target price consensus for Symbotic Inc. and Parsons Corporation.
| Company | Target High | Target Low | Consensus |
|---|---|---|---|
| Symbotic Inc. | 83 | 41 | 65.11 |
| Parsons Corporation | 107 | 70 | 85 |
The target consensus for Symbotic Inc. at 65.11 is slightly below its current price of 70.82, indicating cautious optimism. Parsons Corporation’s consensus target of 85 suggests potential upside from its current price of 69.93, reflecting stronger analyst confidence.
Analyst Opinions Comparison
This section compares analysts’ ratings and grades for Symbotic Inc. (SYM) and Parsons Corporation (PSN):
Rating Comparison
SYM Rating
- Rating: C+, considered very favorable by analysts.
- Discounted Cash Flow Score: 5, indicating very favorable DCF.
- ROE Score: 1, very unfavorable, showing weak equity returns.
- ROA Score: 1, very unfavorable, indicating poor asset use.
- Debt To Equity Score: 3, moderate financial risk.
- Overall Score: 2, moderate overall financial standing.
PSN Rating
- Rating: A-, considered very favorable by analysts.
- Discounted Cash Flow Score: 5, indicating very favorable DCF.
- ROE Score: 4, favorable, reflecting efficient equity use.
- ROA Score: 4, favorable, demonstrating good asset utilization.
- Debt To Equity Score: 2, moderate but lower financial risk.
- Overall Score: 4, favorable overall financial standing.
Which one is the best rated?
Based on the provided data, PSN holds a stronger overall rating (A-) and better financial scores in ROE, ROA, and overall score compared to SYM’s C+. PSN is rated more favorably across key metrics.
Scores Comparison
Here is a comparison of the Altman Z-Score and Piotroski Score for Symbotic Inc. and Parsons Corporation:
SYM Scores
- Altman Z-Score: 13.05, well within the safe zone.
- Piotroski Score: 3, indicating very weak financial strength.
PSN Scores
- Altman Z-Score: 3.59, in the safe zone.
- Piotroski Score: 6, indicating average financial strength.
Which company has the best scores?
Symbotic Inc. has a much higher Altman Z-Score, indicating stronger bankruptcy safety, but Parsons has a better Piotroski Score, reflecting stronger overall financial health.
Grades Comparison
The recent grades from reputable financial institutions for Symbotic Inc. and Parsons Corporation are as follows:
Symbotic Inc. Grades
The table below shows the latest grades assigned by major firms to Symbotic Inc.:
| Grading Company | Action | New Grade | Date |
|---|---|---|---|
| Goldman Sachs | Downgrade | Sell | 2025-12-02 |
| Barclays | Maintain | Underweight | 2025-11-26 |
| Baird | Maintain | Neutral | 2025-11-26 |
| Craig-Hallum | Upgrade | Buy | 2025-11-25 |
| Northland Capital Markets | Maintain | Outperform | 2025-11-25 |
| Needham | Maintain | Buy | 2025-11-25 |
| Cantor Fitzgerald | Maintain | Overweight | 2025-11-25 |
| DA Davidson | Maintain | Neutral | 2025-11-25 |
| Citigroup | Maintain | Buy | 2025-11-25 |
| UBS | Downgrade | Sell | 2025-09-23 |
Overall, Symbotic Inc. shows a mixed trend with several buy and outperform ratings but notable recent downgrades to sell by Goldman Sachs and UBS.
Parsons Corporation Grades
The table below presents the recent grades from prominent analysts for Parsons Corporation:
| Grading Company | Action | New Grade | Date |
|---|---|---|---|
| B of A Securities | Maintain | Buy | 2025-12-30 |
| Stifel | Maintain | Buy | 2025-12-23 |
| Jefferies | Maintain | Hold | 2025-12-11 |
| TD Cowen | Upgrade | Buy | 2025-12-10 |
| Baird | Maintain | Outperform | 2025-12-08 |
| Truist Securities | Maintain | Buy | 2025-12-08 |
| Keybanc | Maintain | Overweight | 2025-12-08 |
| Truist Securities | Maintain | Buy | 2025-12-05 |
| William Blair | Upgrade | Outperform | 2025-11-20 |
| Keybanc | Maintain | Overweight | 2025-10-20 |
Parsons Corporation’s ratings lean strongly positive, with multiple maintained and upgraded buy and outperform recommendations.
Which company has the best grades?
Parsons Corporation has received stronger and more consistent buy and outperform grades compared to Symbotic Inc., which has a more mixed profile including recent sell downgrades. This suggests potentially higher analyst confidence in Parsons’ near-term prospects, possibly impacting investor sentiment and risk assessment.
Strengths and Weaknesses
Below is a comparison of key strengths and weaknesses for Symbotic Inc. (SYM) and Parsons Corporation (PSN) based on their recent financial and operational data.
| Criterion | Symbotic Inc. (SYM) | Parsons Corporation (PSN) |
|---|---|---|
| Diversification | Moderate: Revenues mainly from Systems (2.1B in 2025), with smaller segments in Operation Services and Software Maintenance | High: Two major segments, Critical Infrastructure (2.74B) and Federal Solutions (4.0B) in 2024, showing balanced diversification |
| Profitability | Weak: Negative net margin (-0.75%), negative ROIC (-16.63%), and declining profitability trend | Moderate: Positive net margin (3.48%), positive ROIC (8.28%), with improving profitability and growing ROIC trend |
| Innovation | Limited: No clear data on innovation investment or outcomes; weak financials suggest challenges | Strong: Higher asset turnover (1.23) and fixed asset turnover (25.51) indicate efficient use of assets, supporting innovation and operational efficiency |
| Global presence | Limited information, likely smaller global footprint given revenue concentration | Strong global presence supported by large federal and critical infrastructure contracts in the U.S. and potentially abroad |
| Market Share | Niche market focus in warehouse automation systems; market share likely constrained by competition and profitability issues | Larger market share in engineering and infrastructure services with durable competitive advantage indicated by favorable ROIC vs WACC |
In summary, Parsons Corporation demonstrates a stronger and more stable financial position with diversified revenue streams and a growing competitive advantage. Symbotic Inc. faces challenges with profitability and value creation despite solid revenue growth in systems but requires careful risk management before considering investment.
Risk Analysis
Below is a comparative table of key risks for Symbotic Inc. (SYM) and Parsons Corporation (PSN) based on the most recent available financial and operational data.
| Metric | Symbotic Inc. (SYM) | Parsons Corporation (PSN) |
|---|---|---|
| Market Risk | High beta (2.14) indicates higher volatility and sensitivity to market swings. | Lower beta (0.66) suggests more stability in market fluctuations. |
| Debt level | Low debt-to-equity (0.14), low debt-to-assets (1.32%), favorable leverage. | Moderate debt-to-equity (0.59), but interest coverage strong at 8.13. |
| Regulatory Risk | Moderate, focused on warehouse automation tech; subject to industrial regulations. | High, operates in defense and critical infrastructure sectors with complex compliance and government contracts. |
| Operational Risk | Negative profitability metrics (net margin -0.75%, ROE -7.65%), indicating operational inefficiencies. | Moderate operational risk with positive margins (3.48%) and ROE (9.73%). |
| Environmental Risk | Limited exposure, but industrial machinery may face regulatory scrutiny on sustainability. | Higher, due to involvement in environmental systems and nuclear waste processing. |
| Geopolitical Risk | Low, primarily US-based with domestic clients. | High, international operations in defense and critical infrastructure increase geopolitical exposure. |
Symbotic faces significant market risk due to high volatility and operational challenges with negative profitability and returns. Parsons, while more stable financially and operationally, carries greater regulatory and geopolitical risks due to its defense and critical infrastructure focus. Investors should weigh Symbotic’s growth potential against its financial weaknesses and consider Parsons’ exposure to geopolitical uncertainties despite its stronger financial position.
Which Stock to Choose?
Symbotic Inc. (SYM) shows a strong revenue growth of 792% over five years but suffers from negative profitability indicators, including a -7.65% ROE and -16.63% ROIC, signaling value destruction. Its debt levels are low and favorable, yet the overall financial ratios evaluation is slightly unfavorable, with a very unfavorable moat rating.
Parsons Corporation (PSN) exhibits moderate revenue growth of 72% over five years with positive profitability metrics, including a 9.73% ROE and 8.28% ROIC, suggesting value creation. Its debt ratios are moderate but manageable, and its financial ratios evaluation is slightly favorable, supported by a very favorable moat rating.
Investors seeking growth potential might find Symbotic’s rapid income expansion appealing despite its current profitability challenges, while those prioritizing financial stability and value creation could view Parsons’ consistent returns and favorable moat as more reassuring. The choice could depend on the investor’s risk tolerance and investment strategy.
Disclaimer: Investment carries a risk of loss of initial capital. The past performance is not a reliable indicator of future results. Be sure to understand risks before making an investment decision.
Go Further
I encourage you to read the complete analyses of Symbotic Inc. and Parsons Corporation to enhance your investment decisions: