Home > Comparison > Industrials > ROP vs PSN
The strategic rivalry between Roper Technologies, Inc. and Parsons Corporation shapes the Industrials sector’s competitive landscape. Roper operates as a diversified, technology-driven machinery solutions provider, while Parsons focuses on integrated defense and critical infrastructure services. This analysis pits Roper’s industrial innovation against Parsons’ specialized government contracting. I will evaluate which company presents a superior risk-adjusted opportunity for portfolios seeking exposure to complex industrial markets.
Table of contents
Companies Overview
Roper Technologies and Parsons Corporation both hold critical roles in the industrial machinery sector, shaping infrastructure and defense technology markets.
Roper Technologies, Inc.: Diverse Industrial Software and Equipment Leader
Roper Technologies dominates with a broad portfolio of software and engineered products spanning healthcare, transportation, and financial analytics. Its revenue engine centers on cloud-based solutions and precision instruments. In 2026, Roper’s strategic focus remains on expanding software-as-a-service offerings and advancing data analytics capabilities across multiple industries.
Parsons Corporation: Defense and Infrastructure Integration Specialist
Parsons Corporation excels as an integrated solutions provider for defense and critical infrastructure, offering cyber security, geospatial intelligence, and transportation system management. The company generates revenue mainly through government contracts and infrastructure projects. Its 2026 strategy emphasizes enhancing cyber defense platforms and expanding intelligent transportation systems globally.
Strategic Collision: Similarities & Divergences
Both companies operate in industrial machinery but diverge sharply: Roper leans on a software-driven diversified model, while Parsons prioritizes government and infrastructure contracts with a defense focus. Their primary battleground lies in technology integration for critical infrastructure. Investors face distinct profiles—Roper’s innovation-driven growth contrasts with Parsons’ steady government-backed revenue streams.
Income Statement Comparison
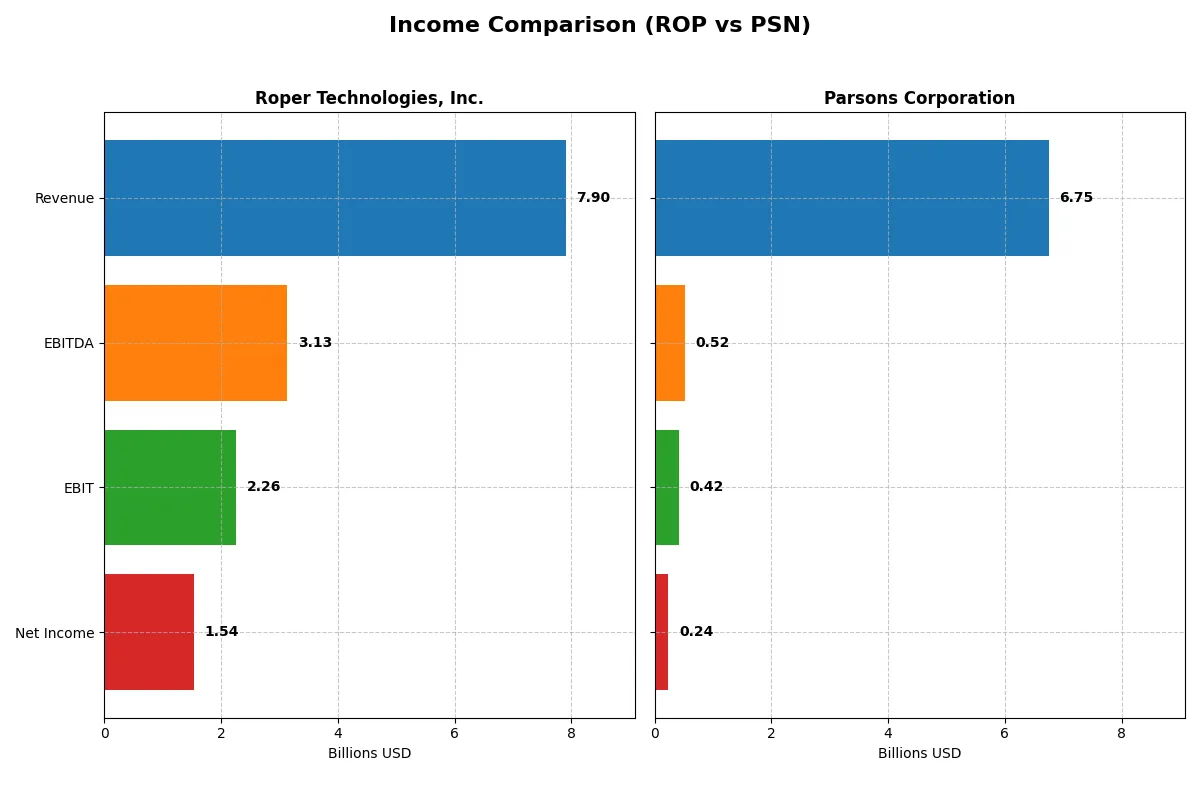
This data dissects the core profitability and scalability of both corporate engines to reveal who dominates the bottom line:
| Metric | Roper Technologies, Inc. (ROP) | Parsons Corporation (PSN) |
|---|---|---|
| Revenue | 7.90B | 6.75B |
| Cost of Revenue | 2.43B | 5.34B |
| Operating Expenses | 3.24B | 978M |
| Gross Profit | 5.47B | 1.41B |
| EBITDA | 3.13B | 518M |
| EBIT | 2.26B | 419M |
| Interest Expense | 325M | 52M |
| Net Income | 1.54B | 237.99M |
| EPS | 14.31 | 2.21 |
| Fiscal Year | 2025 | 2024 |
Income Statement Analysis: The Bottom-Line Duel
The following income statement comparison reveals the true efficiency of each company’s corporate engine through their revenue growth and profitability margins.
Roper Technologies, Inc. Analysis
Roper Technologies shows consistent revenue growth, reaching $7.9B in 2025, up 12% year-over-year. Net income remains robust at $1.54B, though it slipped slightly compared to 2024. Margins impress with a 69% gross margin and a 19.4% net margin, reflecting strong operational efficiency despite a modest net margin decline.
Parsons Corporation Analysis
Parsons delivers aggressive top-line expansion, with revenue surging 24% to $6.75B in 2024. Net income jumped 46% to $237M, supported by solid margin improvements. Parsons posts a 21% gross margin and a modest 3.5% net margin, showing improving profitability momentum but still lagging Roper’s margin scale significantly.
Margin Dominance vs. Growth Momentum
Roper dominates with superior margins and stable profitability, generating nearly five times the net income of Parsons. Parsons excels in high growth and margin expansion but remains a smaller, less profitable operation. Investors seeking margin strength and reliability may favor Roper, while those prioritizing growth might watch Parsons’s accelerating momentum.
Financial Ratios Comparison
These vital ratios act as a diagnostic tool to expose the underlying fiscal health, valuation premiums, and capital efficiency of the companies compared here:
| Ratios | Roper Technologies, Inc. (ROP) | Parsons Corporation (PSN) |
|---|---|---|
| ROE | 7.7% | 9.7% |
| ROIC | 5.6% | 8.3% |
| P/E | 31.1 | 41.7 |
| P/B | 2.4 | 4.1 |
| Current Ratio | 0.52 | 1.29 |
| Quick Ratio | 0.48 | 1.29 |
| D/E | 0.47 | 0.59 |
| Debt-to-Assets | 27.0% | 25.9% |
| Interest Coverage | 6.9 | 8.3 |
| Asset Turnover | 0.23 | 1.23 |
| Fixed Asset Turnover | 50.4 | 25.5 |
| Payout ratio | 23.1% | 0% |
| Dividend yield | 0.74% | 0% |
| Fiscal Year | 2025 | 2024 |
Efficiency & Valuation Duel: The Vital Signs
Financial ratios act as a company’s DNA, revealing hidden risks and operational excellence behind headline numbers.
Roper Technologies, Inc.
Roper’s ROE is low at 7.73%, signaling modest profitability despite a strong net margin of 19.44%. Its P/E ratio of 31.06 suggests the stock trades at a premium, possibly stretched. Dividend yield is low at 0.74%, indicating limited shareholder payouts and a likely focus on internal reinvestment.
Parsons Corporation
Parsons shows a higher ROE of 9.73% but a weak net margin of 3.48%, reflecting less operational efficiency. The stock appears expensive with a P/E of 41.72 and a high P/B of 4.06. It pays no dividends, implying reinvestment into growth initiatives instead of shareholder returns.
Premium Valuation vs. Operational Safety
Roper balances solid margins with moderate returns but faces valuation risks. Parsons offers higher returns on equity but weaker margins and a pricier valuation. Investors seeking operational safety may lean toward Roper, while those prioritizing growth could consider Parsons’ profile.
Which one offers the Superior Shareholder Reward?
I compare Roper Technologies (ROP) and Parsons Corporation (PSN) on their shareholder reward models. ROP pays a steady dividend with a yield near 0.74% and maintains a moderate payout ratio around 23%. Its free cash flow comfortably covers dividends and capex, reflecting strong cash generation. ROP also runs a significant buyback program, enhancing total shareholder return sustainably. PSN, by contrast, pays no dividends. It reinvests free cash flow into growth, supported by positive free cash flow per share (~4.5) and solid operating margins, but buybacks are less emphasized. Given ROP’s consistent dividend, robust buybacks, and cash flow strength, I find Roper offers a more attractive and sustainable total return profile in 2026.
Comparative Score Analysis: The Strategic Profile
The radar chart reveals the fundamental DNA and trade-offs of Roper Technologies and Parsons Corporation, highlighting their financial strengths and vulnerabilities:
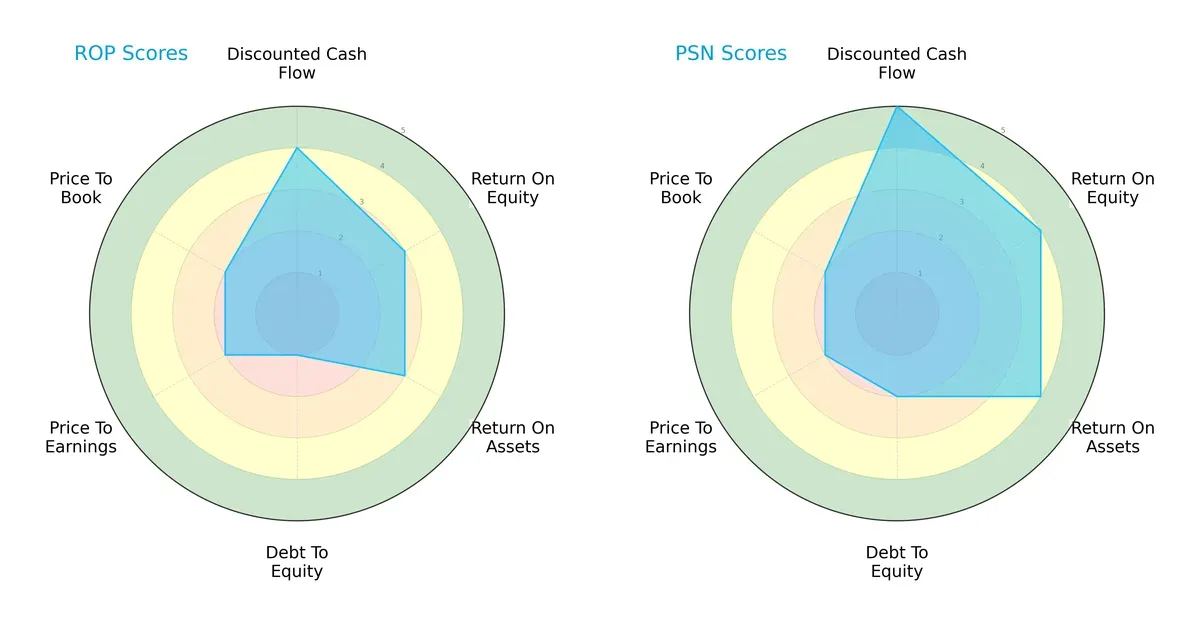
Parsons leads with superior DCF (5 vs. 4), ROE (4 vs. 3), and ROA (4 vs. 3) scores, reflecting stronger profitability and asset efficiency. Roper’s weakness surfaces in Debt/Equity (1 vs. 2), signaling higher leverage risk. Both share moderate valuation scores (PE/PB at 2), but Parsons presents a more balanced, quality-driven profile, while Roper leans on cash flow strength despite its leverage concerns.
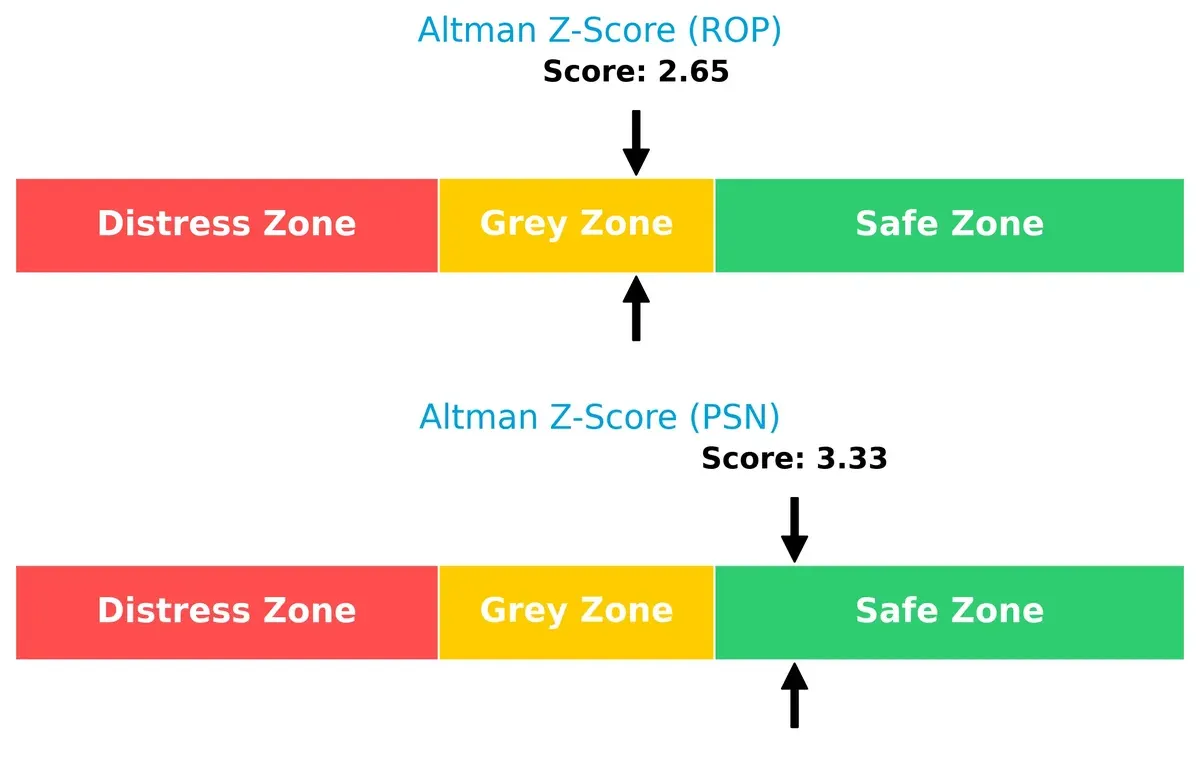
Bankruptcy Risk: Solvency Showdown
Parsons’ Altman Z-Score of 3.33 places it clearly in the safe zone, while Roper’s 2.65 sits in the grey zone, indicating moderate bankruptcy risk in this cycle:
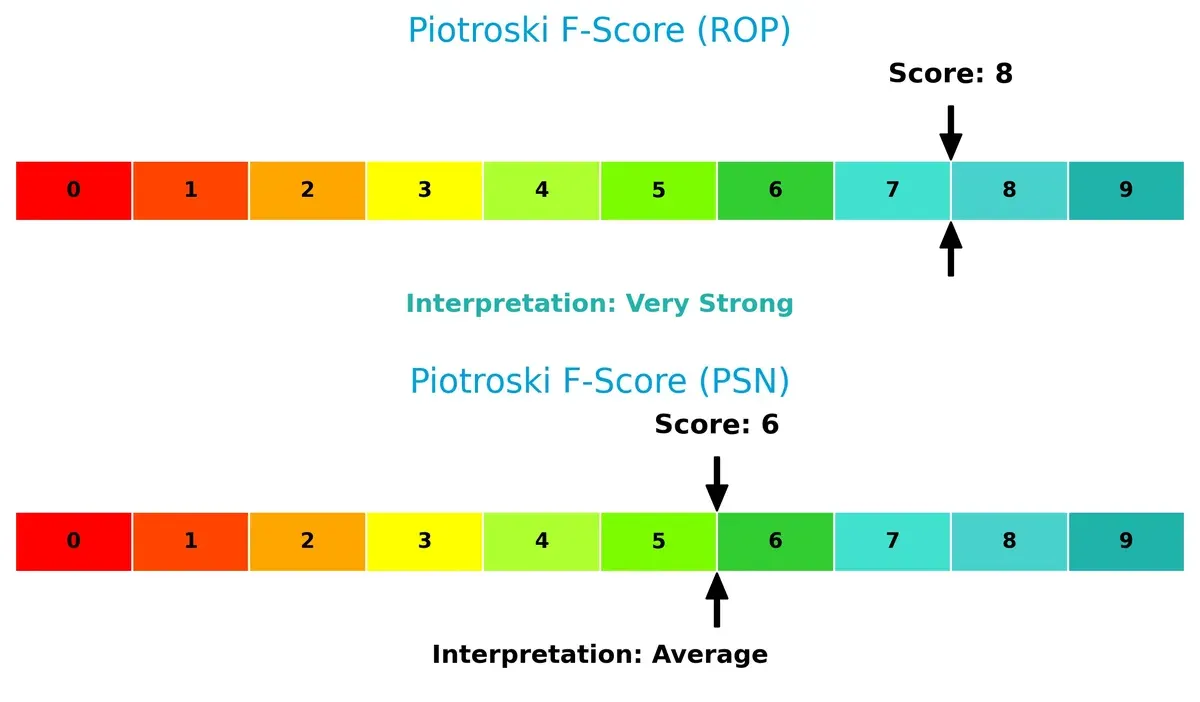
Financial Health: Quality of Operations
Roper’s Piotroski F-Score of 8 signals very strong financial health, outperforming Parsons’ average score of 6; this suggests Roper maintains superior internal operational quality and fewer red flags:
How are the two companies positioned?
This section dissects ROP and PSN’s operational DNA by comparing their revenue distribution and internal strengths and weaknesses. The goal is to confront their economic moats to reveal which business model offers the most resilient, sustainable competitive advantage today.
Revenue Segmentation: The Strategic Mix
This comparison dissects how Roper Technologies and Parsons Corporation diversify income streams and where their primary sector bets lie:
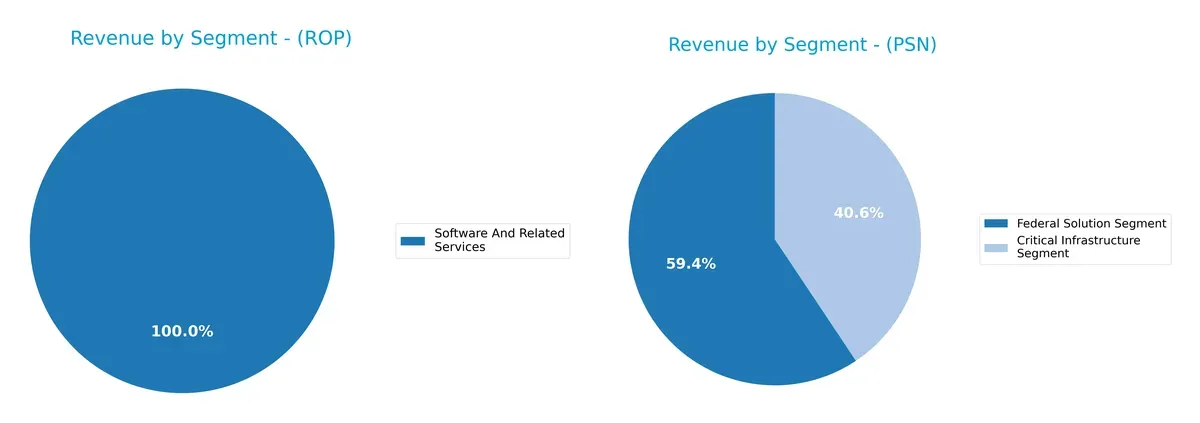
Roper dominates with a heavily software-driven portfolio, reporting $10.7B in Software and Related Services in 2024. Parsons splits $6.8B between Critical Infrastructure ($2.7B) and Federal Solutions ($4.0B), showing a more balanced mix. Roper’s focus anchors on technology innovation, creating ecosystem lock-in. Parsons’ split indicates infrastructure dominance but also exposes it to government spending cycles, a clear concentration risk.
Strengths and Weaknesses Comparison
This table compares the Strengths and Weaknesses of Roper Technologies, Inc. and Parsons Corporation:
ROP Strengths
- Diversified software segments including Application Software and Network Systems
- Favorable net margin at 19.44%
- Strong fixed asset turnover at 50.37
- Low debt-to-assets ratio at 26.9%
- Solid interest coverage at 6.96x
- Large U.S. revenue base of $6B+
PSN Strengths
- Favorable asset turnover at 1.23 and fixed asset turnover at 25.51
- Favorable interest coverage at 8.13x
- Quick ratio of 1.29 indicates good liquidity
- Favorable WACC at 6.24%
- Significant North America revenue of $5.7B
- Presence in Middle East with $1B revenue
ROP Weaknesses
- Low current ratio at 0.52 and quick ratio at 0.48 signals liquidity concerns
- Unfavorable ROE at 7.73% below WACC
- Unfavorable PE of 31.06 indicates expensive valuation
- Low asset turnover at 0.23 suggests less efficient asset use
- Low dividend yield at 0.74%
- Limited geographic diversification outside U.S.
PSN Weaknesses
- Low net margin at 3.48%
- Unfavorable ROE at 9.73% below WACC
- High PE of 41.72 and PB of 4.06 indicate premium valuation
- No dividend yield
- Moderate debt-to-equity at 0.59 and neutral leverage
- Revenue heavily concentrated in North America
Both companies show strengths in capital efficiency and interest coverage, but differ in liquidity and profitability profiles. Roper’s concentration in software and U.S. markets contrasts with Parsons’ infrastructure focus and Middle East presence, shaping distinct strategic priorities.
The Moat Duel: Analyzing Competitive Defensibility
A structural moat protects long-term profits from relentless competition and market shifts. Only durable competitive advantages secure lasting value creation:
Roper Technologies, Inc.: Diversified Product Intangibles
Roper’s moat stems from intangible assets and niche software solutions, evident in its stable 28.6% EBIT margin. However, ROIC trails WACC, signaling value erosion despite improving profitability. Expansion into cloud analytics may deepen its moat by 2026.
Parsons Corporation: Defense and Critical Infrastructure Expertise
Parsons leverages specialized defense contracts and cybersecurity platforms, creating high entry barriers unlike Roper’s product diversity. Its ROIC exceeds WACC by 2%, with strong margin and EPS growth indicating robust value creation. New geospatial and missile defense projects could further fortify its moat.
Specialized Expertise vs. Intangible Asset Breadth
Parsons commands a deeper, more sustainable moat due to superior ROIC and focused government contracts. Roper’s moat is broader but less defensible, facing margin pressure. Parsons is better positioned to protect market share amid competitive pressures.
Which stock offers better returns?
The past year reveals significant declines in both stocks, with distinct trading volumes and decelerating downtrends shaping their price dynamics.
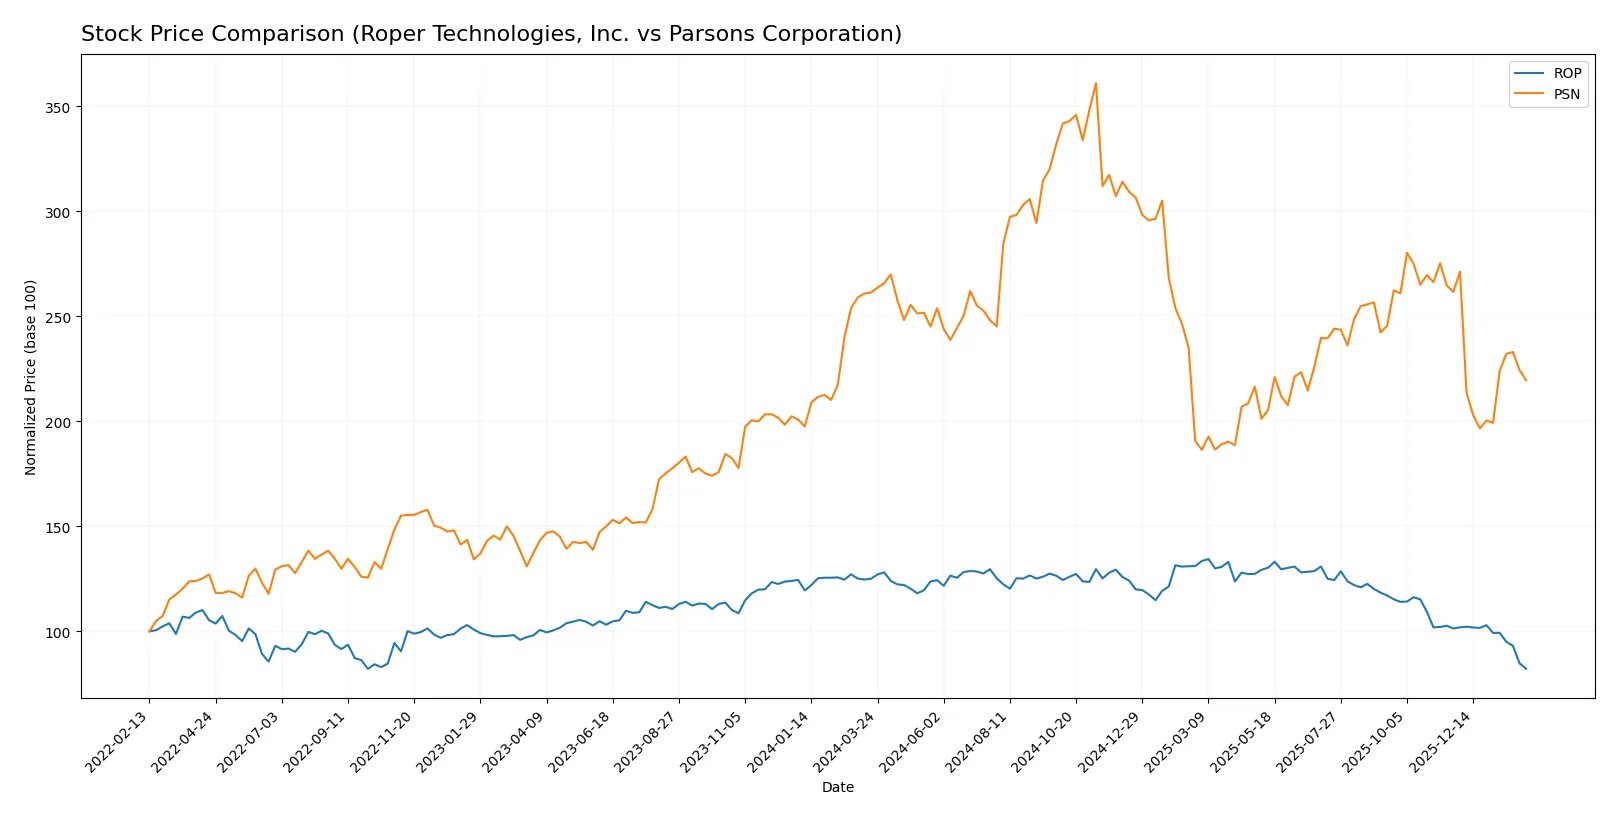
Trend Comparison
Roper Technologies, Inc. (ROP) shows a bearish trend with a -34.28% price drop over 12 months, marked by deceleration and high volatility. The stock’s highest price reached 588.38, while the lowest fell to 359.71.
Parsons Corporation (PSN) also experiences a bearish trend, declining -15.99% over the same period. The trend decelerates with lower volatility, hitting a high of 112.69 and a low of 58.22.
ROP’s steeper decline and higher volatility contrast with PSN’s milder loss. PSN delivered the higher market performance, although both stocks underperformed significantly.
Target Prices
Analysts show a constructive outlook with solid target price consensus for both Roper Technologies and Parsons Corporation.
| Company | Target Low | Target High | Consensus |
|---|---|---|---|
| Roper Technologies, Inc. | 365 | 575 | 475.5 |
| Parsons Corporation | 78 | 104 | 86.8 |
Roper’s consensus target exceeds its current price by over 30%, signaling strong growth expectations. Parsons also shows upside potential, with targets roughly 27% above today’s price.

Don’t Let Luck Decide Your Entry Point
Optimize your entry points with our advanced ProRealTime indicators. You’ll get efficient buy signals with precise price targets for maximum performance. Start outperforming now!
How do institutions grade them?
Roper Technologies, Inc. Grades
The following table summarizes recent institutional grades for Roper Technologies, Inc.:
| Grading Company | Action | New Grade | Date |
|---|---|---|---|
| Goldman Sachs | Maintain | Neutral | 2026-01-29 |
| Argus Research | Downgrade | Hold | 2026-01-28 |
| Mizuho | Maintain | Underperform | 2026-01-28 |
| RBC Capital | Maintain | Sector Perform | 2026-01-28 |
| Stifel | Downgrade | Hold | 2026-01-28 |
| Citigroup | Maintain | Buy | 2026-01-28 |
| JP Morgan | Maintain | Underweight | 2026-01-28 |
| Truist Securities | Maintain | Buy | 2026-01-28 |
| Barclays | Maintain | Underweight | 2026-01-28 |
| Oppenheimer | Downgrade | Perform | 2026-01-28 |
Parsons Corporation Grades
The following table summarizes recent institutional grades for Parsons Corporation:
| Grading Company | Action | New Grade | Date |
|---|---|---|---|
| Barclays | Maintain | Overweight | 2026-01-23 |
| Keybanc | Maintain | Overweight | 2026-01-20 |
| UBS | Maintain | Buy | 2026-01-15 |
| Citigroup | Maintain | Buy | 2026-01-13 |
| B of A Securities | Maintain | Buy | 2025-12-30 |
| Stifel | Maintain | Buy | 2025-12-23 |
| Jefferies | Maintain | Hold | 2025-12-11 |
| TD Cowen | Upgrade | Buy | 2025-12-10 |
| Truist Securities | Maintain | Buy | 2025-12-08 |
| Baird | Maintain | Outperform | 2025-12-08 |
Which company has the best grades?
Parsons Corporation consistently holds stronger grades, with multiple “Buy,” “Overweight,” and “Outperform” ratings. Roper Technologies shows more neutral to negative ratings, signaling greater caution for investors.
Risks specific to each company
In the 2026 market environment, these categories highlight the critical pressure points and systemic threats facing both Roper Technologies, Inc. and Parsons Corporation:
1. Market & Competition
Roper Technologies, Inc.
- Faces intense competition in industrial software and engineered products, requiring continuous innovation to maintain its diversified moat.
Parsons Corporation
- Operates in defense and critical infrastructure with high barriers but depends heavily on government contracts and geopolitical tensions.
2. Capital Structure & Debt
Roper Technologies, Inc.
- Maintains a favorable debt-to-assets ratio (26.9%) and strong interest coverage (6.96), but low current and quick ratios (0.52/0.48) signal liquidity risk.
Parsons Corporation
- Has a slightly higher debt-to-assets ratio (25.9%) with solid interest coverage (8.13) and better liquidity (current and quick ratios at 1.29), indicating moderate leverage risk.
3. Stock Volatility
Roper Technologies, Inc.
- Beta near 0.93 suggests moderate market sensitivity; price range volatility is significant (344-595), raising concerns about valuation swings.
Parsons Corporation
- Lower beta at 0.665 implies less volatility, with a narrower price range (54.56-89.5), reflecting steadier market sentiment.
4. Regulatory & Legal
Roper Technologies, Inc.
- Exposed to regulatory scrutiny in healthcare, software, and environmental sectors, requiring strict compliance and risk mitigation.
Parsons Corporation
- Faces complex regulatory environments in defense contracting and critical infrastructure, with risks from shifting government policies and export controls.
5. Supply Chain & Operations
Roper Technologies, Inc.
- Complex global supply chains for precision instruments and software may be vulnerable to disruptions and cost inflation.
Parsons Corporation
- Operations depend on specialized technology suppliers and geopolitical stability, especially for defense-related components.
6. ESG & Climate Transition
Roper Technologies, Inc.
- Increasing pressure to enhance sustainability in manufacturing processes and software solutions amid rising ESG investor demands.
Parsons Corporation
- Must align defense and infrastructure projects with evolving ESG standards, facing reputational and compliance risks.
7. Geopolitical Exposure
Roper Technologies, Inc.
- Primarily US-focused with moderate international exposure; geopolitical risks are limited but emerging in supply chain links.
Parsons Corporation
- High exposure to Middle East and international defense contracts increases sensitivity to geopolitical instability and policy shifts.
Which company shows a better risk-adjusted profile?
Roper Technologies’ most impactful risk lies in its weak liquidity ratios, which could strain operational flexibility amid rising costs. Parsons’ greatest risk stems from geopolitical exposure inherent in its defense segment. Parsons shows a slightly better risk-adjusted profile, supported by stronger liquidity and Altman Z-Score in the safe zone, versus Roper’s grey zone. This recent liquidity weakness at Roper justifies cautious allocation despite its diversified industrial moat.
Final Verdict: Which stock to choose?
Roper Technologies excels as a cash-generating powerhouse with strong operational margins and a growing profitability trend. Its Achilles’ heel lies in liquidity constraints, reflected by a low current ratio, which demands careful monitoring. This stock suits investors seeking aggressive growth with a tolerance for financial structure risks.
Parsons Corporation’s strategic moat is its efficient capital use, consistently delivering returns above its cost of capital—a hallmark of sustainable value creation. It offers a safer profile than Roper, supported by healthier liquidity and lower volatility. Parsons fits well in portfolios targeting growth at a reasonable price with a focus on stability.
If you prioritize robust cash flow and operational efficiency for growth, Roper outshines due to its margin strength and reinvestment potential. However, if your strategy demands capital preservation and a proven competitive advantage, Parsons offers better stability and long-term value creation. Both present compelling but distinct analytical scenarios depending on your risk appetite and investment horizon.
Disclaimer: Investment carries a risk of loss of initial capital. The past performance is not a reliable indicator of future results. Be sure to understand risks before making an investment decision.
Go Further
I encourage you to read the complete analyses of Roper Technologies, Inc. and Parsons Corporation to enhance your investment decisions: