Rockwell Automation, Inc. and Parsons Corporation are two prominent players in the industrial machinery sector, each with distinct yet overlapping markets. Rockwell focuses on automation and digital transformation, while Parsons excels in defense and critical infrastructure solutions. Both companies emphasize innovation to stay competitive. This article will analyze their strengths and risks to help you decide which stock deserves a place in your investment portfolio.

Table of contents
Companies Overview
I will begin the comparison between Rockwell Automation, Inc. and Parsons Corporation by providing an overview of these two companies and their main differences.
Rockwell Automation Overview
Rockwell Automation, Inc. specializes in industrial automation and digital transformation solutions globally. The company operates through three segments: Intelligent Devices, Software & Control, and Lifecycle Services, offering hardware, software, and consulting services. It serves diverse markets including automotive, semiconductor, logistics, and process industries. Founded in 1903 and based in Milwaukee, Wisconsin, Rockwell Automation is a leader in industrial machinery with a market cap of approximately 46B USD.
Parsons Corporation Overview
Parsons Corporation provides integrated solutions primarily in defense, intelligence, and critical infrastructure sectors across North America, the Middle East, and globally. It operates through Federal Solutions and Critical Infrastructure segments, offering cybersecurity, space, missile defense, transportation management, and environmental services. Established in 1944 and headquartered in Centreville, Virginia, Parsons has a market cap near 7.5B USD and focuses on technology-driven infrastructure projects and government contracts.
Key similarities and differences
Both companies operate in the industrial sector but target different markets and applications. Rockwell Automation focuses on automation hardware, software, and lifecycle services across multiple discrete and process industries. Parsons emphasizes defense and critical infrastructure solutions, including cybersecurity and space systems. While Rockwell Automation has a broader industrial machinery scope with a higher market cap and employee count, Parsons is more specialized in government and infrastructure services with a lower beta, indicating potentially less stock volatility.
Income Statement Comparison
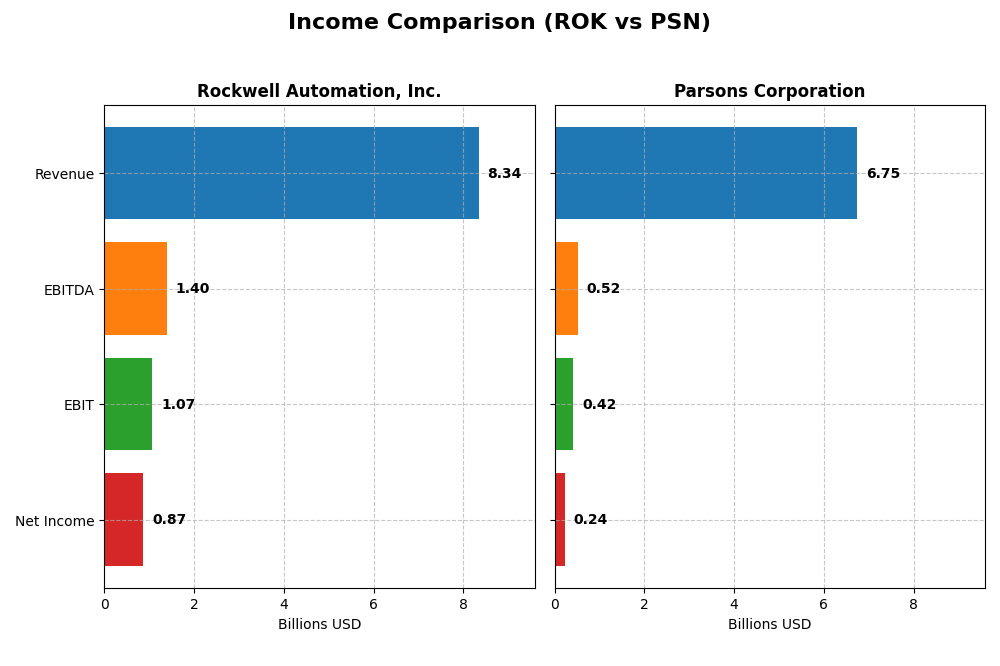
Below is a side-by-side comparison of the most recent fiscal year income statements for Rockwell Automation, Inc. and Parsons Corporation, highlighting key financial metrics.
| Metric | Rockwell Automation, Inc. | Parsons Corporation |
|---|---|---|
| Market Cap | 46.1B | 7.5B |
| Revenue | 8.34B | 6.75B |
| EBITDA | 1.40B | 518M |
| EBIT | 1.07B | 419M |
| Net Income | 869M | 235M |
| EPS | 7.69 | 2.21 |
| Fiscal Year | 2025 | 2024 |
Income Statement Interpretations
Rockwell Automation, Inc.
Rockwell Automation showed a modest revenue increase of 0.97% in 2025, offset by a 14.17% decline in EBIT and a 9.64% decrease in net margin, reflecting margin compression despite a favorable gross margin of 48.14%. Net income fell by 36.01% over five years, with EPS also declining. The latest year featured a slight revenue rise but weaker profitability metrics.
Parsons Corporation
Parsons experienced robust revenue growth of 24.03% in 2024 and a 41.85% increase in EBIT, with net margin improving by 17.6%. Over the longer term, revenue climbed by 72.25% and net income surged by 138.53%, supported by a stable gross margin of 20.83%. EPS growth was strong, rising 49.3% in the last year and 118.56% overall, indicating improving operational efficiency.
Which one has the stronger fundamentals?
Parsons Corporation demonstrates stronger fundamentals with consistent revenue and net income growth, margin expansion, and positive EPS trends. Rockwell Automation, despite solid gross margins and favorable interest expense, shows declining profitability and margin pressure. Overall, Parsons’ income statement reflects a more favorable growth and margin profile compared to Rockwell Automation’s mixed results.
Financial Ratios Comparison
The table below presents the latest available financial ratios for Rockwell Automation, Inc. and Parsons Corporation, offering a direct comparison of their key performance and financial health metrics as of fiscal year 2024-2025.
| Ratios | Rockwell Automation, Inc. (ROK) | Parsons Corporation (PSN) |
|---|---|---|
| ROE | 23.78% (2025) | 9.73% (2024) |
| ROIC | 13.71% (2025) | 8.28% (2024) |
| P/E | 45.33 (2025) | 41.72 (2024) |
| P/B | 10.78 (2025) | 4.06 (2024) |
| Current Ratio | 1.14 (2025) | 1.29 (2024) |
| Quick Ratio | 0.77 (2025) | 1.29 (2024) |
| D/E (Debt-to-Equity) | 1.00 (2025) | 0.59 (2024) |
| Debt-to-Assets | 32.5% (2025) | 25.9% (2024) |
| Interest Coverage | 9.12 (2025) | 8.30 (2024) |
| Asset Turnover | 0.74 (2025) | 1.23 (2024) |
| Fixed Asset Turnover | 6.95 (2025) | 25.51 (2024) |
| Payout Ratio | 68.0% (2025) | 0% (2024) |
| Dividend Yield | 1.50% (2025) | 0% (2024) |
Interpretation of the Ratios
Rockwell Automation, Inc.
Rockwell Automation’s financial ratios present a generally strong profile with favorable net margin (10.42%), ROE (23.78%), and ROIC (13.71%), though challenged by high PE (45.33) and PB (10.78) ratios. Liquidity is mixed, with a neutral current ratio (1.14) but unfavorable quick ratio (0.77). The company pays dividends, yielding 1.5%, with a payout supported by free cash flow but warranting caution due to some valuation concerns.
Parsons Corporation
Parsons shows weaker profitability with a net margin of 3.48% and ROE at 9.73%, both unfavorable, while ROIC is neutral at 8.28%. The firm benefits from a low WACC (6.17%) and strong liquidity ratios, including a quick ratio of 1.29. Parsons does not pay dividends, reflecting a possible reinvestment strategy or growth phase, with free cash flow fluctuating and no share buybacks reported.
Which one has the best ratios?
Both companies have a slightly favorable global ratios opinion, but Rockwell Automation scores better on profitability and return metrics, while Parsons excels in liquidity and cost of capital. Rockwell’s valuation multiples and liquidity ratios present concerns, whereas Parsons’ lower profitability and absence of dividends highlight different trade-offs. The best ratios depend on the investor’s focus on returns versus stability.
Strategic Positioning
This section compares the strategic positioning of Rockwell Automation and Parsons Corporation, including Market position, Key segments, and Exposure to technological disruption:
Rockwell Automation, Inc.
- Leading industrial automation player facing moderate competitive pressure in machinery sector.
- Diverse segments: Intelligent Devices, Software & Control, Lifecycle Services driving revenues.
- Adopts digital transformation solutions including software, hardware, and lifecycle services.
Parsons Corporation
- Mid-sized defense and infrastructure firm with lower beta, moderate competition.
- Two main segments: Federal Solutions and Critical Infrastructure with specialized services.
- Provides cybersecurity, geospatial, missile defense, and critical infrastructure services.
Rockwell Automation, Inc. vs Parsons Corporation Positioning
Rockwell Automation shows a diversified industrial automation approach across multiple segments, while Parsons is more concentrated in defense and infrastructure solutions. Rockwell has broader end markets; Parsons focuses on government and critical infrastructure, reflecting different strategic scopes.
Which has the best competitive advantage?
Both companies demonstrate a very favorable economic moat with growing ROIC above WACC, indicating durable competitive advantages and efficient capital use, with Rockwell slightly higher in ROIC spread but Parsons also showing strong profitability trends.
Stock Comparison
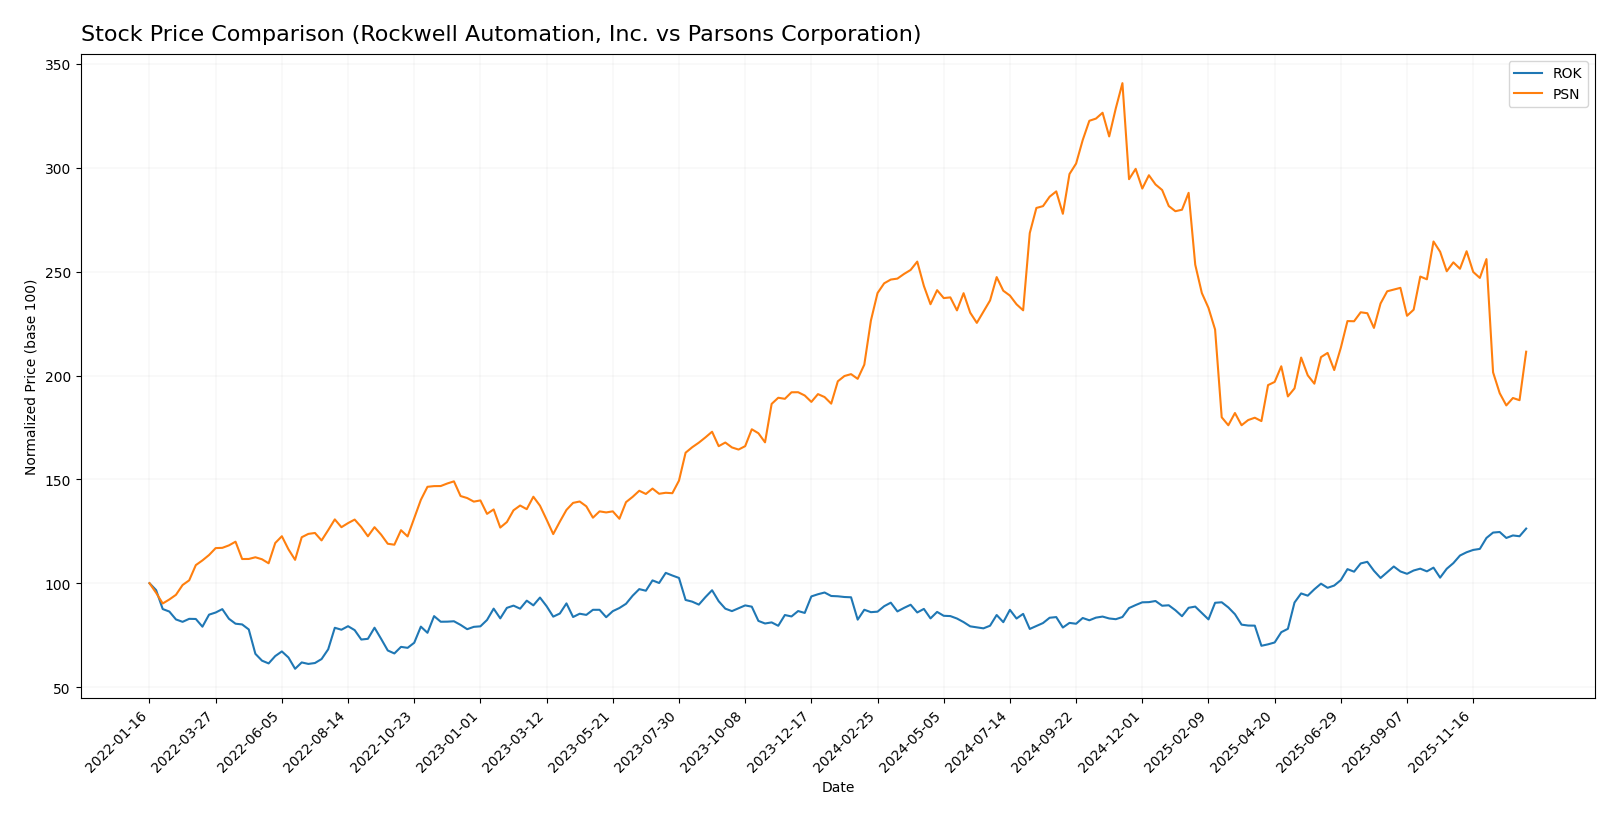
The stock price movements over the past 12 months reveal a strong bullish trend for Rockwell Automation, Inc. (ROK) with accelerating gains, contrasted by a decelerating bearish trend for Parsons Corporation (PSN).
Trend Analysis
Rockwell Automation, Inc. (ROK) exhibited a 46.76% price increase over the past year, signaling a bullish trend with acceleration. The stock ranged from a low of 227.11 to a high of 410.53, reflecting notable volatility with a standard deviation of 44.57.
Parsons Corporation (PSN) recorded a -6.64% price decline over the same period, indicating a bearish trend with deceleration. The stock’s price fluctuated between 58.22 and 112.69, with a lower volatility level at a 12.98 standard deviation.
Comparing both stocks, Rockwell Automation delivered the highest market performance with a significant bullish trend, whereas Parsons showed a declining bearish trend over the past year.
Target Prices
The current consensus from verified analysts presents a balanced outlook for both Rockwell Automation, Inc. and Parsons Corporation.
| Company | Target High | Target Low | Consensus |
|---|---|---|---|
| Rockwell Automation, Inc. | 470 | 380 | 421.57 |
| Parsons Corporation | 107 | 70 | 85 |
Analysts expect Rockwell Automation’s price to rise modestly above its current 410.53 USD, while Parsons Corporation shows potential upside from its 69.93 USD current price, reflecting moderate growth expectations.
Analyst Opinions Comparison
This section compares analysts’ ratings and grades for Rockwell Automation, Inc. (ROK) and Parsons Corporation (PSN):
Rating Comparison
ROK Rating
- Rating: B-, considered very favorable overall by analysts.
- Discounted Cash Flow Score: Moderate score of 3, indicating average valuation.
- ROE Score: Very favorable 5, showing high efficiency in generating equity returns.
- ROA Score: Favorable 4, reflecting effective use of assets.
- Debt To Equity Score: Very unfavorable 1, indicating higher financial risk.
- Overall Score: Moderate 3, reflecting average overall financial health.
PSN Rating
- Rating: A-, also considered very favorable overall by analysts.
- Discounted Cash Flow Score: Very favorable 5, suggesting strong valuation.
- ROE Score: Favorable 4, indicating good profitability from equity.
- ROA Score: Favorable 4, similarly showing good asset utilization.
- Debt To Equity Score: Moderate 2, reflecting lower financial risk.
- Overall Score: Favorable 4, indicating stronger overall financial standing.
Which one is the best rated?
Based strictly on the provided data, PSN is better rated overall with an A- rating and higher scores in discounted cash flow, debt-to-equity, and overall score. ROK shows strength in ROE but is weaker in debt management and overall rating.
Scores Comparison
Here is a comparison of the financial scores for Rockwell Automation, Inc. and Parsons Corporation:
ROK Scores
- Altman Z-Score: 5.32, indicating a safe zone with low bankruptcy risk.
- Piotroski Score: 8, categorized as very strong financial health.
PSN Scores
- Altman Z-Score: 3.59, indicating a safe zone with low bankruptcy risk.
- Piotroski Score: 6, indicating average financial strength.
Which company has the best scores?
Based strictly on the provided data, Rockwell Automation has higher Altman Z-Score and Piotroski Score values, suggesting stronger financial health compared to Parsons Corporation.
Grades Comparison
Here is a detailed comparison of the latest grades assigned to Rockwell Automation, Inc. and Parsons Corporation by reputable grading firms:
Rockwell Automation, Inc. Grades
The table below summarizes recent grades from established financial institutions for Rockwell Automation, Inc.:
| Grading Company | Action | New Grade | Date |
|---|---|---|---|
| Wells Fargo | Maintain | Equal Weight | 2026-01-07 |
| Barclays | Maintain | Overweight | 2026-01-07 |
| Goldman Sachs | Upgrade | Neutral | 2025-12-16 |
| Jefferies | Maintain | Buy | 2025-12-10 |
| Citigroup | Maintain | Buy | 2025-12-08 |
| Barclays | Maintain | Overweight | 2025-12-04 |
| Baird | Maintain | Outperform | 2025-11-21 |
| B of A Securities | Maintain | Buy | 2025-11-20 |
| JP Morgan | Maintain | Neutral | 2025-11-11 |
| Morgan Stanley | Maintain | Overweight | 2025-11-10 |
Overall, Rockwell Automation’s grades show a consensus around moderate optimism with a mix of Buy, Overweight, and Hold ratings, reflecting a stable outlook with some cautiousness.
Parsons Corporation Grades
The following table details recent grades for Parsons Corporation from recognized grading companies:
| Grading Company | Action | New Grade | Date |
|---|---|---|---|
| B of A Securities | Maintain | Buy | 2025-12-30 |
| Stifel | Maintain | Buy | 2025-12-23 |
| Jefferies | Maintain | Hold | 2025-12-11 |
| TD Cowen | Upgrade | Buy | 2025-12-10 |
| Baird | Maintain | Outperform | 2025-12-08 |
| Truist Securities | Maintain | Buy | 2025-12-08 |
| Keybanc | Maintain | Overweight | 2025-12-08 |
| Truist Securities | Maintain | Buy | 2025-12-05 |
| William Blair | Upgrade | Outperform | 2025-11-20 |
| Keybanc | Maintain | Overweight | 2025-10-20 |
Parsons Corporation’s ratings predominantly lean towards Buy and Outperform, with recent upgrades indicating a generally positive sentiment among analysts.
Which company has the best grades?
Parsons Corporation has received stronger and more consistent Buy and Outperform grades compared to Rockwell Automation’s mix of Hold and Buy ratings. This suggests Parsons may be viewed more favorably by analysts, potentially influencing investor confidence and portfolio decisions.
Strengths and Weaknesses
Below is a comparison of key strengths and weaknesses for Rockwell Automation, Inc. (ROK) and Parsons Corporation (PSN) based on their recent financial and operational data.
| Criterion | Rockwell Automation, Inc. (ROK) | Parsons Corporation (PSN) |
|---|---|---|
| Diversification | Balanced revenue across Intelligent Devices (3.76B), Lifecycle Services (2.20B), and Software & Control (2.38B) segments | Concentrated in two segments: Federal Solutions (4.01B) and Critical Infrastructure (2.74B) |
| Profitability | Strong profitability: Net margin 10.42%, ROE 23.78%, ROIC 13.71% | Moderate profitability: Net margin 3.48%, ROE 9.73%, ROIC 8.28% |
| Innovation | High innovation with solid Software & Control segment growth and growing ROIC trend (+77%) | Innovation visible in Federal Solutions but less diversified; ROIC growing at +80% |
| Global presence | Global leader with broad industrial automation footprint | Focused on U.S. federal and critical infrastructure projects |
| Market Share | Significant market share in industrial automation and control systems | Strong position in federal contracts but smaller scale overall |
Key takeaways: Rockwell Automation shows strong diversification and profitability with a durable competitive advantage. Parsons has a growing ROIC and favorable ratios but remains more niche with less diversification and lower profitability margins. Investors should weigh Rockwell’s broader market reach against Parsons’ specialized federal focus.
Risk Analysis
Below is a comparative table presenting key risk metrics for Rockwell Automation, Inc. (ROK) and Parsons Corporation (PSN) based on the most recent data available.
| Metric | Rockwell Automation, Inc. (ROK) | Parsons Corporation (PSN) |
|---|---|---|
| Market Risk | Beta 1.52 – higher volatility, more sensitive to market swings | Beta 0.66 – lower volatility, more defensive |
| Debt level | Debt-to-Equity 1.0 (Neutral), Debt-to-Assets 32.5% (Neutral) | Debt-to-Equity 0.59 (Neutral), Debt-to-Assets 25.9% (Favorable) |
| Regulatory Risk | Moderate – operates globally in multiple industrial sectors, some exposure to industry regulations | Moderate to high – defense and critical infrastructure contracts subject to government regulations and geopolitical scrutiny |
| Operational Risk | Medium – diversified segments with complexity in software and services integration | Medium – complex projects in defense and infrastructure, execution risk present |
| Environmental Risk | Moderate – involved in eco-industrial markets and renewable energy sectors | Moderate – environmental solutions offered, but operations in defense may involve hazardous materials |
| Geopolitical Risk | Moderate – international exposure but industrial focus limits direct geopolitical sensitivity | High – significant U.S. defense contracts and Middle East operations increase geopolitical risk |
In summary, Parsons faces higher geopolitical and regulatory risks due to its defense and critical infrastructure focus, while Rockwell Automation exhibits greater market volatility and moderate operational complexity. Debt levels remain manageable for both, but Rockwell’s higher beta suggests investors should be cautious about market-driven fluctuations.
Which Stock to Choose?
Rockwell Automation, Inc. (ROK) shows mixed income trends with a slight revenue growth of 0.97% in 2025 but declines in net margin and EPS overall. Its financial ratios are slightly favorable, featuring strong profitability and a solid return on equity of 23.78%, balanced by unfavorable valuation metrics and moderate debt levels. The company maintains a very favorable rating with a B- grade and scores indicating strong financial health.
Parsons Corporation (PSN) exhibits robust income growth, with 24.03% revenue increase in 2024 and significant improvements in net margin and EPS over the period. Its financial ratios are slightly favorable, supported by efficient asset use and lower leverage. The firm holds a very favorable A- rating, with moderate valuation scores and a good balance sheet, though profitability ratios remain modest compared to ROK.
For investors, PSN’s favorable income growth and solid rating may appear attractive for those seeking growth, while ROK’s stronger profitability and financial strength might be preferable for quality-focused or risk-tolerant profiles. The contrasting trends and ratings suggest that the choice could depend on individual risk appetite and investment strategy.
Disclaimer: Investment carries a risk of loss of initial capital. The past performance is not a reliable indicator of future results. Be sure to understand risks before making an investment decision.
Go Further
I encourage you to read the complete analyses of Rockwell Automation, Inc. and Parsons Corporation to enhance your investment decisions: