Home > Comparison > Industrials > PH vs XYL
The strategic rivalry between Parker-Hannifin Corporation and Xylem Inc. shapes the Industrials sector’s competitive landscape. Parker-Hannifin operates as a diversified industrial and aerospace systems giant, while Xylem specializes in engineered water solutions with a focus on smart technologies. This analysis contrasts their business models and growth trajectories to identify which company presents a superior risk-adjusted opportunity for a diversified portfolio in today’s market environment.
Table of contents
Companies Overview
Parker-Hannifin and Xylem play pivotal roles in the industrial machinery sector, shaping critical infrastructure worldwide.
Parker-Hannifin Corporation: Leader in Motion and Control Technologies
Parker-Hannifin dominates in motion and control systems for industrial, mobile, and aerospace markets. Its revenue stems from diverse industrial and aerospace components, including hydraulic, pneumatic, and electromechanical systems. In 2026, the company focuses on expanding its sealing, filtration, and thermal product lines, targeting OEMs and distributors globally to strengthen its competitive advantage.
Xylem Inc.: Innovator in Water Technology Solutions
Xylem specializes in engineered water and wastewater solutions, serving infrastructure and building services worldwide. Its core revenue comes from pumps, valves, smart meters, and advanced analytics software. In 2026, Xylem emphasizes smart water management and digital solutions, aiming to enhance operational efficiency and asset management across its Water Infrastructure and Measurement & Control segments.
Strategic Collision: Similarities & Divergences
Both companies operate in industrial machinery but diverge in focus: Parker-Hannifin centers on motion control, while Xylem leads in water technology innovation. Their primary battleground lies in industrial OEM markets with distinct customer needs. Parker-Hannifin offers broad systems expertise, whereas Xylem delivers specialized smart infrastructure solutions, reflecting contrasting risk profiles and growth trajectories in industrial innovation.
Income Statement Comparison
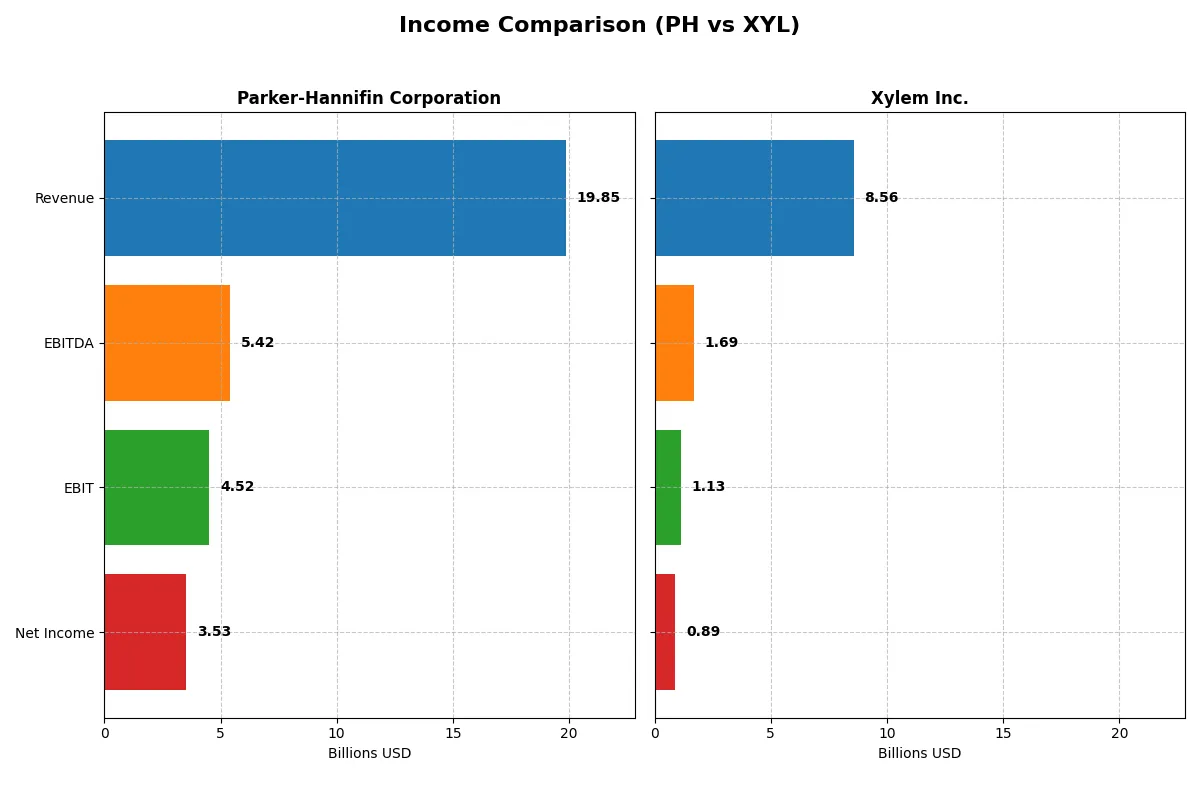
This data dissects the core profitability and scalability of both corporate engines to reveal who dominates the bottom line:
| Metric | Parker-Hannifin Corporation (PH) | Xylem Inc. (XYL) |
|---|---|---|
| Revenue | 19.85B | 8.56B |
| Cost of Revenue | 12.54B | 5.35B |
| Operating Expenses | 3.26B | 2.20B |
| Gross Profit | 7.32B | 3.21B |
| EBITDA | 5.42B | 1.69B |
| EBIT | 4.52B | 1.13B |
| Interest Expense | 409M | 44M |
| Net Income | 3.53B | 890M |
| EPS | 27.52 | 3.67 |
| Fiscal Year | 2025 | 2024 |
Income Statement Analysis: The Bottom-Line Duel
This income statement comparison reveals how efficiently each company turns revenue into profit and manages growth momentum over recent years.
Parker-Hannifin Corporation Analysis
Parker-Hannifin’s revenue climbed steadily from $14.3B in 2021 to $19.8B in 2025, with net income more than doubling to $3.53B. Its gross margin holds strong at 36.85%, and net margin rose to 17.79%, reflecting improved cost control. In 2025, EBIT surged 10%, signaling robust operating momentum despite a slight revenue dip.
Xylem Inc. Analysis
Xylem expanded revenue notably from $4.9B in 2020 to $8.56B in 2024, with net income soaring 2.5x to $890M. Gross margin stays solid at 37.51%, though net margin at 10.39% lags behind Parker-Hannifin. The company’s 2024 EBIT jumped 65%, showing aggressive profit growth fueled by efficient expense management.
Margin Strength vs. Growth Velocity
Parker-Hannifin leads on profitability with higher net and EBIT margins, reflecting superior operational efficiency. Xylem outpaces in revenue and net income growth rates, demonstrating faster expansion and margin improvement. For investors, Parker-Hannifin offers a stable, margin-rich profile, while Xylem appeals as a high-growth, improving-margin contender.
Financial Ratios Comparison
These vital ratios act as a diagnostic tool to expose the underlying fiscal health, valuation premiums, and capital efficiency of the companies compared below:
| Ratios | Parker-Hannifin (PH) | Xylem Inc. (XYL) |
|---|---|---|
| ROE | 25.8% | 8.4% |
| ROIC | 13.7% | 5.8% |
| P/E | 25.4x | 31.6x |
| P/B | 6.55x | 2.64x |
| Current Ratio | 1.19 | 1.75 |
| Quick Ratio | 0.71 | 1.33 |
| D/E | 0.69 | 0.20 |
| Debt-to-Assets | 32.2% | 12.9% |
| Interest Coverage | 9.93x | 22.9x |
| Asset Turnover | 0.67 | 0.52 |
| Fixed Asset Turnover | 6.76 | 7.43 |
| Payout ratio | 24.4% | 39.3% |
| Dividend yield | 0.96% | 1.24% |
| Fiscal Year | 2025 | 2024 |
Efficiency & Valuation Duel: The Vital Signs
Ratios act as a company’s DNA, revealing hidden risks and operational excellence critical for investment decisions.
Parker-Hannifin Corporation
Parker-Hannifin posts a strong 25.8% ROE and a favorable 17.8% net margin, signaling robust profitability. However, its P/E of 25.4 and P/B of 6.6 suggest a stretched valuation. The company offers a modest 0.96% dividend yield, indicating a conservative shareholder return policy with likely reinvestment into growth or R&D.
Xylem Inc.
Xylem shows a lower 8.4% ROE and a 10.4% net margin, reflecting moderate profitability. Its P/E ratio is elevated at 31.6, marking the stock as expensive relative to earnings. Xylem maintains a healthier balance sheet with low debt and a 1.24% dividend yield, balancing income with steady reinvestment in operations.
Premium Valuation vs. Operational Safety
Parker-Hannifin delivers stronger profitability but carries a stretched valuation and lower dividend yield. Xylem offers a more conservative balance sheet and slightly better dividend support, though with weaker returns. Investors seeking growth and returns might favor Parker-Hannifin; those prioritizing financial stability could lean toward Xylem.
Which one offers the Superior Shareholder Reward?
I see Parker-Hannifin (PH) and Xylem (XYL) both pay dividends with yields near 1.2%. PH offers a slightly lower yield at 0.96% but maintains a more conservative payout ratio near 24%, backed by robust free cash flow coverage (~88%). XYL’s payout ratio is higher, often above 39%, indicating a more aggressive distribution stance but with weaker free cash flow support (~67%-75%). Both companies engage in buybacks, though PH’s larger free cash flow per share (~26 vs. ~3.9) suggests stronger buyback capacity. I favor PH’s balanced dividend growth and buyback strategy as more sustainable for long-term value. In 2026, PH delivers a superior total return profile with prudent capital allocation and solid cash flow backing.
Comparative Score Analysis: The Strategic Profile
The radar chart reveals the fundamental DNA and trade-offs of Parker-Hannifin and Xylem, highlighting their financial strengths and vulnerabilities:
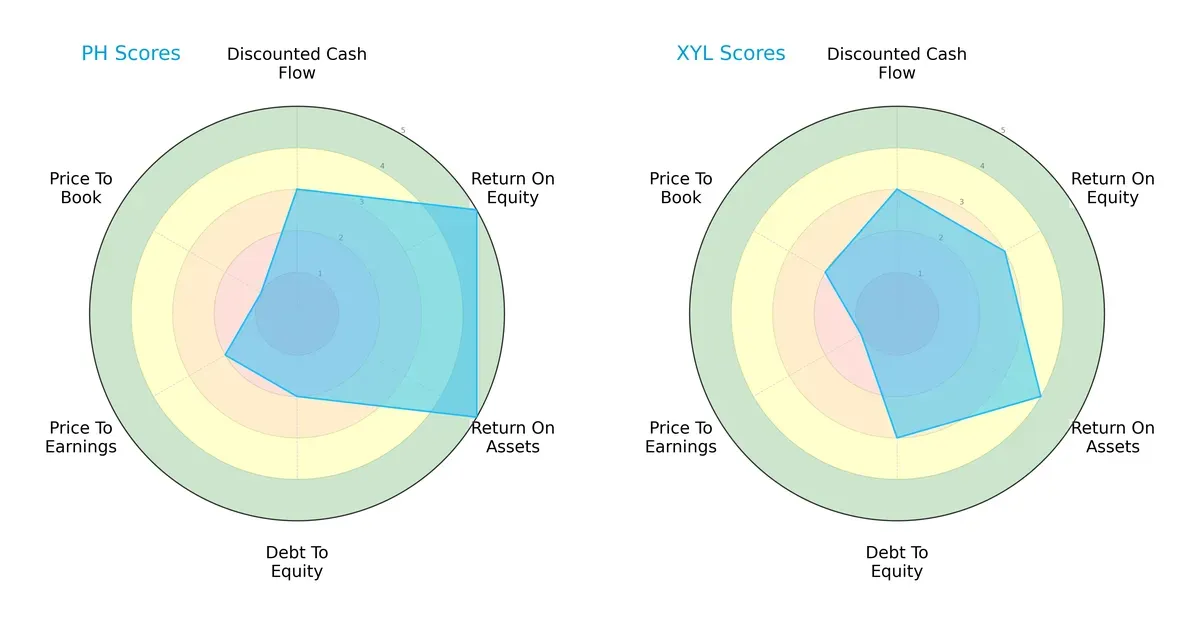
Parker-Hannifin excels in profitability metrics, boasting top ROE and ROA scores of 5 each, reflecting superior asset and equity efficiency. Xylem maintains a more balanced profile with moderate ROE (3) and favorable ROA (4). On leverage, Xylem edges out Parker-Hannifin with a slightly better debt-to-equity score (3 vs. 2). Valuation metrics favor Xylem on price-to-book (2 vs. 1), while Parker-Hannifin holds a moderate advantage on price-to-earnings (2 vs. 1). Overall, Parker-Hannifin leans on its operational excellence, whereas Xylem offers steadier financial risk management.
—
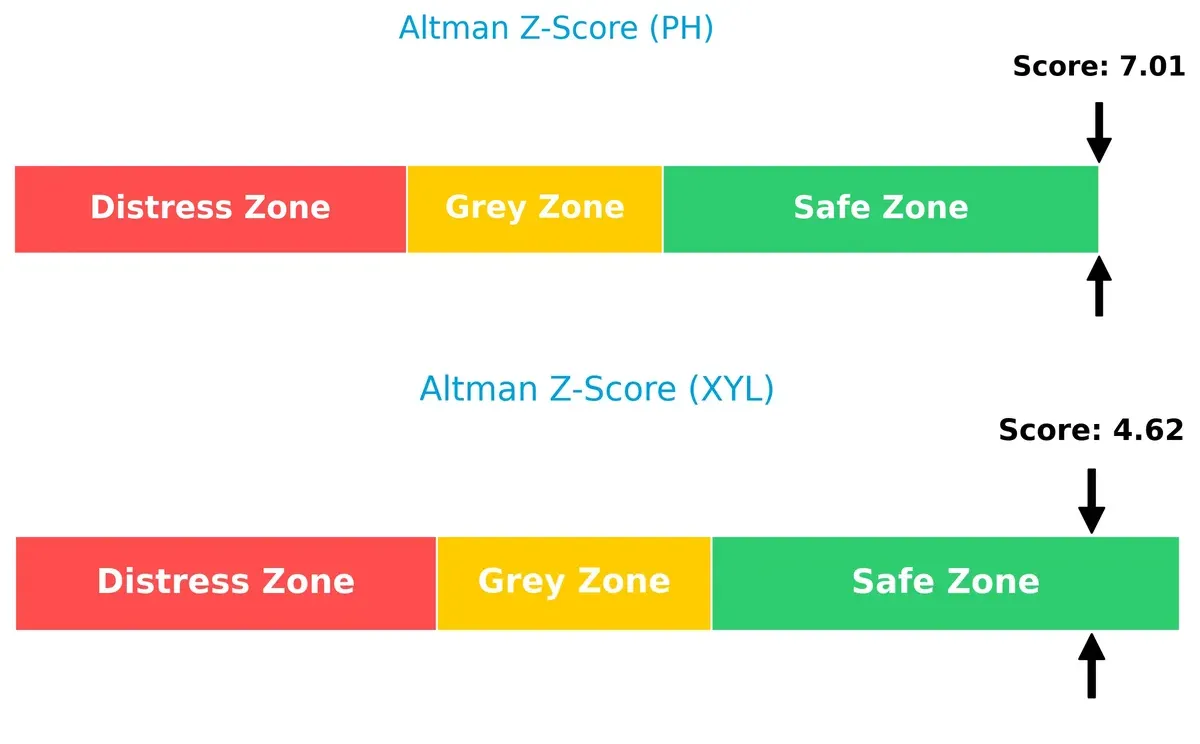
Bankruptcy Risk: Solvency Showdown
Parker-Hannifin’s Altman Z-Score of 7.01 vastly surpasses Xylem’s 4.62, signaling a stronger buffer against bankruptcy risk in this economic cycle:
—
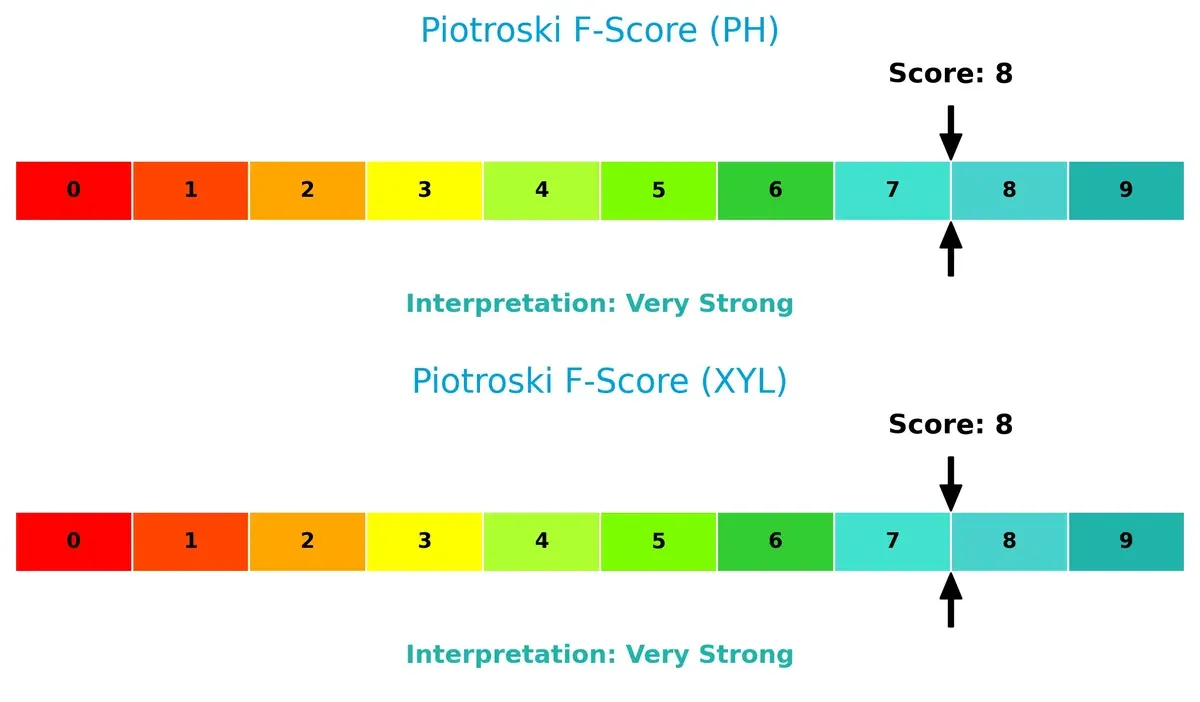
Financial Health: Quality of Operations
Both Parker-Hannifin and Xylem score an impressive 8 on the Piotroski F-Score, indicating very strong financial health with robust profitability, liquidity, and operational efficiency:
How are the two companies positioned?
This section dissects the operational DNA of PH and XYL by comparing their revenue distribution by segment and internal dynamics, including strengths and weaknesses. The final objective confronts their economic moats to reveal which business model offers the most resilient, sustainable competitive advantage today.
Revenue Segmentation: The Strategic Mix
This visual comparison dissects how Parker-Hannifin and Xylem diversify their income streams and where their primary sector bets lie:
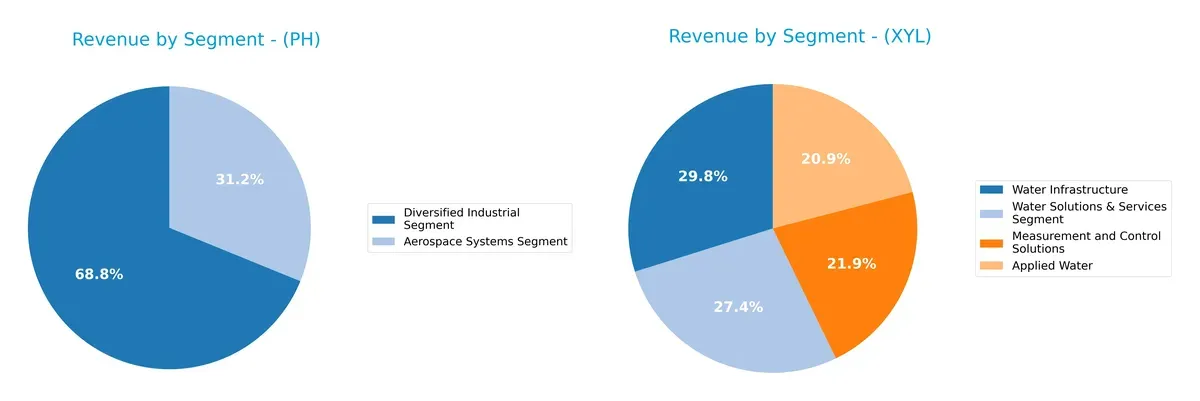
Parker-Hannifin anchors its revenue in two segments: $13.7B from Diversified Industrial and $6.2B from Aerospace Systems in 2025. This split shows moderate diversification but a clear tilt toward industrial products. Xylem, however, exhibits a more balanced mix with four segments nearing $1.8B to $2.6B each, pivoting around Water Infrastructure and Applied Water. Xylem’s spread reduces concentration risk, while Parker-Hannifin leverages industrial scale but faces exposure to sector cycles.
Strengths and Weaknesses Comparison
This table compares the strengths and weaknesses of Parker-Hannifin Corporation (PH) and Xylem Inc. (XYL):
PH Strengths
- Strong profitability with 17.79% net margin and 25.81% ROE
- Favorable ROIC at 13.69% vs. WACC 9.25%
- Diversified revenue from aerospace and industrial segments
- Significant global presence, especially North America and Europe
- Solid interest coverage at 11.04 and fixed asset turnover at 6.76
XYL Strengths
- Favorable net margin at 10.39% and strong interest coverage at 25.7
- Superior liquidity ratios (current 1.75, quick 1.33) and low debt (D/E 0.2)
- Diversified water-related segments including infrastructure and services
- Global footprint with growing US and European revenue
- Favorable fixed asset turnover at 7.43
PH Weaknesses
- High valuation multiples (P/E 25.38, P/B 6.55) suggest premium pricing
- Weak quick ratio at 0.71 signals liquidity concerns
- Moderate leverage with debt to assets at 32.16%
- Dividend yield below 1% limits income appeal
XYL Weaknesses
- Lower ROE at 8.36% below ideal profitability benchmarks
- Elevated P/E at 31.63 indicates expensive valuation
- Neutral dividend yield and moderate asset turnover at 0.52
- Less diversified revenue base compared to PH, focused on water solutions
Both companies show slightly favorable financial profiles but differ in capital structure and profitability metrics. PH’s premium valuation and liquidity constraints contrast with XYL’s lower leverage and liquidity strength, shaping distinct strategic considerations.
The Moat Duel: Analyzing Competitive Defensibility
A structural moat shields long-term profits from competitive erosion. Without it, market gains quickly dissipate. Let’s dissect the moats of Parker-Hannifin and Xylem:
Parker-Hannifin Corporation: Engineering Precision with Cost Advantage
Parker-Hannifin’s moat hinges on cost advantage through advanced motion and control tech. Its ROIC exceeds WACC by 4.4%, signaling efficient capital use and value creation. Expanding aerospace and industrial systems in 2026 could deepen this edge.
Xylem Inc.: Water Solutions with Innovation-Driven Network Effects
Xylem banks on network effects via integrated water infrastructure and smart control solutions. Despite a negative ROIC vs. WACC spread, rising ROIC shows improving profitability. Growth in smart water tech may disrupt markets and fortify its position.
Capital Efficiency vs. Innovation Network: Who Defends Market Share Better?
Parker-Hannifin’s wider moat rests on clear value creation and strong cost leadership. Xylem’s improving innovation-driven moat remains vulnerable due to current value destruction. Parker-Hannifin stands better poised to defend and expand its market share in 2026.
Which stock offers better returns?
The past year saw Parker-Hannifin’s stock surge sharply with strong buying momentum, while Xylem’s price rose modestly and faced recent slight declines in trading dynamics.
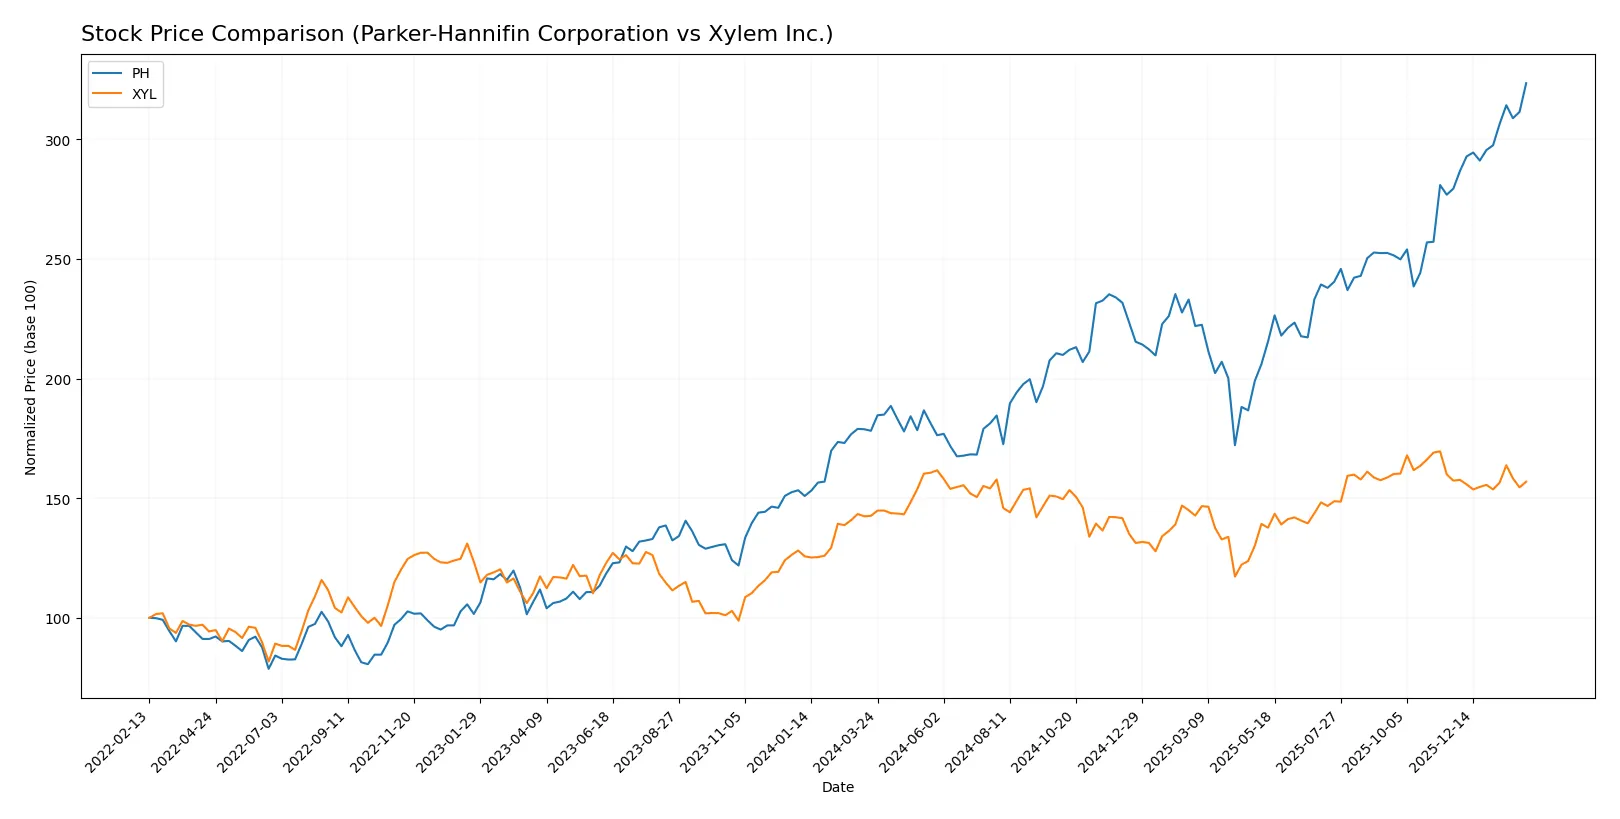
Trend Comparison
Parker-Hannifin’s stock rose 81.54% over the past year, showing a bullish trend with acceleration. It reached a high of 971.99 and a low of 503.3, with high volatility (std dev 115.81).
Xylem’s stock gained 10.01% over the same period, also bullish with acceleration. It hit 151.31 at its peak and 104.6 at its lowest, showing low volatility (std dev 9.57).
Parker-Hannifin clearly outperformed Xylem, delivering the highest market returns with stronger price appreciation and buyer dominance.
Target Prices
Analysts maintain optimistic targets for Parker-Hannifin and Xylem, signaling moderate upside potential.
| Company | Target Low | Target High | Consensus |
|---|---|---|---|
| Parker-Hannifin Corporation | 825 | 1,139 | 995.46 |
| Xylem Inc. | 150 | 178 | 169.43 |
Parker-Hannifin’s consensus target of 995.46 slightly exceeds its current price of 971.19, indicating modest growth expectations. Xylem’s consensus target of 169.43 is well above its current 140.1 price, suggesting stronger analyst confidence in appreciation.

Don’t Let Luck Decide Your Entry Point
Optimize your entry points with our advanced ProRealTime indicators. You’ll get efficient buy signals with precise price targets for maximum performance. Start outperforming now!
How do institutions grade them?
Institutional grades for Parker-Hannifin Corporation and Xylem Inc. reveal their latest analyst sentiment:
Parker-Hannifin Corporation Grades
The following table summarizes recent grades from reputable analysts for Parker-Hannifin Corporation:
| Grading Company | Action | New Grade | Date |
|---|---|---|---|
| Jefferies | Maintain | Buy | 2026-01-30 |
| Barclays | Maintain | Overweight | 2026-01-30 |
| Stifel | Maintain | Hold | 2026-01-30 |
| JP Morgan | Maintain | Overweight | 2026-01-30 |
| Wells Fargo | Maintain | Overweight | 2026-01-30 |
| Citigroup | Maintain | Buy | 2026-01-30 |
| Stifel | Maintain | Hold | 2026-01-23 |
| JP Morgan | Maintain | Overweight | 2026-01-16 |
| Morgan Stanley | Maintain | Equal Weight | 2026-01-14 |
| Barclays | Maintain | Overweight | 2026-01-07 |
Xylem Inc. Grades
Below are recent credible analyst grades for Xylem Inc.:
| Grading Company | Action | New Grade | Date |
|---|---|---|---|
| Barclays | Maintain | Overweight | 2026-01-07 |
| Mizuho | Maintain | Neutral | 2026-01-05 |
| TD Cowen | Maintain | Hold | 2025-12-05 |
| UBS | Maintain | Buy | 2025-11-06 |
| Stifel | Maintain | Buy | 2025-10-29 |
| Citigroup | Maintain | Buy | 2025-10-29 |
| Barclays | Maintain | Overweight | 2025-10-29 |
| RBC Capital | Maintain | Outperform | 2025-10-29 |
| Citigroup | Maintain | Buy | 2025-10-09 |
| Mizuho | Maintain | Neutral | 2025-09-12 |
Which company has the best grades?
Parker-Hannifin holds several Overweight and Buy ratings, but Xylem features multiple Buy and Outperform ratings, indicating slightly stronger institutional enthusiasm. These differences may influence investor sentiment and portfolio positioning.
Risks specific to each company
The following categories identify the critical pressure points and systemic threats facing both firms in the 2026 market environment:
1. Market & Competition
Parker-Hannifin Corporation
- Operates in diversified industrial and aerospace segments, facing intense OEM competition and cyclical demand risks.
Xylem Inc.
- Focuses on water and wastewater solutions, with competition from specialized industrial and environmental tech firms.
2. Capital Structure & Debt
Parker-Hannifin Corporation
- Moderate leverage with debt-to-equity at 0.69; interest coverage strong at 11.04, signaling manageable debt risk.
Xylem Inc.
- Low leverage with debt-to-equity at 0.20; excellent interest coverage of 25.7, indicating strong balance sheet resilience.
3. Stock Volatility
Parker-Hannifin Corporation
- Beta at 1.24 implies moderately higher volatility than the market, reflecting industrial cyclicality.
Xylem Inc.
- Beta at 1.16 shows slightly lower volatility, benefiting from steady water infrastructure demand.
4. Regulatory & Legal
Parker-Hannifin Corporation
- Aerospace and industrial sectors expose PH to strict safety and environmental regulations globally.
Xylem Inc.
- Water sector compliance with environmental and health regulations is critical; emerging standards could increase costs.
5. Supply Chain & Operations
Parker-Hannifin Corporation
- Complex global supply chains for aerospace components pose risks from disruption and raw material costs.
Xylem Inc.
- Supply chain concentrated on water systems and controls; reliance on specific technologies could affect operational flexibility.
6. ESG & Climate Transition
Parker-Hannifin Corporation
- Faces pressure to improve sustainability in manufacturing and reduce emissions in aerospace products.
Xylem Inc.
- Positioned to benefit from climate transition through water conservation technologies but must manage resource use.
7. Geopolitical Exposure
Parker-Hannifin Corporation
- Global aerospace exposure creates sensitivity to trade tensions and defense spending fluctuations.
Xylem Inc.
- International water infrastructure projects expose XYL to geopolitical and regulatory risks in emerging markets.
Which company shows a better risk-adjusted profile?
Xylem faces lower financial leverage and stronger liquidity ratios, reducing balance sheet risk. Parker-Hannifin’s higher market volatility and greater regulatory complexity increase its risk profile. The most impactful risk for PH is supply chain complexity in aerospace. For XYL, geopolitical exposure in emerging markets is critical. Xylem’s conservative capital structure and stable demand trends give it a superior risk-adjusted profile in 2026.
Final Verdict: Which stock to choose?
Parker-Hannifin’s superpower lies in its robust value creation and growing profitability, underpinned by a very favorable moat and a strong return on invested capital. Its point of vigilance is the premium valuation, which could temper near-term upside. It suits an aggressive growth portfolio willing to pay for durable competitive advantage.
Xylem’s strategic moat centers on solid balance sheet health and improving operational cash flow, offering a safer profile with moderate financial risk. Despite a less compelling ROIC, its consistent income growth fits well within a GARP (Growth at a Reasonable Price) strategy, balancing growth prospects with financial stability.
If you prioritize sustained value creation and operational excellence, Parker-Hannifin outshines due to its superior capital efficiency and margin expansion. However, if you seek better stability with moderate growth, Xylem offers a more conservative investment scenario supported by a healthier liquidity position and lower leverage. Both present slightly favorable financial profiles but cater to distinct investor appetites.
Disclaimer: Investment carries a risk of loss of initial capital. The past performance is not a reliable indicator of future results. Be sure to understand risks before making an investment decision.
Go Further
I encourage you to read the complete analyses of Parker-Hannifin Corporation and Xylem Inc. to enhance your investment decisions: