Home > Comparison > Industrials > PH vs SYM
The strategic rivalry between Parker-Hannifin Corporation and Symbotic Inc. shapes the evolution of industrial machinery. Parker-Hannifin, a century-old diversified industrial and aerospace systems leader, contrasts with Symbotic’s innovative warehouse automation platform targeting retail efficiency. This head-to-head pits a broad-based industrial legacy against cutting-edge robotics growth. This analysis will identify which corporate trajectory offers the more compelling risk-adjusted return for a diversified portfolio.
Table of contents
Companies Overview
Parker-Hannifin and Symbotic dominate distinct niches within industrial machinery, shaping automation and control system markets.
Parker-Hannifin Corporation: Industrial Motion and Control Leader
Parker-Hannifin excels as a global manufacturer of motion and control technologies serving mobile, industrial, and aerospace sectors. Its revenue engine hinges on diversified products like hydraulic, pneumatic, and electromechanical systems sold to OEMs and distributors. In 2026, it focuses strategically on expanding aerospace systems and enhancing industrial product integration for diverse applications.
Symbotic Inc.: Warehouse Automation Innovator
Symbotic stands out as a pioneer in robotics and automation technology designed for retailers and wholesalers. Its core revenue derives from The Symbotic System, a full-service warehouse automation platform improving cost efficiency and inventory management. The company’s 2026 strategy zeroes in on scaling tech deployments across U.S. distribution centers to capture automation growth.
Strategic Collision: Similarities & Divergences
Both compete in industrial machinery but diverge in approach: Parker-Hannifin leverages a broad product portfolio across sectors, while Symbotic focuses on specialized warehouse automation software and robotics. Their primary battleground is operational efficiency in supply chain and manufacturing. Parker-Hannifin appeals to diversified industrial investors; Symbotic targets growth-oriented portfolios with higher beta and tech exposure.
Income Statement Comparison
This data dissects the core profitability and scalability of both corporate engines to reveal who dominates the bottom line:

| Metric | Parker-Hannifin Corporation (PH) | Symbotic Inc. (SYM) |
|---|---|---|
| Revenue | 19.85B | 2.25B |
| Cost of Revenue | 12.54B | 1.82B |
| Operating Expenses | 3.26B | 538M |
| Gross Profit | 7.32B | 423M |
| EBITDA | 5.42B | -48M |
| EBIT | 4.52B | -92M |
| Interest Expense | 409M | 0 |
| Net Income | 3.53B | -17M |
| EPS | 27.52 | -0.16 |
| Fiscal Year | 2025 | 2025 |
Income Statement Analysis: The Bottom-Line Duel
This income statement comparison reveals which company converts revenue into profit more efficiently and sustains margin strength over time.
Parker-Hannifin Corporation Analysis
Parker-Hannifin’s revenue grew moderately from 14.3B in 2021 to nearly 19.9B in 2025, with a slight dip in the last year. Net income surged impressively from 1.75B to 3.53B across five years. Its gross margin hovers near 37%, while net margin expanded to 17.8%, underscoring strong operational efficiency and margin momentum in 2025.
Symbotic Inc. Analysis
Symbotic’s revenue soared from 251M in 2021 to 2.25B in 2025, reflecting hyper-growth. However, net income remains negative, improving only marginally from -122M to -17M over the period. Its gross margin is a modest 18.8%, and net margin stays negative at -0.75%, indicating ongoing challenges in scaling profitability despite rapid top-line growth.
Margin Dominance vs. Growth Gambit
Parker-Hannifin clearly outperforms Symbotic in profitability and margin quality, delivering consistent net income growth and operational leverage. Symbotic excels in revenue expansion but struggles to translate it into positive earnings. For investors prioritizing durable profits and margin health, Parker-Hannifin presents a more compelling fundamental profile.
Financial Ratios Comparison
These vital ratios act as a diagnostic tool to expose the underlying fiscal health, valuation premiums, and capital efficiency of the companies analyzed:
| Ratios | Parker-Hannifin (PH) | Symbotic (SYM) |
|---|---|---|
| ROE | 25.8% | -7.7% |
| ROIC | 13.7% | -16.6% |
| P/E | 25.4 | -334.5 |
| P/B | 6.55 | 25.60 |
| Current Ratio | 1.19 | 1.08 |
| Quick Ratio | 0.71 | 0.99 |
| D/E | 0.69 | 0.14 |
| Debt-to-Assets | 32.2% | 1.3% |
| Interest Coverage | 9.93 | 0 |
| Asset Turnover | 0.67 | 0.94 |
| Fixed Asset Turnover | 6.76 | 15.92 |
| Payout ratio | 24.4% | 0% |
| Dividend yield | 0.96% | 0% |
| Fiscal Year | 2025 | 2025 |
Efficiency & Valuation Duel: The Vital Signs
Ratios serve as a company’s DNA, unveiling hidden risks and operational excellence beyond surface-level financials.
Parker-Hannifin Corporation
Parker-Hannifin boasts a strong ROE of 25.8% and a healthy net margin of 17.8%, signaling robust profitability. The stock appears stretched with a P/E of 25.4 and P/B of 6.55, exceeding typical sector averages. Shareholders receive modest dividends (0.96%), while the company balances reinvestment and capital returns efficiently.
Symbotic Inc.
Symbotic struggles with negative profitability metrics: ROE stands at -7.7% and net margin at -0.75%. Its valuation, though showing a negative P/E, is distorted by losses. The company keeps debt low (D/E 0.14) but offers no dividends, aggressively reinvesting in R&D (9.6% of revenue) to fuel growth despite operational challenges.
Premium Valuation vs. Operational Safety
Parker-Hannifin delivers superior profitability with a slightly stretched valuation but solid operational returns. Symbotic’s high risk profile and reinvestment focus contrast with Parker’s stable cash flows. Investors seeking steady returns may prefer Parker; those with a higher risk appetite might consider Symbotic’s growth potential.
Which one offers the Superior Shareholder Reward?
I compare Parker-Hannifin (PH) and Symbotic (SYM) on shareholder reward through dividends and buybacks. PH pays a consistent dividend yield near 1.0%, with a sustainable payout ratio around 24%. Its free cash flow comfortably covers dividends and capex, supporting steady returns. PH also executes meaningful buybacks, enhancing total returns and reflecting prudent capital allocation. Conversely, SYM pays no dividends, reinvesting heavily in growth and R&D, evident from negative margins and volatile cash flows. SYM’s buyback activity is negligible, reflecting its early-stage growth profile but adding risk. Given PH’s combination of yield, buybacks, and solid free cash flow, I find PH offers a more attractive and sustainable total return profile for 2026 investors.
Comparative Score Analysis: The Strategic Profile
The radar chart reveals the fundamental DNA and trade-offs of Parker-Hannifin Corporation and Symbotic Inc., highlighting their financial strengths and vulnerabilities:
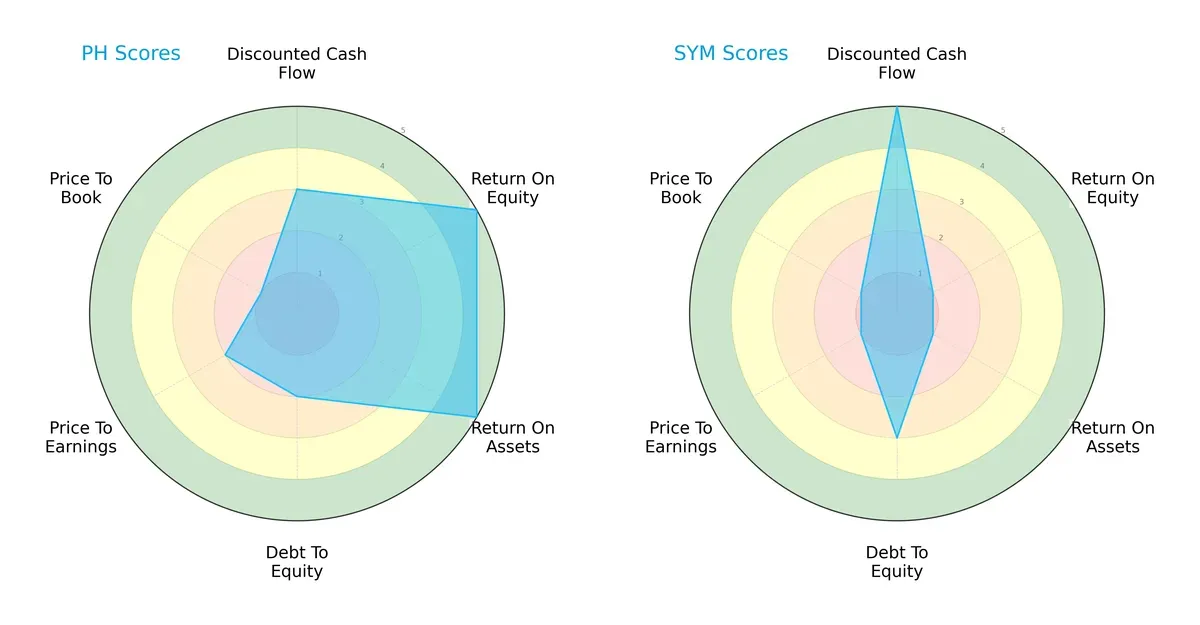
Parker-Hannifin shows a more balanced profile, excelling in ROE (5) and ROA (5) with moderate DCF (3) and manageable debt (2). Symbotic relies heavily on DCF strength (5) but suffers from weak profitability scores (ROE 1, ROA 1) and poor valuation metrics (P/E 1, P/B 1). Parker-Hannifin’s diversified edge contrasts with Symbotic’s narrow advantage in cash flow projections.
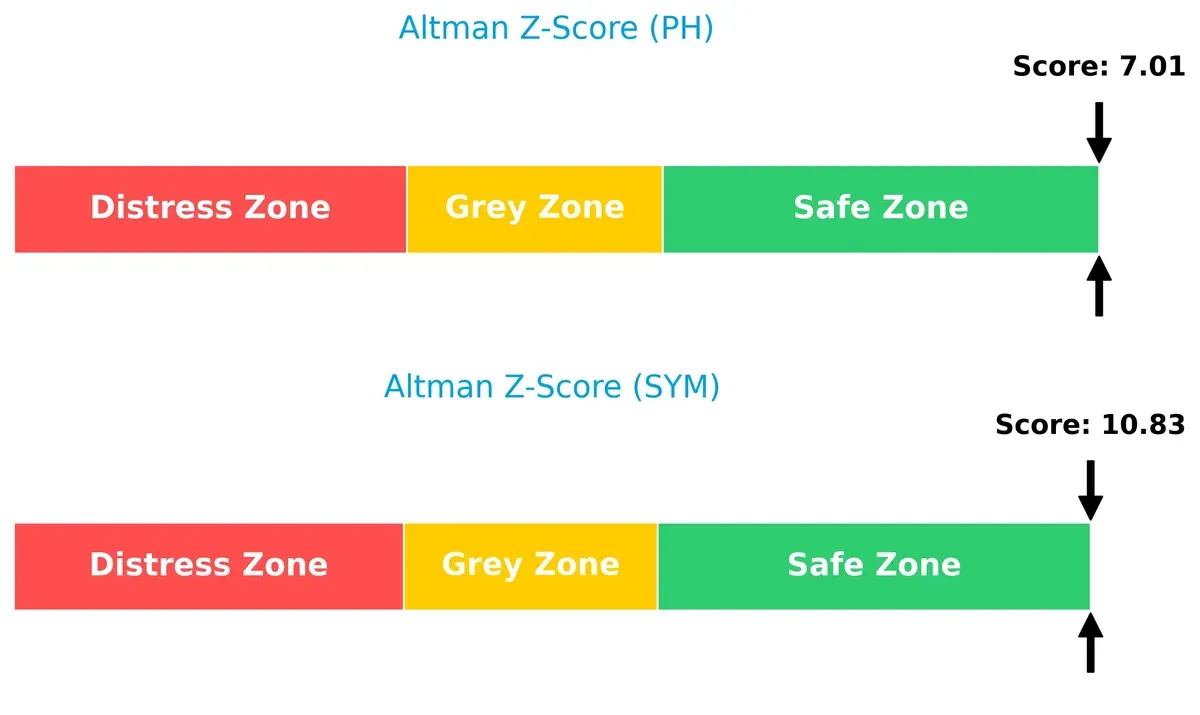
Bankruptcy Risk: Solvency Showdown
Parker-Hannifin’s Altman Z-Score of 7.0 versus Symbotic’s 10.8 places both firmly in the safe zone, but Symbotic holds a stronger buffer against insolvency risks in this market cycle:
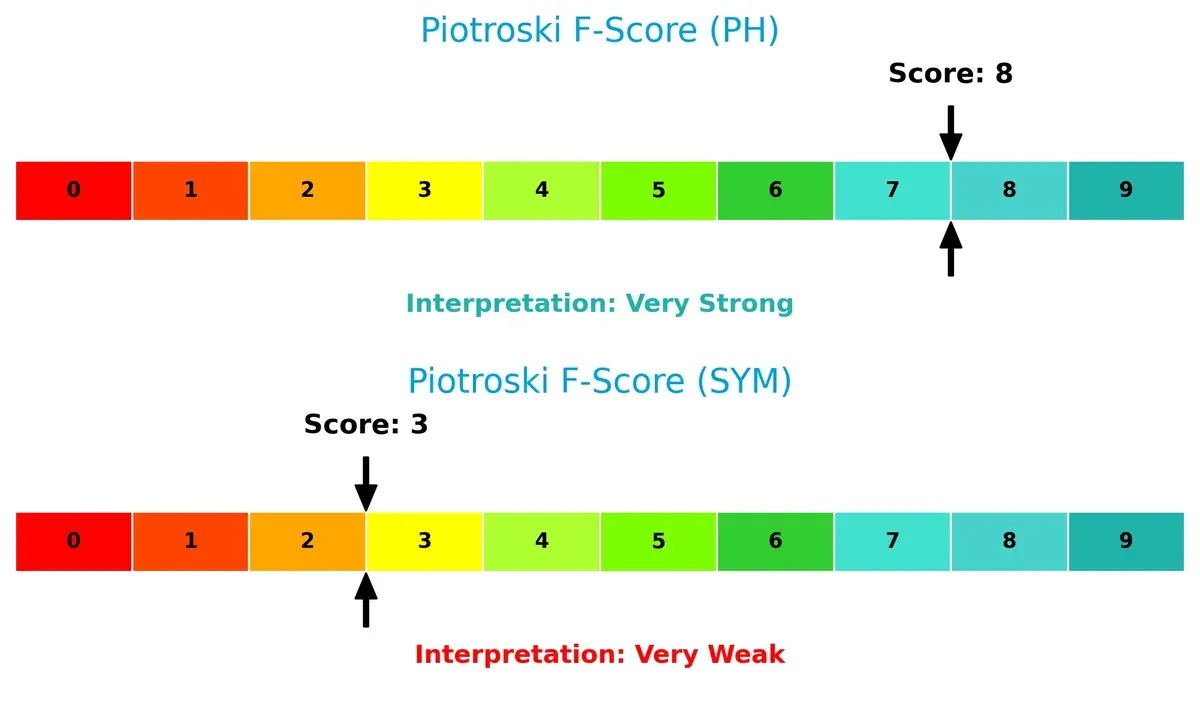
Financial Health: Quality of Operations
Parker-Hannifin’s Piotroski F-Score of 8 signals very strong financial health, while Symbotic’s 3 flags significant operational weaknesses and red flags in internal financial metrics:
How are the two companies positioned?
This section dissects PH and SYM’s operational DNA by comparing revenue distribution and internal dynamics. The goal is to confront their economic moats to reveal which model offers the most resilient, sustainable advantage today.
Revenue Segmentation: The Strategic Mix
This visual comparison dissects how Parker-Hannifin and Symbotic diversify their income streams and reveals where their primary sector bets lie:

Parker-Hannifin anchors its revenue in the Diversified Industrial Segment with $13.7B in 2025, dwarfing its Aerospace Systems Segment at $6.2B. This mix shows a balanced industrial and aerospace exposure, reducing concentration risk. Symbotic pivots heavily on its Systems segment with $2.1B, while Operation Services and Software Maintenance remain smaller. Symbotic’s reliance on Systems signals infrastructure dominance but also a risk if that market weakens.
Strengths and Weaknesses Comparison
This table compares the Strengths and Weaknesses of Parker-Hannifin Corporation (PH) and Symbotic Inc. (SYM):
PH Strengths
- Diversified revenue from Aerospace and Industrial segments
- Strong profitability with 17.79% net margin and 25.81% ROE
- Favorable fixed asset turnover at 6.76
- Global presence with strong North America, Europe, and Asia Pacific sales
SYM Strengths
- Favorable debt ratios with 0.14 debt-to-equity and 1.32% debt-to-assets
- High fixed asset turnover at 15.92
- Neutral liquidity ratios with current and quick ratios near 1.0
- U.S.-centric sales concentration
PH Weaknesses
- Unfavorable valuation multiples: PE 25.38 and PB 6.55
- Quick ratio low at 0.71 signaling liquidity concerns
- Dividend yield under 1% may deter income investors
- Moderate debt level with 0.69 debt-to-equity
SYM Weaknesses
- Negative profitability: net margin -0.75%, ROE -7.65%, ROIC -16.63%
- Unfavorable WACC at 13.86% and no interest coverage
- High PB ratio of 25.6 suggests overvaluation
- No dividend yield, reflecting early growth phase or reinvestment
Parker-Hannifin’s strengths lie in its diversified industrial base and solid profitability, supported by global sales and efficient asset use. Symbotic shows financial prudence in leverage and asset turnover but faces critical profitability challenges and high valuation risks. These factors shape each company’s strategic focus on growth and financial stability.
The Moat Duel: Analyzing Competitive Defensibility
A structural moat is the only reliable shield defending long-term profits from relentless competitive pressure and margin erosion:
Parker-Hannifin Corporation: Durable Engineering Excellence
I see Parker-Hannifin’s moat in its advanced motion and control technologies, underpinned by high ROIC exceeding WACC by 4.4%. This reflects efficient capital allocation and stable margins. Its diversified industrial and aerospace segments position it well to leverage new aerospace contracts and emerging markets in 2026.
Symbotic Inc.: Disruptive Automation with Scalability Challenges
Symbotic’s moat centers on its cutting-edge warehouse automation platform, offering cost advantages through robotics. However, it currently sheds value with ROIC well below WACC and declining profitability. Rapid revenue growth signals potential, but operational leverage and scaling hurdles remain significant risks in 2026.
Capital Efficiency vs. Innovation Leap: The Moat Contest
Parker-Hannifin’s wider, proven moat outmatches Symbotic’s nascent, unprofitable edge. I judge Parker-Hannifin better equipped to defend and grow market share amid industrial cycles and competitive threats. Symbotic must improve capital returns to solidify its foothold.
Which stock offers better returns?
The past year saw Parker-Hannifin’s stock surge sharply, while Symbotic’s growth moderated with recent weakening trading momentum.

Trend Comparison
Parker-Hannifin’s stock rose 81.54% over the past year, showing a bullish trend with accelerating gains and a high volatility level marked by a 115.81 standard deviation.
Symbotic gained 18.58% over the same period, maintaining a bullish trend but with decelerating momentum and lower volatility, reflected by a 15.71 standard deviation.
Parker-Hannifin outperformed Symbotic clearly, delivering the highest market returns and stronger upward momentum throughout the year.
Target Prices
Analysts present a cautiously optimistic outlook for Parker-Hannifin Corporation and Symbotic Inc.
| Company | Target Low | Target High | Consensus |
|---|---|---|---|
| Parker-Hannifin Corporation | 825 | 1139 | 995.46 |
| Symbotic Inc. | 42 | 83 | 65.56 |
The target consensus for Parker-Hannifin sits slightly above its current price of 972, signaling modest upside potential. Symbotic’s consensus target exceeds its current 54.2 price, suggesting substantial growth expectations from analysts.

Don’t Let Luck Decide Your Entry Point
Optimize your entry points with our advanced ProRealTime indicators. You’ll get efficient buy signals with precise price targets for maximum performance. Start outperforming now!
How do institutions grade them?
The institutional grades for Parker-Hannifin Corporation and Symbotic Inc. are as follows:
Parker-Hannifin Corporation Grades
The latest institutional grades for Parker-Hannifin Corporation are summarized in the table below.
| Grading Company | Action | New Grade | Date |
|---|---|---|---|
| Jefferies | Maintain | Buy | 2026-01-30 |
| Barclays | Maintain | Overweight | 2026-01-30 |
| Stifel | Maintain | Hold | 2026-01-30 |
| JP Morgan | Maintain | Overweight | 2026-01-30 |
| Wells Fargo | Maintain | Overweight | 2026-01-30 |
| Citigroup | Maintain | Buy | 2026-01-30 |
| Stifel | Maintain | Hold | 2026-01-23 |
| JP Morgan | Maintain | Overweight | 2026-01-16 |
| Morgan Stanley | Maintain | Equal Weight | 2026-01-14 |
| Barclays | Maintain | Overweight | 2026-01-07 |
Symbotic Inc. Grades
The latest institutional grades for Symbotic Inc. are summarized in the table below.
| Grading Company | Action | New Grade | Date |
|---|---|---|---|
| Barclays | Maintain | Underweight | 2026-01-12 |
| Goldman Sachs | Downgrade | Sell | 2025-12-02 |
| Barclays | Maintain | Underweight | 2025-11-26 |
| Baird | Maintain | Neutral | 2025-11-26 |
| Cantor Fitzgerald | Maintain | Overweight | 2025-11-25 |
| Citigroup | Maintain | Buy | 2025-11-25 |
| Craig-Hallum | Upgrade | Buy | 2025-11-25 |
| DA Davidson | Maintain | Neutral | 2025-11-25 |
| Needham | Maintain | Buy | 2025-11-25 |
| Northland Capital Markets | Maintain | Outperform | 2025-11-25 |
Which company has the best grades?
Parker-Hannifin consistently receives Buy and Overweight ratings from major firms, indicating stronger institutional confidence. Symbotic’s grades are mixed, including Underweight and a recent Sell downgrade, signaling higher perceived risk. Investors might view Parker-Hannifin’s grades as more supportive for stability.
Risks specific to each company
The following categories identify the critical pressure points and systemic threats facing both firms in the 2026 market environment:
1. Market & Competition
Parker-Hannifin Corporation
- Established industrial machinery leader with diversified product lines and strong OEM relationships.
Symbotic Inc.
- Emerging automation tech firm facing intense competition and pressure to scale rapidly in a niche market.
2. Capital Structure & Debt
Parker-Hannifin Corporation
- Moderate debt-to-equity of 0.69 with solid interest coverage of 11.04, reflecting stable leverage.
Symbotic Inc.
- Very low debt-to-equity at 0.14 but zero interest coverage signals inability to service debt currently.
3. Stock Volatility
Parker-Hannifin Corporation
- Beta of 1.24 indicates moderate market sensitivity, typical for industrials with steady cash flows.
Symbotic Inc.
- Beta of 2.14 shows high volatility, reflecting investor uncertainty and growth-stage risk.
4. Regulatory & Legal
Parker-Hannifin Corporation
- Operating globally in aerospace and industrial sectors exposes it to complex compliance demands.
Symbotic Inc.
- Focus on warehouse automation may face evolving labor and safety regulations impacting adoption.
5. Supply Chain & Operations
Parker-Hannifin Corporation
- Long-standing supply chains provide resilience, but exposure to global industrial disruptions remains.
Symbotic Inc.
- Supply chain still developing; reliance on tech components may cause bottlenecks and delays.
6. ESG & Climate Transition
Parker-Hannifin Corporation
- Industrial footprint faces pressure to reduce emissions and improve sustainability practices.
Symbotic Inc.
- Automation focus aligns with efficiency gains but requires robust ESG policies to satisfy investors.
7. Geopolitical Exposure
Parker-Hannifin Corporation
- Significant global operations expose it to trade tensions and geopolitical risk in aerospace markets.
Symbotic Inc.
- Primarily US-based, limiting direct geopolitical risk but vulnerable to domestic policy shifts.
Which company shows a better risk-adjusted profile?
Parker-Hannifin’s greatest risk lies in geopolitical and regulatory pressures due to its global aerospace exposure. Symbotic’s key risk is operational and financial fragility, highlighted by negative profitability and zero interest coverage. Despite higher volatility, Parker-Hannifin’s diversified operations and strong financial ratios give it a better risk-adjusted profile in 2026. Recent data shows Symbotic’s weak profitability and financial leverage as red flags demanding caution.
Final Verdict: Which stock to choose?
Parker-Hannifin’s superpower lies in its proven ability to create value consistently, as seen in its growing ROIC that comfortably exceeds its cost of capital. Its operational efficiency and robust profitability underpin this strength. However, a moderate liquidity position calls for vigilance. It suits investors seeking steady, long-term growth with a tolerance for cyclical industrial exposures.
Symbotic’s strategic moat is its innovative automation technology, driving rapid revenue expansion in a niche market. While it offers compelling growth potential, its current value destruction and uneven profitability highlight elevated risk. Compared to Parker-Hannifin, it carries less stability but could fit portfolios focused on high-risk, high-reward opportunities.
If you prioritize resilient value creation and financial strength, Parker-Hannifin outshines as the compelling choice due to sustainable profitability and operational discipline. However, if you seek aggressive growth with exposure to cutting-edge automation, Symbotic offers superior upside potential despite its current financial challenges. Each presents a distinct analytical scenario aligned with different investor risk profiles.
Disclaimer: Investment carries a risk of loss of initial capital. The past performance is not a reliable indicator of future results. Be sure to understand risks before making an investment decision.
Go Further
I encourage you to read the complete analyses of Parker-Hannifin Corporation and Symbotic Inc. to enhance your investment decisions: