Home > Comparison > Industrials > PH vs ROP
The strategic rivalry between Parker-Hannifin Corporation and Roper Technologies defines the current trajectory of the industrial machinery sector. Parker-Hannifin operates as a capital-intensive industrial giant with diverse motion and control technologies, while Roper Technologies excels as a high-margin software and engineered products provider. This head-to-head pits traditional manufacturing scale against technological innovation. This analysis will determine which corporate trajectory offers the superior risk-adjusted outlook for a diversified portfolio.
Table of contents
Companies Overview
Parker-Hannifin and Roper Technologies stand as industrial stalwarts with distinct approaches to growth and innovation.
Parker-Hannifin Corporation: Industrial Motion and Control Leader
Parker-Hannifin dominates the motion and control technologies sector, generating revenue from diversified industrial and aerospace systems. It supplies OEMs and distributors with hydraulic, pneumatic, and electromechanical components, alongside aerospace products like engine systems and fluid conveyance. In 2026, it emphasizes expanding its aerospace systems and industrial product lines to capture broader market segments.
Roper Technologies, Inc.: Software-Driven Industrial Solutions Innovator
Roper Technologies excels by blending software and engineered products across multiple industries, including healthcare, utilities, and finance. Its revenue streams stem from cloud-based software, precision instruments, and specialized hardware. The company’s 2026 strategy centers on enhancing cloud analytics and automation to deepen its footprint in high-growth technology-driven industrial niches.
Strategic Collision: Similarities & Divergences
While both operate in industrial machinery, Parker-Hannifin focuses on hardware-intensive motion control with a strong aerospace presence. Roper pursues a software-driven model emphasizing data analytics and cloud solutions. Their competition centers on industrial innovation—hardware versus software integration. This divergence creates distinct investment profiles: Parker-Hannifin as a capital-intensive industrial powerhouse, Roper as a tech-centric growth play.
Income Statement Comparison
This data dissects the core profitability and scalability of both corporate engines to reveal who dominates the bottom line:
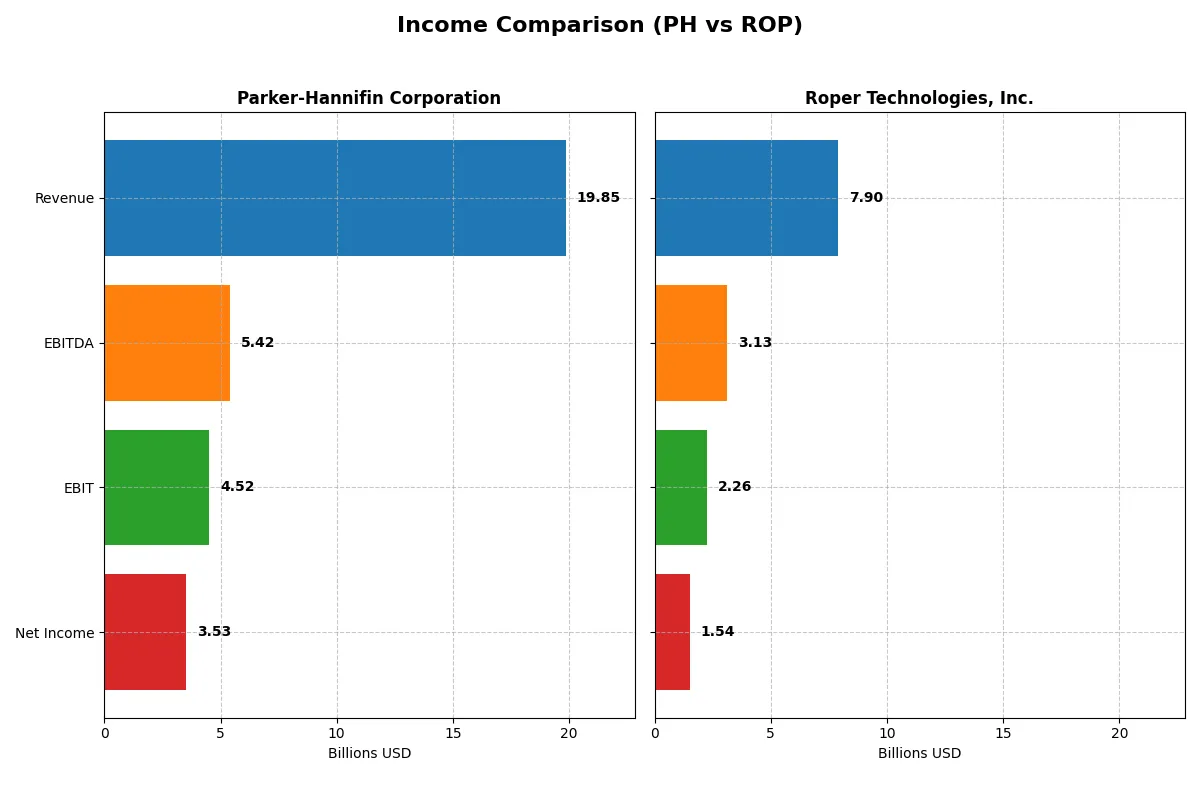
| Metric | Parker-Hannifin Corporation (PH) | Roper Technologies, Inc. (ROP) |
|---|---|---|
| Revenue | 19.85B | 7.90B |
| Cost of Revenue | 12.54B | 2.43B |
| Operating Expenses | 3.26B | 3.24B |
| Gross Profit | 7.32B | 5.47B |
| EBITDA | 5.42B | 3.13B |
| EBIT | 4.52B | 2.26B |
| Interest Expense | 409M | 325M |
| Net Income | 3.53B | 1.54B |
| EPS | 27.52 | 14.31 |
| Fiscal Year | 2025 | 2025 |
Income Statement Analysis: The Bottom-Line Duel
This income statement comparison reveals each company’s operational efficiency and underlying profit-generating strength.
Parker-Hannifin Corporation Analysis
Parker-Hannifin’s revenue rose 38% from 2021 to 2025, with net income doubling over that period. Gross margins hold steady near 37%, while net margins improved to 17.8% in 2025, signaling better cost control. Despite a slight revenue dip last year, EBIT expanded 10%, reflecting strong earnings momentum and operational efficiency.
Roper Technologies, Inc. Analysis
Roper’s revenue expanded 63% over five years, reaching $7.9B in 2025. Its impressive 69% gross margin leads the industry, supporting a robust 19.4% net margin. However, last year’s net margin slipped nearly 12%, and EPS declined slightly, highlighting margin pressure despite solid top-line growth.
Margin Mastery vs. Revenue Traction
Parker-Hannifin delivers consistent margin expansion and double-digit net income growth, while Roper boasts higher margins but recent margin contraction. Parker’s steady profitability and improving margins mark it as the more fundamentally efficient operator. Investors seeking margin stability may find Parker’s profile more attractive.
Financial Ratios Comparison
These vital ratios act as a diagnostic tool to expose the underlying fiscal health, valuation premiums, and capital efficiency of the companies compared below:
| Ratios | Parker-Hannifin (PH) | Roper Technologies (ROP) |
|---|---|---|
| ROE | 25.8% | 7.7% |
| ROIC | 13.7% | 5.6% |
| P/E | 25.4 | 31.1 |
| P/B | 6.55 | 2.40 |
| Current Ratio | 1.19 | 0.52 |
| Quick Ratio | 0.71 | 0.48 |
| D/E | 0.69 | 0.47 |
| Debt-to-Assets | 32.2% | 26.9% |
| Interest Coverage | 9.93 | 6.88 |
| Asset Turnover | 0.67 | 0.23 |
| Fixed Asset Turnover | 6.76 | 50.37 |
| Payout Ratio | 24.4% | 23.1% |
| Dividend Yield | 0.96% | 0.74% |
| Fiscal Year | 2025 | 2025 |
Efficiency & Valuation Duel: The Vital Signs
Ratios act as a company’s DNA, exposing hidden risks and operational excellence that shape investment outcomes.
Parker-Hannifin Corporation
Parker-Hannifin exhibits strong profitability with a 25.8% ROE and a 17.8% net margin, signaling operational efficiency. Its valuation appears stretched, reflected in a high P/E of 25.4 and P/B of 6.55. The company yields a modest 0.96% dividend, favoring shareholder returns through stable payouts over aggressive growth or buybacks.
Roper Technologies, Inc.
Roper shows superior net margin at 19.4% but a weak 7.7% ROE, indicating less effective equity use. Its P/E at 31.1 marks it as expensive relative to earnings. The company maintains a lower dividend yield at 0.74%, with capital allocation favoring debt reduction and steady operational improvements rather than large distributions.
Premium Valuation vs. Operational Safety
Parker-Hannifin balances robust profitability with a stretched valuation, while Roper’s premium P/E contrasts with weaker equity returns. Parker offers a better risk-reward profile for investors prioritizing operational strength. Roper suits those tolerant of valuation premiums seeking growth cushioning through conservative capital structure.
Which one offers the Superior Shareholder Reward?
I see Parker-Hannifin (PH) offers a higher dividend yield near 1.0% with a payout ratio around 24%, supported by strong free cash flow coverage (88%). Roper Technologies (ROP) yields less than 0.8%, with a lower payout ratio near 21%. PH also commits more capital to buybacks, enhancing returns sustainably. ROP’s reinvestment in growth is evident but its lower yield and higher valuation pressure total returns. I conclude PH delivers a superior, more balanced shareholder reward in 2026.
Comparative Score Analysis: The Strategic Profile
The radar chart reveals the fundamental DNA and trade-offs of Parker-Hannifin Corporation and Roper Technologies, Inc., showcasing their strategic financial strengths and vulnerabilities:
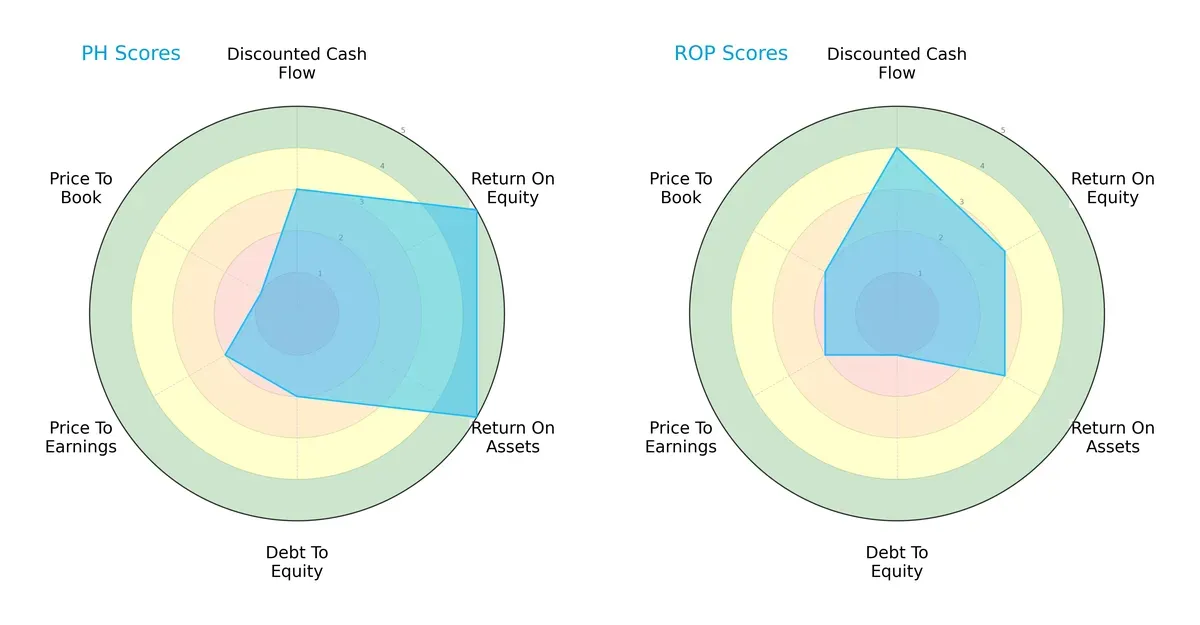
Parker-Hannifin excels in profitability with very favorable ROE and ROA scores (5 each) but lags in valuation metrics, especially the price-to-book score (1). Roper offers a more moderate profitability profile with balanced valuation scores but shows a weaker debt-to-equity position (1). Overall, Parker-Hannifin presents a sharper edge in operational efficiency, while Roper maintains a steadier, though less distinguished, valuation balance.
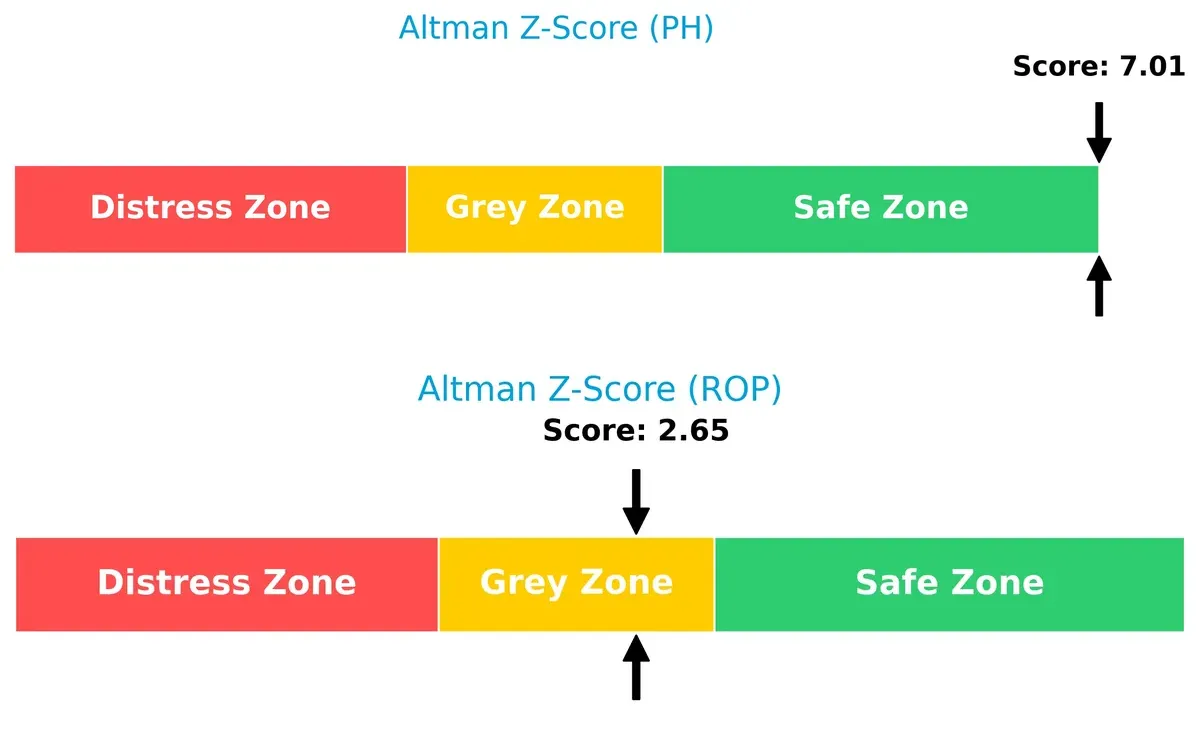
Bankruptcy Risk: Solvency Showdown
Parker-Hannifin’s Altman Z-Score of 7.01 firmly places it in the safe zone, signaling robust long-term solvency. In contrast, Roper’s 2.65 score situates it in the grey zone, indicating moderate bankruptcy risk under current economic conditions:
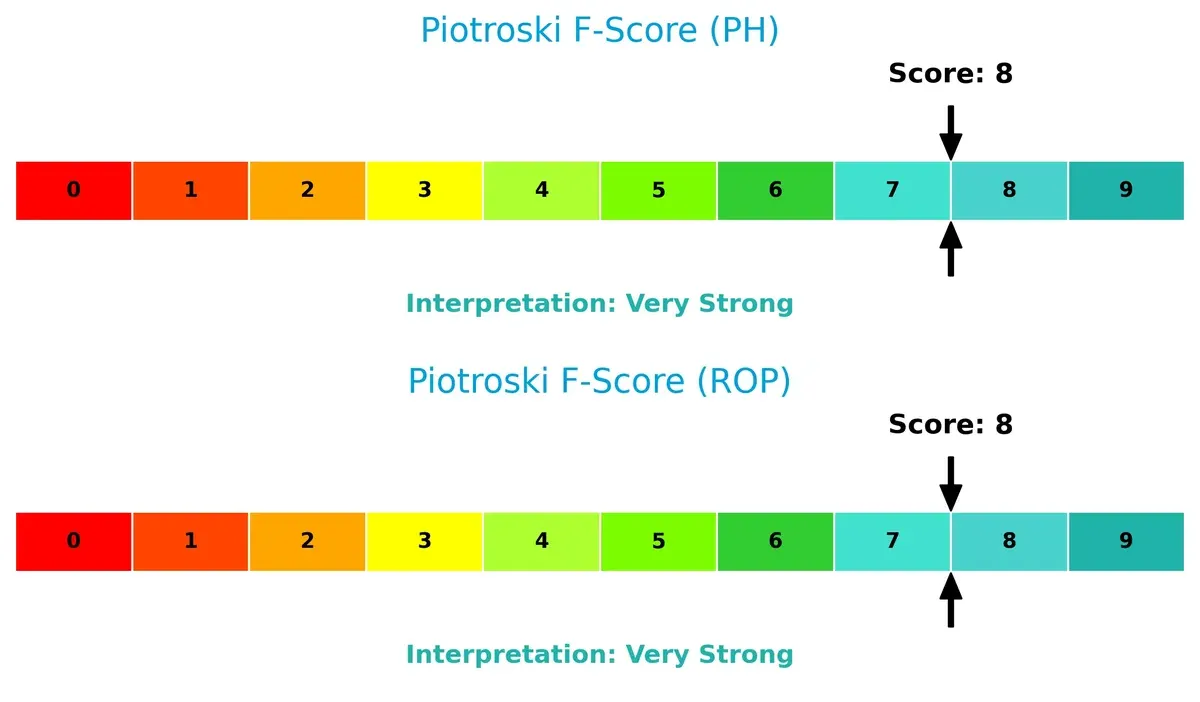
Financial Health: Quality of Operations
Both companies score an 8 on the Piotroski F-Score, reflecting very strong internal financial health and operational quality. Neither shows red flags in profitability, leverage, liquidity, or efficiency metrics:
How are the two companies positioned?
This section dissects the operational DNA of PH and ROP by comparing their revenue distribution and internal strengths and weaknesses. The goal is to confront their economic moats and identify the most resilient competitive advantage today.
Revenue Segmentation: The Strategic Mix
This visual comparison dissects how Parker-Hannifin and Roper Technologies diversify their income streams and where their primary sector bets lie:
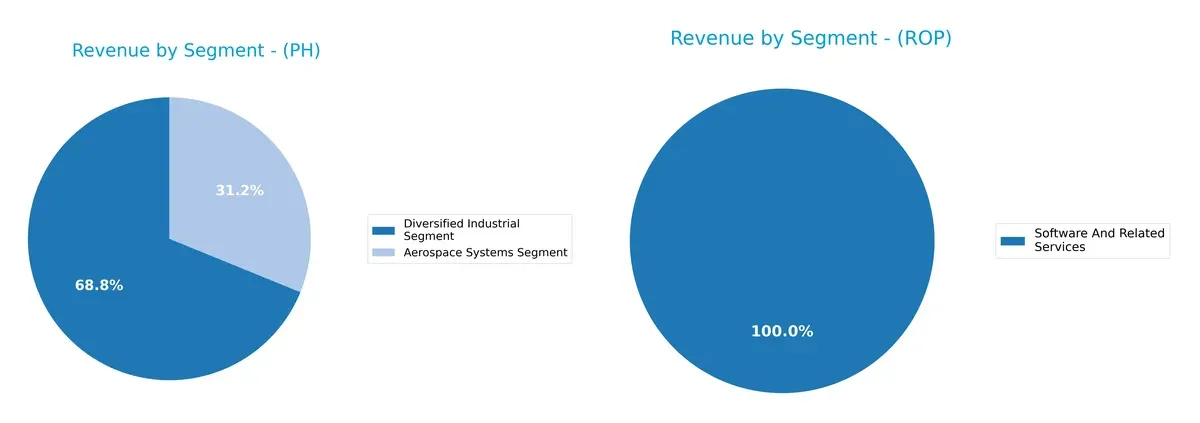
Parker-Hannifin anchors its revenue in two major segments: $13.7B from Diversified Industrial and $6.2B from Aerospace Systems. This concentrated split shows a strong industrial and aerospace foothold, reflecting infrastructure dominance. Roper Technologies pivots on Software and Related Services, generating $10.7B, with smaller contributions from Application Software and Network Systems. Roper’s broader software mix indicates ecosystem lock-in but also increased dependence on tech trends, contrasting Parker-Hannifin’s industrial concentration risk.
Strengths and Weaknesses Comparison
This table compares the strengths and weaknesses of Parker-Hannifin Corporation (PH) and Roper Technologies, Inc. (ROP):
PH Strengths
- Strong profitability with 17.79% net margin
- High ROE at 25.81%
- Favorable ROIC above WACC
- Diversified industrial and aerospace segments
- Significant global presence, especially North America and Europe
- Favorable interest coverage and fixed asset turnover
ROP Strengths
- Highest net margin at 19.44%
- Favorable WACC indicating efficient capital cost
- Favorable debt-to-equity and debt-to-assets ratios
- Exceptional fixed asset turnover at 50.37
- Concentrated software and technology segments with growth potential
- Solid interest coverage despite lower ROE
PH Weaknesses
- Unfavorable valuation metrics (P/E and P/B ratios)
- Low quick ratio signals liquidity concerns
- Dividend yield below 1%
- Moderate current ratio and debt levels
- Neutral asset turnover indicates room for operational improvement
ROP Weaknesses
- Low ROE at 7.73% signals weak equity returns
- Unfavorable P/E ratio at 31.06
- Poor current and quick ratios reflect liquidity risk
- Unfavorable asset turnover at 0.23 limits efficiency
- Dividend yield also low at 0.74%
Both companies display strong profitability but differ in capital efficiency and liquidity profiles. PH’s diversified segments and higher ROE contrast with ROP’s better capital cost management and asset utilization. Liquidity remains a notable risk for ROP, while PH faces valuation and quick ratio pressures.
The Moat Duel: Analyzing Competitive Defensibility
A structural moat protects long-term profits from competition’s relentless erosion. Without it, even market leaders risk margin decay:
Parker-Hannifin Corporation: Engineering Precision & Operational Excellence
Parker-Hannifin’s moat stems from its cost advantage and complex engineered systems. Its ROIC exceeds WACC by 4.4%, signaling strong value creation. Growing profitability and diversified aerospace and industrial markets reinforce its moat in 2026.
Roper Technologies, Inc.: Niche Software & Solutions Ecosystem
Roper’s moat relies on intangible assets and recurring software revenue streams, contrasting Parker’s hardware focus. Despite a slight value destruction (ROIC below WACC), Roper’s ROIC growth hints at improving efficiency and potential software-driven expansion in 2026.
Operational Efficiency vs. Software Intangibles: Who Defends Better?
Parker-Hannifin boasts a wider moat with sustained value creation and operational scale. Roper’s intangible asset moat is promising but less durable currently. Parker is better equipped to defend and grow market share amid industrial cycles.
Which stock offers better returns?
The past year shows stark divergence: Parker-Hannifin surges with accelerating momentum, while Roper Technologies declines amid decelerating bearish pressure.
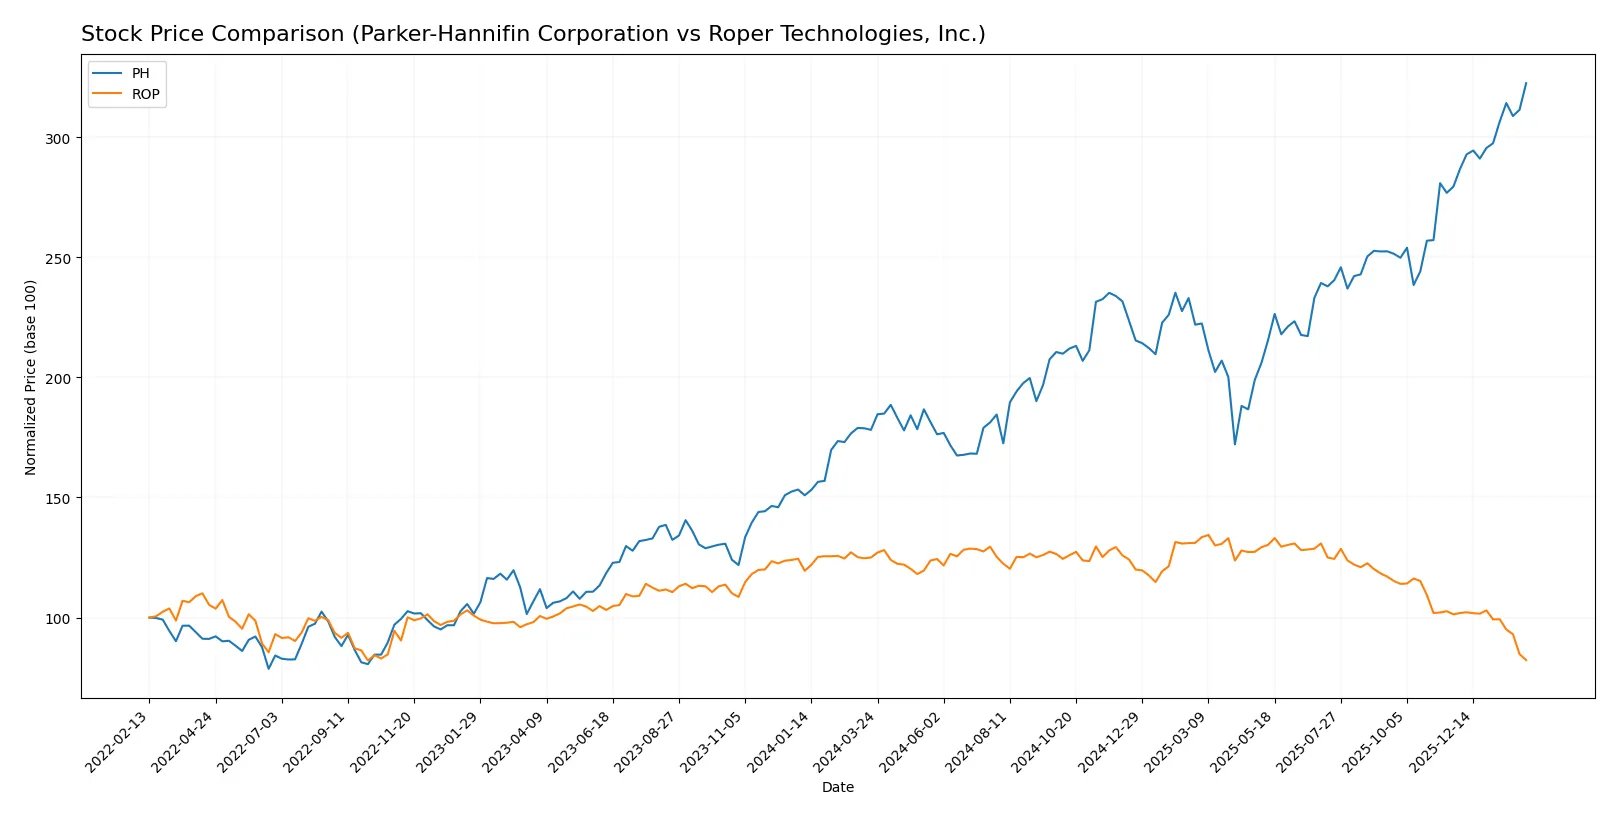
Trend Comparison
Parker-Hannifin’s stock rose 81.0% over the past 12 months, reflecting a strong bullish trend with accelerating gains and a high volatility of 115.73.
Roper Technologies declined 34.17% in the same period, marking a bearish trend with deceleration and moderate volatility of 47.89.
Parker-Hannifin outperformed Roper Technologies significantly, delivering the highest market returns with sustained upward momentum and strong buyer dominance.
Target Prices
Analysts present a moderate upside for both Parker-Hannifin Corporation and Roper Technologies, reflecting cautious optimism.
| Company | Target Low | Target High | Consensus |
|---|---|---|---|
| Parker-Hannifin Corporation | 825 | 1,139 | 995.46 |
| Roper Technologies, Inc. | 365 | 575 | 475.5 |
The consensus targets for Parker-Hannifin and Roper suggest potential price appreciation of roughly 2.5% and 32.5%, respectively, relative to current prices. Analysts expect stronger growth from Roper amid industrial sector dynamics.

Don’t Let Luck Decide Your Entry Point
Optimize your entry points with our advanced ProRealTime indicators. You’ll get efficient buy signals with precise price targets for maximum performance. Start outperforming now!
How do institutions grade them?
Below are the recent institutional grades for Parker-Hannifin Corporation and Roper Technologies, Inc.:
Parker-Hannifin Corporation Grades
The following table summarizes the latest grades assigned by notable firms to Parker-Hannifin Corporation.
| Grading Company | Action | New Grade | Date |
|---|---|---|---|
| Jefferies | maintain | Buy | 2026-01-30 |
| Barclays | maintain | Overweight | 2026-01-30 |
| Stifel | maintain | Hold | 2026-01-30 |
| JP Morgan | maintain | Overweight | 2026-01-30 |
| Wells Fargo | maintain | Overweight | 2026-01-30 |
| Citigroup | maintain | Buy | 2026-01-30 |
| Morgan Stanley | maintain | Equal Weight | 2026-01-14 |
Roper Technologies, Inc. Grades
The following table presents recent institutional grades for Roper Technologies, Inc.
| Grading Company | Action | New Grade | Date |
|---|---|---|---|
| Goldman Sachs | maintain | Neutral | 2026-01-29 |
| Argus Research | downgrade | Hold | 2026-01-28 |
| Mizuho | maintain | Underperform | 2026-01-28 |
| RBC Capital | maintain | Sector Perform | 2026-01-28 |
| Stifel | downgrade | Hold | 2026-01-28 |
| Citigroup | maintain | Buy | 2026-01-28 |
| JP Morgan | maintain | Underweight | 2026-01-28 |
| Truist Securities | maintain | Buy | 2026-01-28 |
| Barclays | maintain | Underweight | 2026-01-28 |
| Oppenheimer | downgrade | Perform | 2026-01-28 |
Which company has the best grades?
Parker-Hannifin consistently earns Buy and Overweight ratings from top firms, signaling stronger institutional confidence. Roper Technologies shows mixed to cautious grades, including downgrades and Underperform ratings. This divergence may influence investor sentiment and valuation comparisons.
Risks specific to each company
The following categories identify critical pressure points and systemic threats facing Parker-Hannifin Corporation and Roper Technologies in the 2026 market environment:
1. Market & Competition
Parker-Hannifin Corporation
- Faces intense competition in diversified industrial and aerospace segments with cyclical demand risks.
Roper Technologies, Inc.
- Competes in software and engineered products with rapid tech evolution and niche market pressures.
2. Capital Structure & Debt
Parker-Hannifin Corporation
- Moderate leverage with debt-to-assets at 32.16%, interest coverage strong at 11x.
Roper Technologies, Inc.
- Lower leverage at 26.9%, but weaker interest coverage at 7x suggests tighter debt servicing capacity.
3. Stock Volatility
Parker-Hannifin Corporation
- Beta of 1.24 indicates above-market volatility, reflecting sensitivity to industrial cycles.
Roper Technologies, Inc.
- Beta of 0.93 shows below-market volatility, offering somewhat more stability to investors.
4. Regulatory & Legal
Parker-Hannifin Corporation
- Aerospace exposure increases regulatory scrutiny risk and compliance costs.
Roper Technologies, Inc.
- Software and healthcare segments face data privacy and compliance risks, but less aerospace-related regulation.
5. Supply Chain & Operations
Parker-Hannifin Corporation
- Global supply chain exposed to raw material price swings and logistical disruptions.
Roper Technologies, Inc.
- Diverse product lines and software reduce raw material dependency but require complex operational coordination.
6. ESG & Climate Transition
Parker-Hannifin Corporation
- Industrial manufacturing faces pressure to reduce carbon footprint and improve sustainability.
Roper Technologies, Inc.
- Software focus allows more agile ESG adaptation but increasing pressure on data center energy use.
7. Geopolitical Exposure
Parker-Hannifin Corporation
- Exposure to international aerospace and industrial markets risks from trade tensions and tariffs.
Roper Technologies, Inc.
- More US-centric with less direct geopolitical risk but vulnerable to software export controls.
Which company shows a better risk-adjusted profile?
Parker-Hannifin’s key risk lies in cyclical aerospace demand and higher stock volatility. Roper’s primary challenge is weaker financial leverage and operational complexity. Parker-Hannifin’s strong interest coverage and Altman Z-score in the safe zone suggest a more resilient risk profile. Meanwhile, Roper’s grey zone Z-score and lower ROIC highlight caution despite stable stock volatility. Recent data show Parker’s debt servicing strength contrasts with Roper’s tighter coverage, tipping the balance in Parker-Hannifin’s favor for risk-adjusted stability.
Final Verdict: Which stock to choose?
Parker-Hannifin Corporation’s superpower lies in its robust value creation, demonstrated by a very favorable moat with a ROIC well above WACC and steadily growing profitability. Its point of vigilance is the stretched valuation multiples and moderate liquidity ratios. It suits investors targeting aggressive growth with an appetite for cyclical industrial exposure.
Roper Technologies benefits from a strategic moat anchored in recurring revenue streams and high gross margins, offering a safety buffer compared to Parker-Hannifin’s cyclicality. However, it faces value destruction concerns given its ROIC below WACC and weaker short-term liquidity. It fits well in GARP portfolios focused on steady income and moderate growth.
If you prioritize sustainable capital efficiency and growth momentum, Parker-Hannifin outshines with superior profitability and favorable financial health. However, if you seek stability and recurring revenue safety at a reasonable premium, Roper offers better stability despite some value erosion risks. Both profiles demand careful risk management given their contrasting fundamentals.
Disclaimer: Investment carries a risk of loss of initial capital. The past performance is not a reliable indicator of future results. Be sure to understand risks before making an investment decision.
Go Further
I encourage you to read the complete analyses of Parker-Hannifin Corporation and Roper Technologies, Inc. to enhance your investment decisions: