Home > Comparison > Industrials > PH vs ROK
The strategic rivalry between Parker-Hannifin Corporation and Rockwell Automation, Inc. shapes the industrial machinery sector’s evolution. Parker-Hannifin operates as a diversified industrial and aerospace systems powerhouse, while Rockwell Automation focuses on automation and digital transformation solutions. This clash highlights a contrast between broad manufacturing expertise and specialized tech-driven innovation. This analysis aims to identify which trajectory delivers superior risk-adjusted returns for a diversified portfolio in today’s complex industrial landscape.
Table of contents
Companies Overview
Parker-Hannifin and Rockwell Automation drive innovation in the industrial machinery sector with distinct approaches.
Parker-Hannifin Corporation: Global Leader in Motion and Control Technologies
Parker-Hannifin dominates the motion and control technologies market, generating revenue from diverse industrial and aerospace systems. Its two segments cover sealing, filtration, and hydraulic components, serving OEMs and end users worldwide. In 2026, the company focuses on expanding its aerospace systems and enhancing precision fluid control solutions, leveraging a broad product portfolio to maintain its competitive edge.
Rockwell Automation, Inc.: Pioneer in Industrial Automation and Digital Transformation
Rockwell Automation specializes in industrial automation and digital solutions, combining hardware, software, and lifecycle services to optimize manufacturing processes. Its three segments deliver intelligent devices, control software, and consulting services. The firm’s strategic priority in 2026 involves accelerating digital transformation adoption and expanding its software capabilities to capture growth across discrete and process industries globally.
Strategic Collision: Similarities & Divergences
Both companies address industrial customers but diverge sharply in philosophy: Parker-Hannifin emphasizes hardware-based motion control, while Rockwell pursues an integrated digital ecosystem. They compete primarily in automation and control markets but target different niches—Parker with physical components, Rockwell with software-driven solutions. Their investment profiles contrast hardware stability against digital innovation, appealing to distinct risk appetites and growth expectations.
Income Statement Comparison
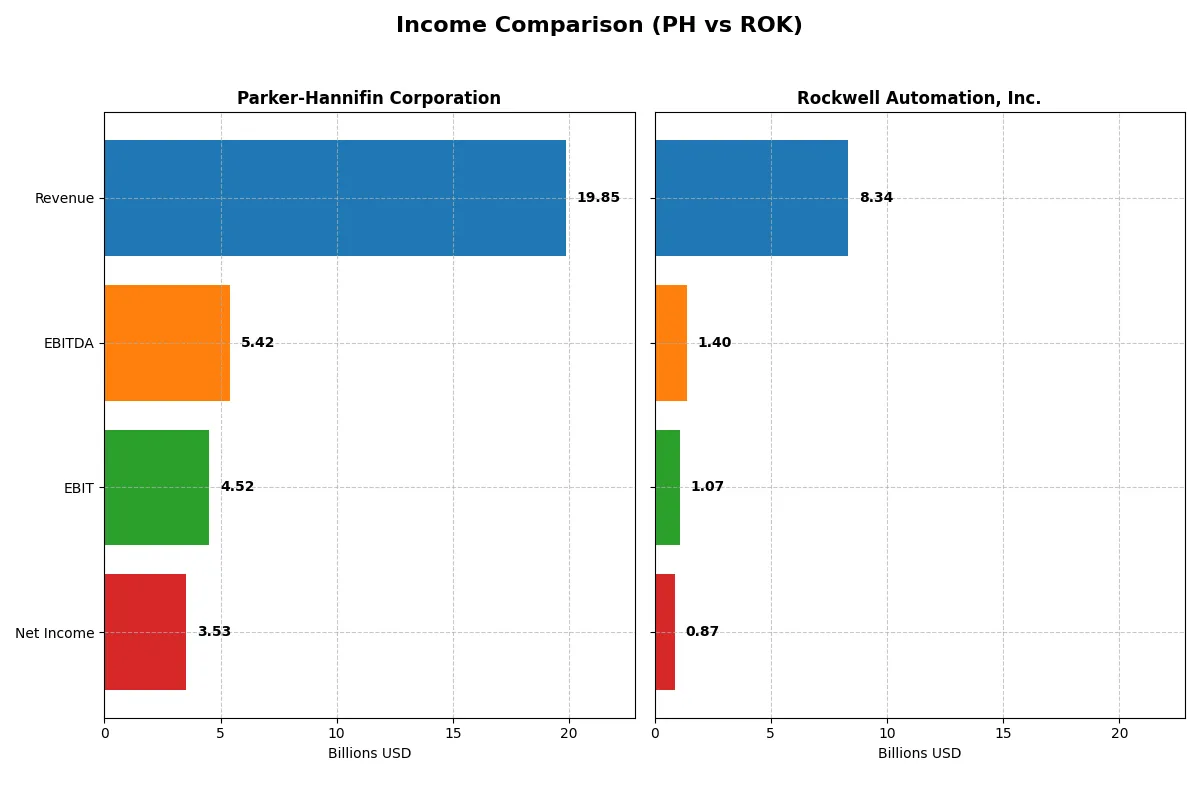
This data dissects the core profitability and scalability of both corporate engines to reveal who dominates the bottom line:
| Metric | Parker-Hannifin Corporation (PH) | Rockwell Automation, Inc. (ROK) |
|---|---|---|
| Revenue | 19.85B | 8.34B |
| Cost of Revenue | 12.54B | 4.33B |
| Operating Expenses | 3.26B | 2.59B |
| Gross Profit | 7.32B | 4.02B |
| EBITDA | 5.42B | 1.40B |
| EBIT | 4.52B | 1.07B |
| Interest Expense | 409M | 156M |
| Net Income | 3.53B | 867M |
| EPS | 27.52 | 7.69 |
| Fiscal Year | 2025 | 2025 |
Income Statement Analysis: The Bottom-Line Duel
This income statement comparison exposes which company operates its business with superior profitability and growth efficiency over recent years.
Parker-Hannifin Corporation Analysis
Parker-Hannifin’s revenue grew steadily from 14.3B in 2021 to nearly 19.9B in 2024, with a slight dip to 19.85B in 2025. Net income surged from 1.75B in 2021 to 3.53B in 2025, reflecting robust margin expansion. Gross margin holds firm near 37%, while net margin climbed to 17.8%, signaling strong operational leverage and improving profitability momentum.
Rockwell Automation, Inc. Analysis
Rockwell Automation’s revenue rose from 7.0B in 2021 to 8.3B in 2025, showing modest top-line growth. Net income, however, declined from 1.36B in 2021 to 867M in 2025, dragging net margin down to 10.4%. Despite a superior gross margin of 48%, Rockwell faces pressure on EBIT and net margins, indicating margin compression and weakening bottom-line efficiency.
Margin Strength vs. Revenue Growth
Parker-Hannifin outperforms Rockwell Automation with double the net income and superior margin expansion despite similar revenue growth trends. Parker’s ability to convert sales into earnings demonstrates stronger capital allocation and operational control. Investors seeking margin resilience and growth should note Parker’s superior profitability profile compared to Rockwell’s margin challenges.
Financial Ratios Comparison
These vital ratios act as a diagnostic tool to expose the underlying fiscal health, valuation premiums, and capital efficiency of the companies analyzed below:
| Ratios | Parker-Hannifin (PH) | Rockwell Automation (ROK) |
|---|---|---|
| ROE | 25.81% | 23.78% |
| ROIC | 13.69% | 13.71% |
| P/E | 25.38 | 45.33 |
| P/B | 6.55 | 10.78 |
| Current Ratio | 1.19 | 1.14 |
| Quick Ratio | 0.71 | 0.77 |
| D/E (Debt-to-Equity) | 0.69 | 1.00 |
| Debt-to-Assets | 32.16% | 32.51% |
| Interest Coverage | 9.93 | 9.12 |
| Asset Turnover | 0.67 | 0.74 |
| Fixed Asset Turnover | 6.76 | 6.95 |
| Payout Ratio | 24.38% | 68.01% |
| Dividend Yield | 0.96% | 1.50% |
| Fiscal Year | 2025 | 2025 |
Efficiency & Valuation Duel: The Vital Signs
Ratios act as a company’s DNA, unveiling hidden risks and operational strengths that raw numbers often disguise.
Parker-Hannifin Corporation
Parker-Hannifin delivers robust profitability with a 25.8% ROE and a strong 17.8% net margin, signaling operational efficiency. However, its valuation appears stretched, trading at a 25.4 P/E and a high 6.55 P/B ratio. Dividend yield is modest at 0.96%, reflecting a cautious shareholder return approach amid reinvestment in fixed asset turnover and interest coverage.
Rockwell Automation, Inc.
Rockwell Automation posts solid profitability with a 23.8% ROE and a decent 10.4% net margin. Its valuation is more stretched, marked by a 45.3 P/E and 10.8 P/B ratio, suggesting premium pricing. The company offers a higher 1.5% dividend yield, balancing shareholder returns with a consistent reinvestment in R&D, evident in a superior fixed asset turnover and interest coverage.
Valuation Stretch Meets Operational Strength
Both firms show slightly favorable ratio profiles, but Parker-Hannifin balances strong returns and operational quality better at a more reasonable valuation. Rockwell’s premium multiples suit those favoring dividend income and growth reinvestment, while Parker-Hannifin fits investors prioritizing efficiency and moderate valuation risk.
Which one offers the Superior Shareholder Reward?
I compare Parker-Hannifin (PH) and Rockwell Automation (ROK) on dividends and buybacks. PH yields ~0.96% with a 24% payout ratio, supported by robust free cash flow (26B FCF per share coverage). ROK offers a higher 1.5–1.8% yield but pays out 39–68% of earnings, raising sustainability concerns. PH’s buybacks appear steady, enhancing shareholder value with prudent capital allocation. ROK’s higher payout ratio and elevated valuation multiples (P/E ~45 vs. PH ~25) suggest riskier distribution. I conclude PH delivers a more sustainable, superior total return profile in 2026.
Comparative Score Analysis: The Strategic Profile
The radar chart reveals the fundamental DNA and trade-offs of Parker-Hannifin Corporation and Rockwell Automation, Inc., highlighting their strategic financial strengths and vulnerabilities:
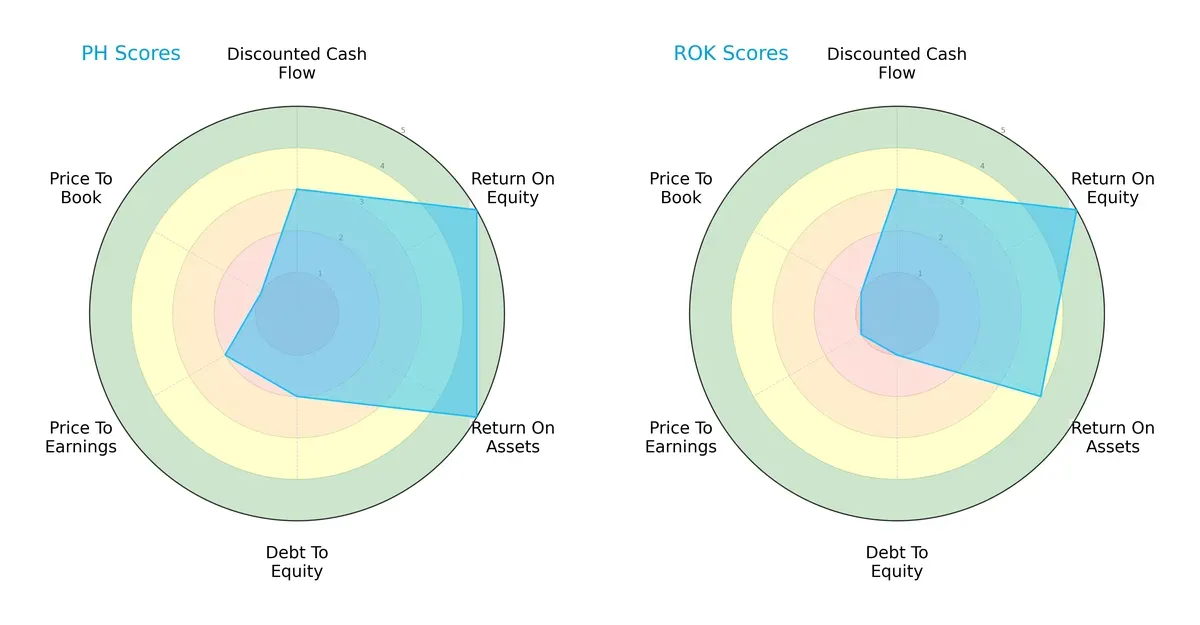
Parker-Hannifin shows a balanced profile with top scores in ROE (5) and ROA (5), signaling superior profitability and asset efficiency. Rockwell matches Parker-Hannifin in ROE (5) but slightly lags in ROA (4). Parker-Hannifin’s moderate Debt/Equity (2) contrasts with Rockwell’s weaker leverage position (1). Both firms face valuation challenges, but Parker-Hannifin’s Price/Earnings (2) is more favorable than Rockwell’s (1). Overall, Parker-Hannifin maintains a more diversified financial edge, while Rockwell leans heavily on equity returns despite higher financial risk.
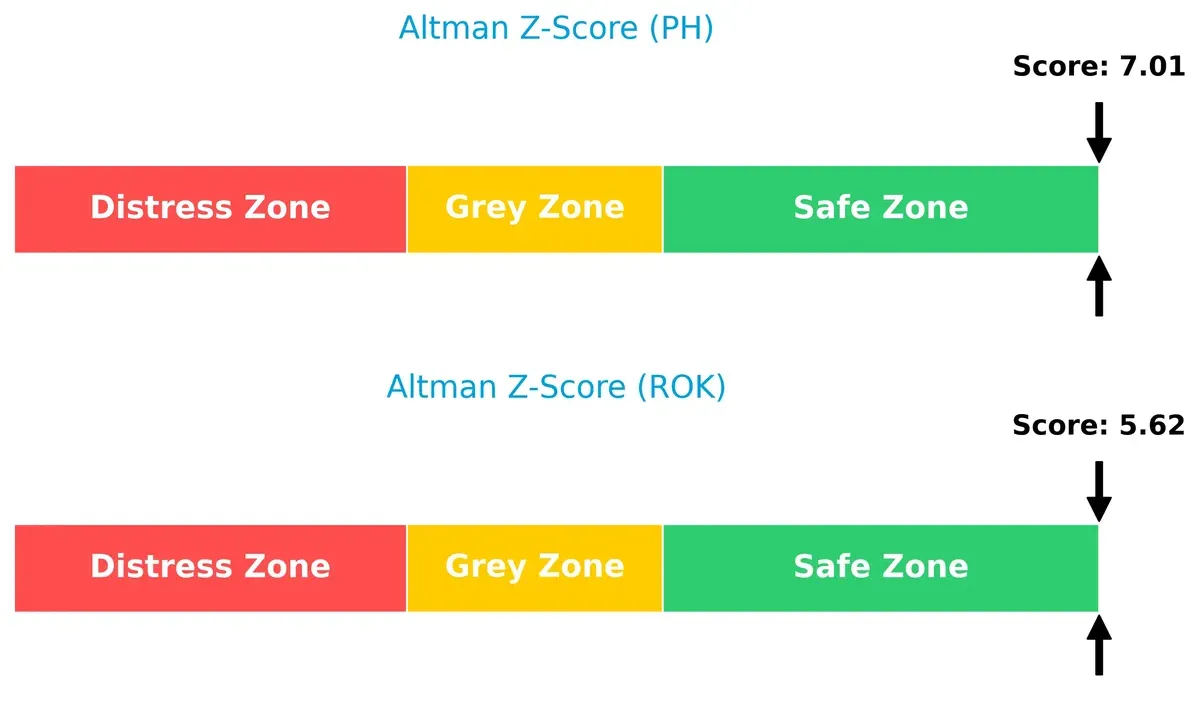
Bankruptcy Risk: Solvency Showdown
Both firms sit comfortably in the safe zone with Altman Z-Scores of 7.01 for Parker-Hannifin and 5.62 for Rockwell Automation, confirming strong solvency and low bankruptcy risk in this cycle:
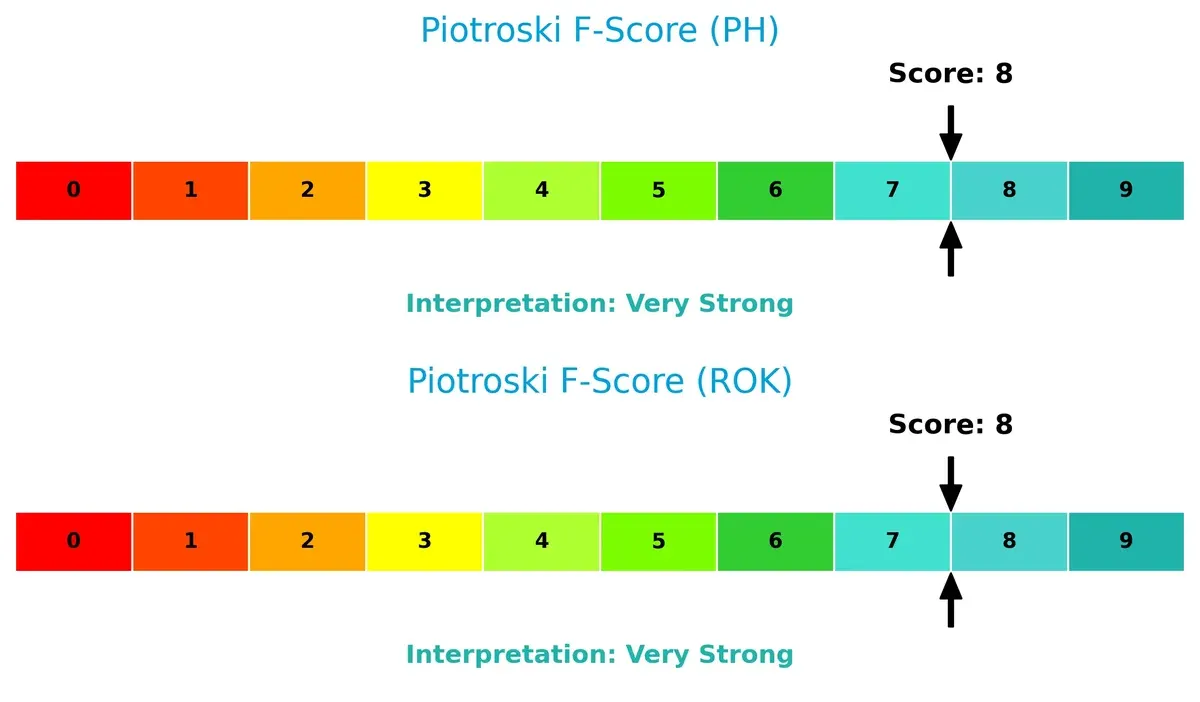
Financial Health: Quality of Operations
Both companies achieve a robust Piotroski F-Score of 8, demonstrating very strong financial health and operational quality. Neither shows red flags in profitability, leverage, or liquidity metrics:
How are the two companies positioned?
This section dissects the operational DNA of PH and ROK by comparing their revenue distribution by segment and internal dynamics. The final objective is to confront their economic moats to identify which model offers the most resilient, sustainable competitive advantage today.
Revenue Segmentation: The Strategic Mix
This visual comparison dissects how Parker-Hannifin and Rockwell Automation diversify their income streams and where their primary sector bets lie:
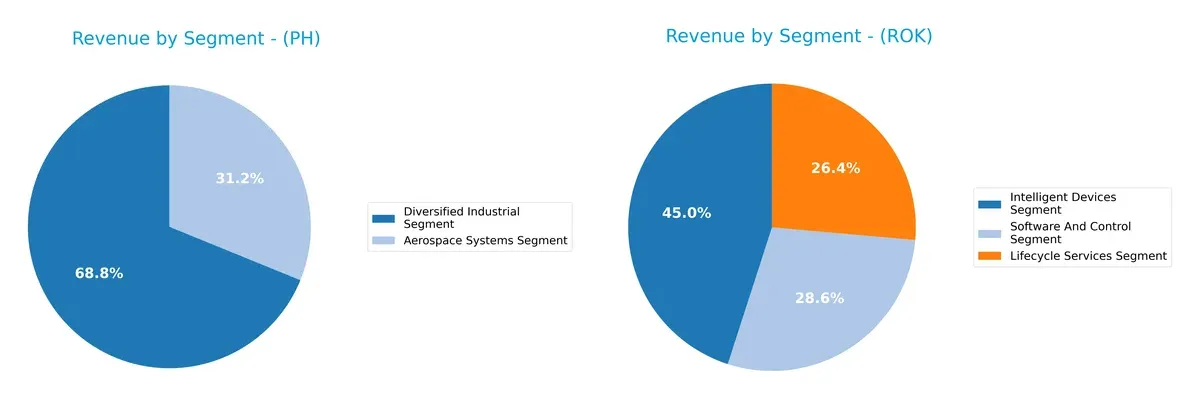
Parker-Hannifin anchors 6.2B in Aerospace Systems and 13.7B in Diversified Industrial, showing a clear dominance in industrials. Rockwell Automation spreads 3.8B, 2.4B, and 2.2B across Intelligent Devices, Software, and Lifecycle Services, revealing a more balanced mix. Parker-Hannifin’s concentration in industrial segments risks cyclicality but benefits from infrastructure scale. Rockwell’s diversified tech portfolio reduces dependency on any single market, enhancing resilience.
Strengths and Weaknesses Comparison
This table compares the Strengths and Weaknesses of Parker-Hannifin Corporation and Rockwell Automation, Inc.:
PH Strengths
- Diverse industrial and aerospace segments
- Strong net margin at 17.79%
- High ROE of 25.81%
- Favorable ROIC above WACC
- Solid interest coverage ratio of 11.04
- Robust fixed asset turnover ratio
ROK Strengths
- Multiple segments including intelligent devices, software, and lifecycle services
- Favorable ROIC comparable to PH
- Strong ROE at 23.78%
- Favorable interest coverage of 6.88
- Slightly higher asset turnover than PH
- Dividend yield neutral at 1.5%
PH Weaknesses
- Elevated P/E at 25.38 and P/B at 6.55 considered unfavorable
- Quick ratio low at 0.71 signals liquidity risk
- Dividend yield low at 0.96%
- Neutral current ratio at 1.19
- Debt-to-assets moderate at 32.16%
- Asset turnover neutral at 0.67
ROK Weaknesses
- High P/E of 45.33 and P/B at 10.78
- WACC unfavorable at 10.53% exceeding ROIC
- Quick ratio low at 0.77
- Debt-to-assets at 32.51% neutral
- Interest coverage lower than PH at 6.88
- Current ratio neutral at 1.14
Both companies show balanced strengths in profitability and asset efficiency with slightly favorable overall financial profiles. PH’s stronger liquidity contrasts with ROK’s heavier valuation multiples and higher cost of capital, suggesting different strategic priorities and risk exposures.
The Moat Duel: Analyzing Competitive Defensibility
A structural moat is the essential barrier preserving long-term profits from relentless competitive pressures. Here’s how Parker-Hannifin and Rockwell Automation stack up:
Parker-Hannifin Corporation: Diversified Industrial Control Moat
Parker-Hannifin’s moat stems from its broad product portfolio and deep OEM relationships, reflected in a robust ROIC 4.4% above WACC and stable 22.75% EBIT margins. New aerospace and industrial tech in 2026 could further entrench its leadership.
Rockwell Automation, Inc.: Digital Automation Ecosystem Moat
Rockwell’s moat relies on integrated hardware-software solutions creating sticky customer switching costs, supported by a strong ROIC growth of 77%, though margins trail Parker-Hannifin. Expansion in digital twin and lifecycle services offers upside amid rising automation demand.
Industrial Giants’ Moats: Diversification vs. Digital Integration
Parker-Hannifin’s wider moat benefits from diversified markets and margin stability, while Rockwell’s deeper digital integration shows rapid ROIC growth but lower margin resilience. Parker-Hannifin appears better positioned to defend its market share through broad industrial reach.
Which stock offers better returns?
The stock prices of Parker-Hannifin and Rockwell Automation reveal strong upward momentum over the past year, with both showing accelerating bullish trends and notable price appreciation.
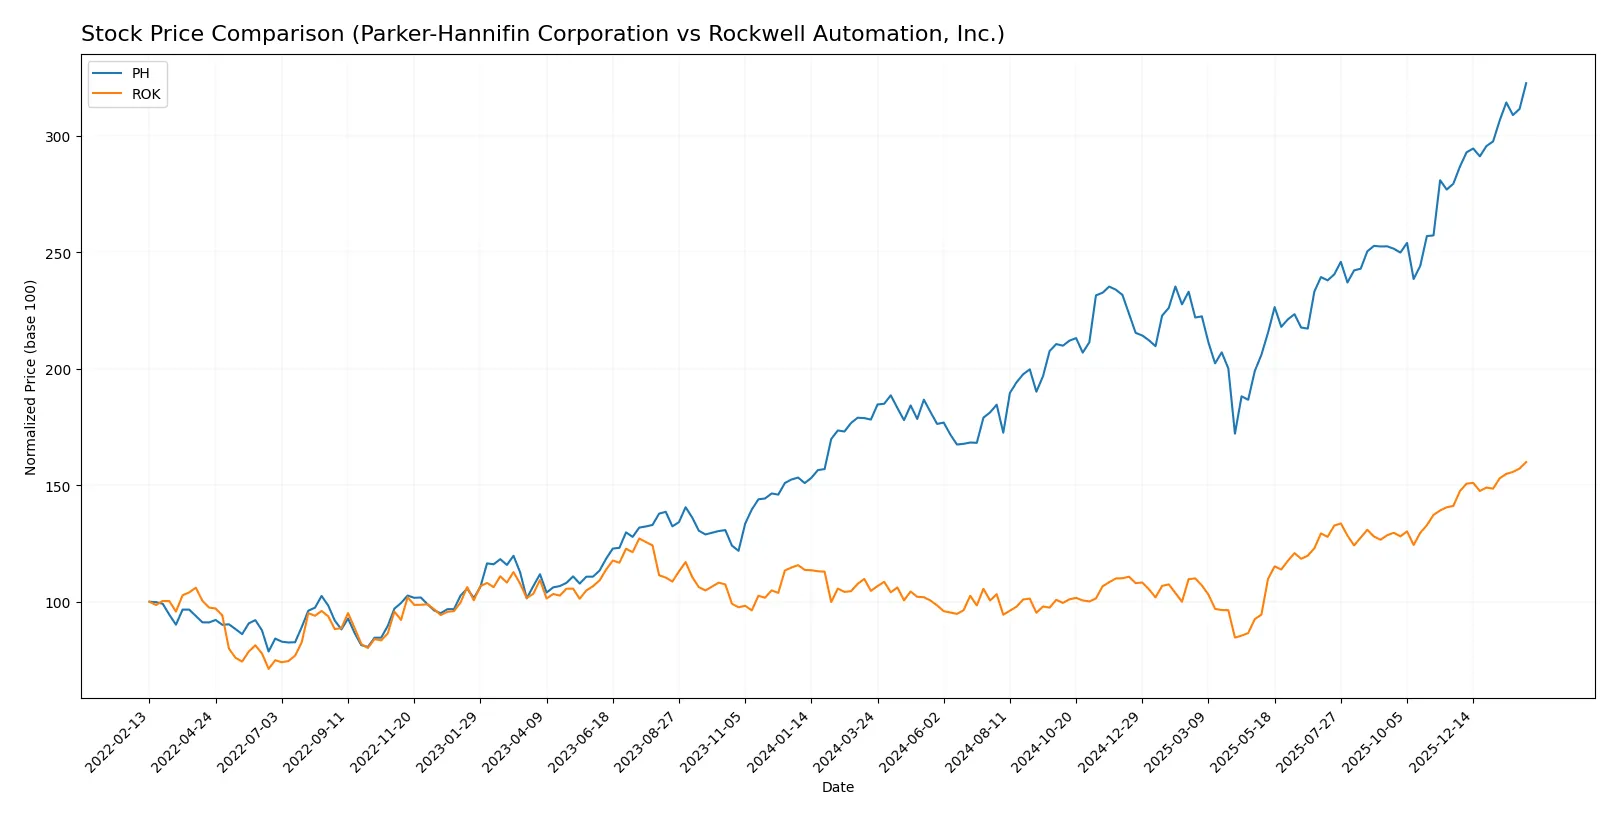
Trend Comparison
Parker-Hannifin’s stock rose 81.0% over the past 12 months, reflecting a bullish trend with accelerating gains and a high volatility level indicated by a 115.73 std deviation.
Rockwell Automation’s stock increased 52.79% in the same period, also bullish with acceleration, but showing lower volatility at 50.2 std deviation compared to Parker-Hannifin.
Between the two, Parker-Hannifin delivered the highest market performance with stronger price appreciation and greater momentum over the past year.
Target Prices
Analysts present a clear bullish consensus on Parker-Hannifin Corporation and Rockwell Automation, Inc.
| Company | Target Low | Target High | Consensus |
|---|---|---|---|
| Parker-Hannifin Corporation | 825 | 1,139 | 995.46 |
| Rockwell Automation, Inc. | 380 | 470 | 421.57 |
The target consensus for Parker-Hannifin stands slightly above its current price of 970, signaling moderate upside potential. Rockwell Automation’s consensus target also suggests room for appreciation beyond its current 429 price.

Don’t Let Luck Decide Your Entry Point
Optimize your entry points with our advanced ProRealTime indicators. You’ll get efficient buy signals with precise price targets for maximum performance. Start outperforming now!
How do institutions grade them?
Parker-Hannifin Corporation Grades
Here are the recent grades from reputable financial institutions for Parker-Hannifin Corporation:
| Grading Company | Action | New Grade | Date |
|---|---|---|---|
| Jefferies | Maintain | Buy | 2026-01-30 |
| Barclays | Maintain | Overweight | 2026-01-30 |
| Stifel | Maintain | Hold | 2026-01-30 |
| JP Morgan | Maintain | Overweight | 2026-01-30 |
| Wells Fargo | Maintain | Overweight | 2026-01-30 |
| Citigroup | Maintain | Buy | 2026-01-30 |
| Stifel | Maintain | Hold | 2026-01-23 |
| JP Morgan | Maintain | Overweight | 2026-01-16 |
| Morgan Stanley | Maintain | Equal Weight | 2026-01-14 |
| Barclays | Maintain | Overweight | 2026-01-07 |
Rockwell Automation, Inc. Grades
Below are the latest ratings from established grading firms for Rockwell Automation, Inc.:
| Grading Company | Action | New Grade | Date |
|---|---|---|---|
| Oppenheimer | Downgrade | Perform | 2026-01-20 |
| JP Morgan | Maintain | Neutral | 2026-01-16 |
| Morgan Stanley | Maintain | Overweight | 2026-01-13 |
| Barclays | Maintain | Overweight | 2026-01-07 |
| Wells Fargo | Maintain | Equal Weight | 2026-01-07 |
| Goldman Sachs | Upgrade | Neutral | 2025-12-16 |
| Jefferies | Maintain | Buy | 2025-12-10 |
| Citigroup | Maintain | Buy | 2025-12-08 |
| Barclays | Maintain | Overweight | 2025-12-04 |
| Baird | Maintain | Outperform | 2025-11-21 |
Which company has the best grades?
Parker-Hannifin consistently holds “Buy” and “Overweight” ratings, signaling stronger institutional confidence. Rockwell Automation shows more mixed opinions, including a recent downgrade. Investors may interpret Parker-Hannifin’s steadier grades as a sign of relative stability.
Risks specific to each company
The following categories identify the critical pressure points and systemic threats facing both firms in the 2026 market environment:
1. Market & Competition
Parker-Hannifin Corporation
- Diversified industrial and aerospace markets face moderate competition; solid product diversification supports resilience.
Rockwell Automation, Inc.
- Focus on automation and digital transformation faces intense competition from tech-driven entrants and legacy industrial firms.
2. Capital Structure & Debt
Parker-Hannifin Corporation
- Debt-to-equity at 0.69 signals moderate leverage; interest coverage strong at 11.04, reflecting stable debt servicing capacity.
Rockwell Automation, Inc.
- Debt-to-equity equals 1.0, indicating higher leverage; interest coverage weaker at 6.88, raising refinancing risk concerns.
3. Stock Volatility
Parker-Hannifin Corporation
- Beta of 1.242 indicates moderate volatility relative to the market, offering balanced risk exposure.
Rockwell Automation, Inc.
- Beta of 1.527 suggests higher stock price sensitivity and greater risk in volatile market conditions.
4. Regulatory & Legal
Parker-Hannifin Corporation
- Aerospace exposure subjects the company to stringent safety and export regulations globally.
Rockwell Automation, Inc.
- Digital and industrial automation sectors face increasing scrutiny on data security and compliance standards.
5. Supply Chain & Operations
Parker-Hannifin Corporation
- Reliance on global manufacturing and distribution networks poses risks from geopolitical disruptions and material shortages.
Rockwell Automation, Inc.
- Complex supply chains for hardware and software components expose the firm to component scarcity and operational delays.
6. ESG & Climate Transition
Parker-Hannifin Corporation
- Moderate ESG risks with opportunities in energy-efficient and sustainable industrial solutions.
Rockwell Automation, Inc.
- Greater pressure to meet ESG standards due to digital footprint and customer expectations in green automation.
7. Geopolitical Exposure
Parker-Hannifin Corporation
- Global footprint includes aerospace defense contracts, sensitive to U.S. export controls and international tensions.
Rockwell Automation, Inc.
- International markets expose Rockwell to trade conflicts and regulatory divergences impacting technology exports.
Which company shows a better risk-adjusted profile?
Parker-Hannifin’s most impactful risk lies in aerospace regulatory and geopolitical exposure, but its moderate leverage and stable interest coverage enhance financial resilience. Rockwell Automation faces its largest risk in high leverage and stock volatility amid competitive digital transformation pressures. I see Parker-Hannifin showing a stronger risk-adjusted profile, supported by a safer Altman Z-score (7.0 vs. 5.6) and superior interest coverage, underscoring better financial stability amid 2026 market uncertainties.
Final Verdict: Which stock to choose?
Parker-Hannifin’s superpower lies in its robust capital efficiency and consistent value creation, demonstrated by a growing ROIC well above its cost of capital. Its point of vigilance is a modestly stretched valuation and a quick ratio below 1, which signals liquidity caution. This stock fits well in an Aggressive Growth portfolio seeking durable profitability.
Rockwell Automation commands a strategic moat through its strong recurring revenue and high gross margins, supported by a very favorable ROIC trend. Compared to Parker-Hannifin, it shows a safer balance sheet but carries a higher valuation premium. It aligns better with a GARP (Growth at a Reasonable Price) strategy targeting steady earnings growth with income stability.
If you prioritize aggressive capital efficiency and superior profitability growth, Parker-Hannifin outshines as the compelling choice due to its superior ROIC spread and income growth. However, if you seek a more stable income profile with a strong recurring revenue moat, Rockwell Automation offers better stability despite commanding a premium valuation. Each presents distinct scenarios depending on your risk tolerance and growth expectations.
Disclaimer: Investment carries a risk of loss of initial capital. The past performance is not a reliable indicator of future results. Be sure to understand risks before making an investment decision.
Go Further
I encourage you to read the complete analyses of Parker-Hannifin Corporation and Rockwell Automation, Inc. to enhance your investment decisions: