Home > Comparison > Industrials > PH vs PNR
The strategic rivalry between Parker-Hannifin Corporation and Pentair plc shapes the industrial machinery sector’s evolution. Parker-Hannifin operates as a diversified industrial and aerospace systems powerhouse, while Pentair specializes in water solutions with consumer and industrial fluid treatment focus. This head-to-head contrasts scale and diversification against niche specialization. My analysis will reveal which corporate trajectory offers superior risk-adjusted returns for a well-rounded industrials portfolio.
Table of contents
Companies Overview
Parker-Hannifin and Pentair are key players in industrial machinery and water solutions markets worldwide.
Parker-Hannifin Corporation: Global Leader in Motion and Control Technologies
Parker-Hannifin dominates the industrial machinery sector with a diversified product portfolio spanning motion and control technologies. Its core revenue derives from two segments: diversified industrial products and aerospace systems. In 2026, the company focuses heavily on expanding its aerospace systems and enhancing precision control solutions for industrial applications.
Pentair plc: Specialist in Water Solutions and Fluid Technologies
Pentair serves the global water solutions market, generating revenue through consumer and industrial segments. Its product range includes pool equipment, water filtration, and fluid treatment technologies. The company’s 2026 strategy concentrates on innovating advanced membrane filtration and expanding commercial water management systems.
Strategic Collision: Similarities & Divergences
Both firms compete in industrial machinery but adopt different approaches: Parker-Hannifin emphasizes a broad, integrated product ecosystem, while Pentair targets niche water treatment technologies. Their primary battleground is industrial fluid control and filtration. Investors face distinct profiles: Parker-Hannifin offers scale and aerospace exposure; Pentair presents specialization in water solutions with growth in environmental technologies.
Income Statement Comparison
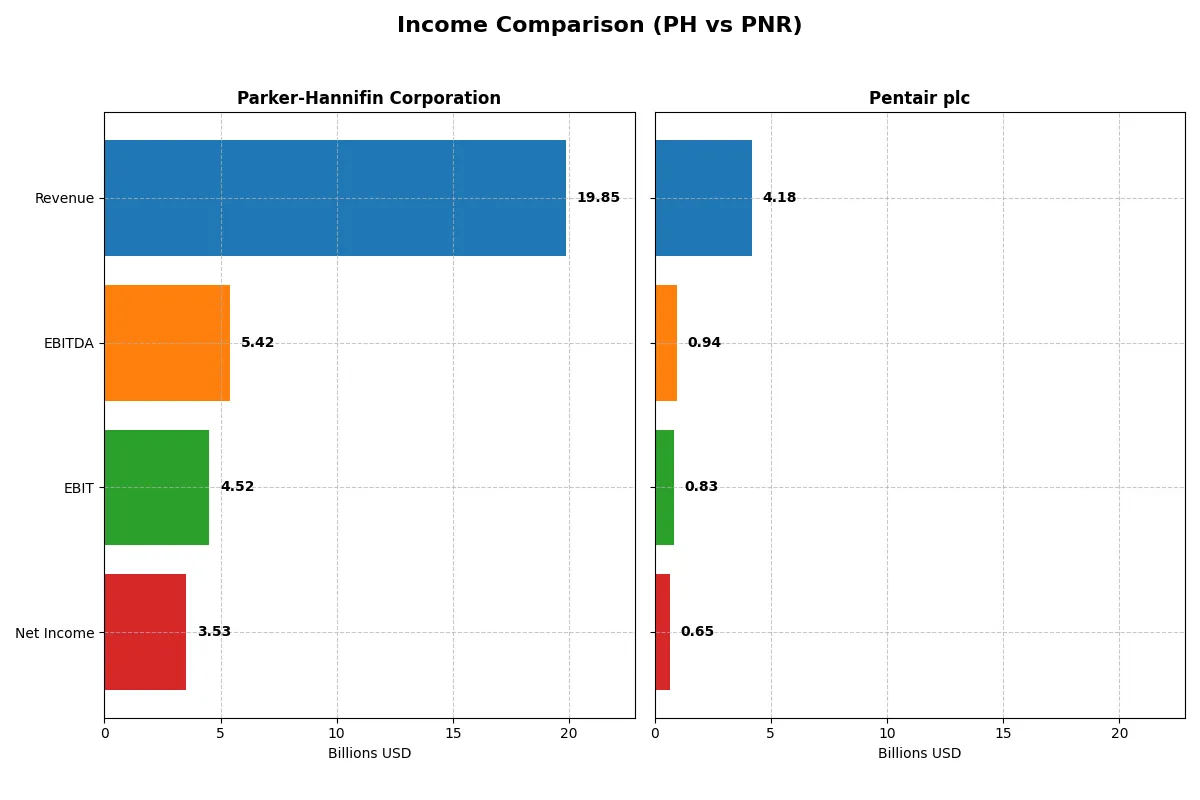
This data dissects the core profitability and scalability of both corporate engines to reveal who dominates the bottom line:
| Metric | Parker-Hannifin Corporation (PH) | Pentair plc (PNR) |
|---|---|---|
| Revenue | 19.85B | 4.18B |
| Cost of Revenue | 12.54B | 2.49B |
| Operating Expenses | 3.26B | 833M |
| Gross Profit | 7.32B | 1.69B |
| EBITDA | 5.42B | 944M |
| EBIT | 4.52B | 826M |
| Interest Expense | 409M | 69M |
| Net Income | 3.53B | 654M |
| EPS | 27.52 | 3.99 |
| Fiscal Year | 2025 | 2025 |
Income Statement Analysis: The Bottom-Line Duel
This income statement comparison reveals which corporate engine delivers superior profitability and efficiency in a competitive industrial landscape.
Parker-Hannifin Corporation Analysis
Parker-Hannifin grew revenue modestly from $14.3B in 2021 to $19.9B in 2024, with a slight dip to $19.85B in 2025. Net income surged from $1.75B to $3.53B over five years, reflecting strong operational leverage. Its gross margin holds steady near 37%, while net margin advanced to 17.8%, signaling disciplined cost management and improving bottom-line efficiency in 2025.
Pentair plc Analysis
Pentair increased revenue from $3.76B in 2021 to $4.18B in 2025, showing steady but slower growth. Net income expanded from $553M to $650M, reflecting moderate profitability gains. With a higher gross margin of 40.5% and a net margin of 15.7%, Pentair demonstrates solid margin control, though its EBIT margin trails Parker-Hannifin. The company posted modest EPS growth, indicating stable but less dynamic earnings momentum.
Margin Power vs. Revenue Scale
Parker-Hannifin outpaces Pentair in net income growth and EBIT margin despite a slightly lower gross margin, showcasing superior operational efficiency. Pentair offers a higher gross margin but lags in translating scale into bottom-line expansion. For investors, Parker-Hannifin’s profile suggests stronger profitability growth, while Pentair presents steadier, margin-focused performance.
Financial Ratios Comparison
These vital ratios act as a diagnostic tool to expose the underlying fiscal health, valuation premiums, and capital efficiency of the companies compared below:
| Ratios | Parker-Hannifin (PH) | Pentair (PNR) |
|---|---|---|
| ROE | 25.8% | 16.9% |
| ROIC | 13.7% | 12.5% |
| P/E | 25.4 | 26.1 |
| P/B | 6.5 | 4.4 |
| Current Ratio | 1.19 | 1.61 |
| Quick Ratio | 0.71 | 0.95 |
| D/E | 0.69 | 0.42 |
| Debt-to-Assets | 32.2% | 23.9% |
| Interest Coverage | 9.93 | 12.36 |
| Asset Turnover | 0.67 | 0.61 |
| Fixed Asset Turnover | 6.76 | 11.08 |
| Payout ratio | 24.4% | 25.1% |
| Dividend yield | 0.96% | 0.96% |
| Fiscal Year | 2025 | 2025 |
Efficiency & Valuation Duel: The Vital Signs
Financial ratios act as the company’s DNA, uncovering operational strengths and hidden risks essential for investment decisions.
Parker-Hannifin Corporation
Parker-Hannifin posts a strong 25.8% ROE and healthy 17.8% net margin, signaling solid profitability. Its P/E of 25.4 suggests the stock trades at a stretched valuation. The company returns value with modest 0.96% dividends, focusing reinvestment on innovation and growth to sustain its competitive edge.
Pentair plc
Pentair delivers a respectable 16.9% ROE and 15.7% net margin, showing efficient operations. Its P/E of 26.1 also reflects a premium valuation, though lower debt ratios enhance financial stability. Pentair matches Parker-Hannifin’s 0.96% dividend yield, balancing shareholder returns with R&D-driven expansion.
Premium Valuation vs. Operational Efficiency
Pentair exhibits a more favorable ratio profile with higher operational efficiency and lower leverage, despite similar valuation multiples to Parker-Hannifin. Investors prioritizing financial stability and efficient capital use may prefer Pentair, while those seeking stronger profitability might lean toward Parker-Hannifin’s growth-oriented model.
Which one offers the Superior Shareholder Reward?
I find Parker-Hannifin (PH) and Pentair (PNR) both pay dividends with yields near 1%. PH’s payout ratio sits around 24%, showing strong free cash flow coverage. PNR’s payout ratio is slightly lower at 25%, maintaining cash flow sustainability. Both pursue buybacks, but PH’s larger scale and consistent buyback intensity amplify total returns. PH’s dividend and buyback combination appears more sustainable for long-term value. I conclude PH offers a superior total shareholder reward in 2026.
Comparative Score Analysis: The Strategic Profile
The radar chart reveals the fundamental DNA and trade-offs of Parker-Hannifin Corporation and Pentair plc, highlighting their financial strengths and valuation nuances:
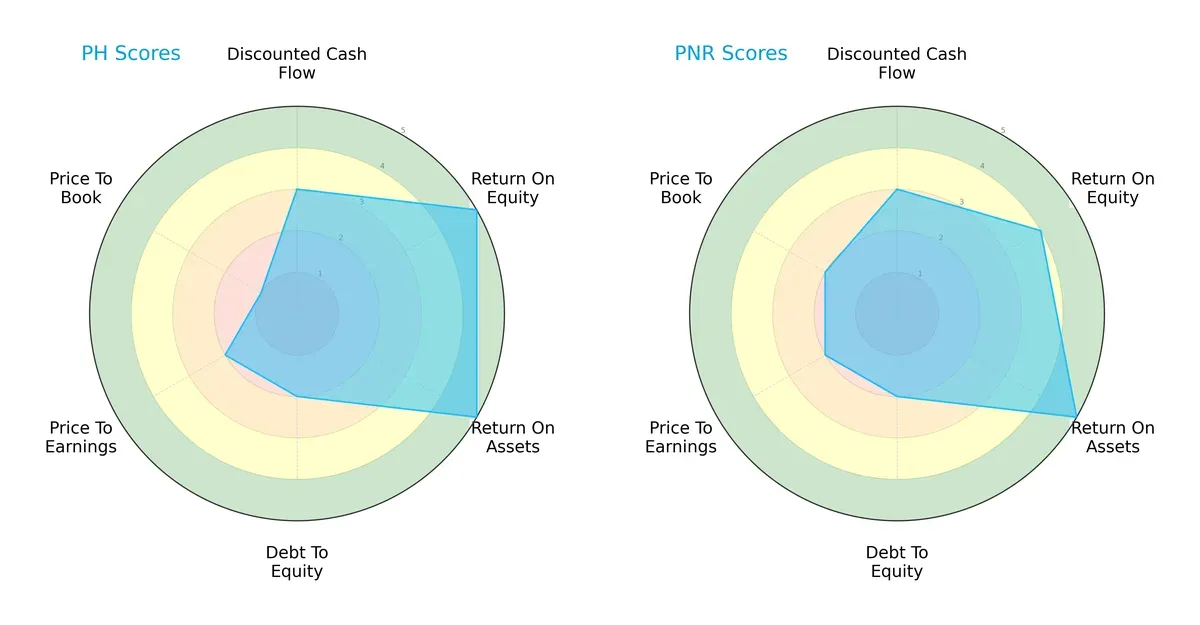
Parker-Hannifin excels in return on equity (ROE) with a top score of 5, indicating superior shareholder profit generation. Both firms tie on discounted cash flow (DCF) and return on assets (ROA) at 3 and 5, respectively. Debt-to-equity scores match at 2, reflecting moderate leverage risk. Valuation metrics diverge: Parker-Hannifin’s price-to-book (P/B) score is notably weak at 1, signaling potential overvaluation or asset inefficiency, whereas Pentair holds a slight edge with a 2. Overall, Parker-Hannifin relies on operational efficiency, while Pentair presents a more balanced valuation profile.
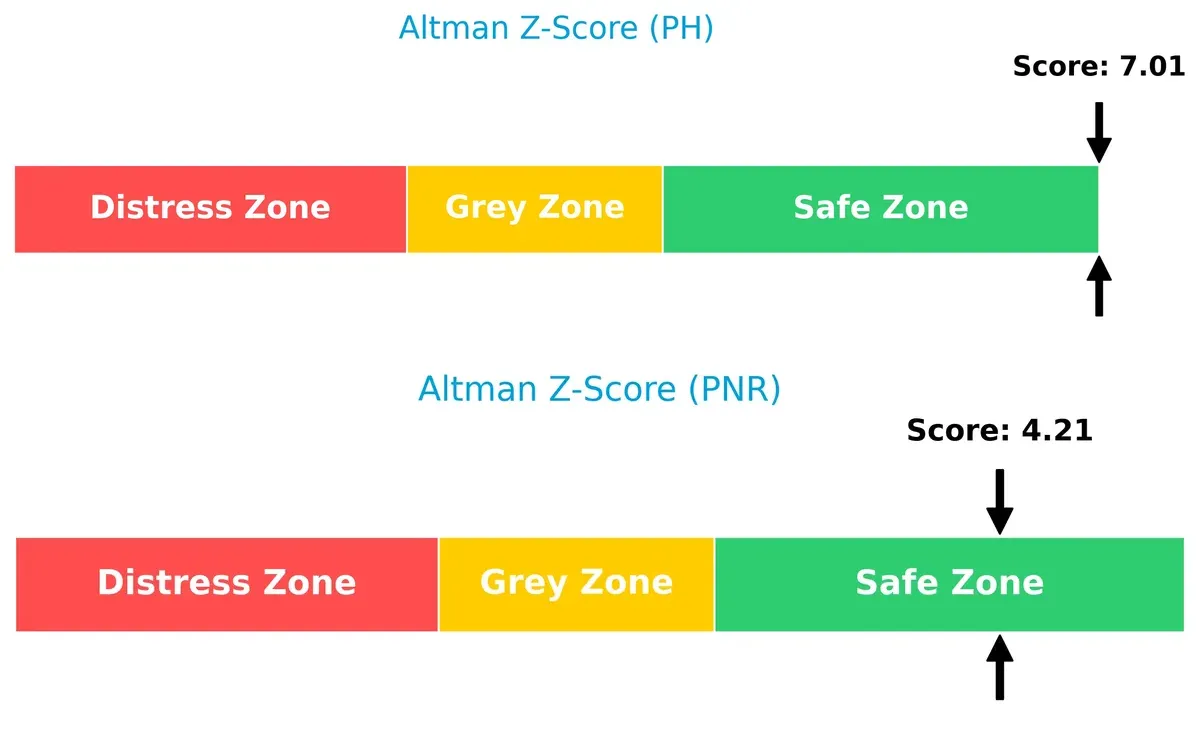
Bankruptcy Risk: Solvency Showdown
The Altman Z-Scores place both firms comfortably in the safe zone, with Parker-Hannifin scoring 7.0 versus Pentair’s 4.2, underscoring stronger solvency and lower bankruptcy risk for Parker-Hannifin in this cycle:
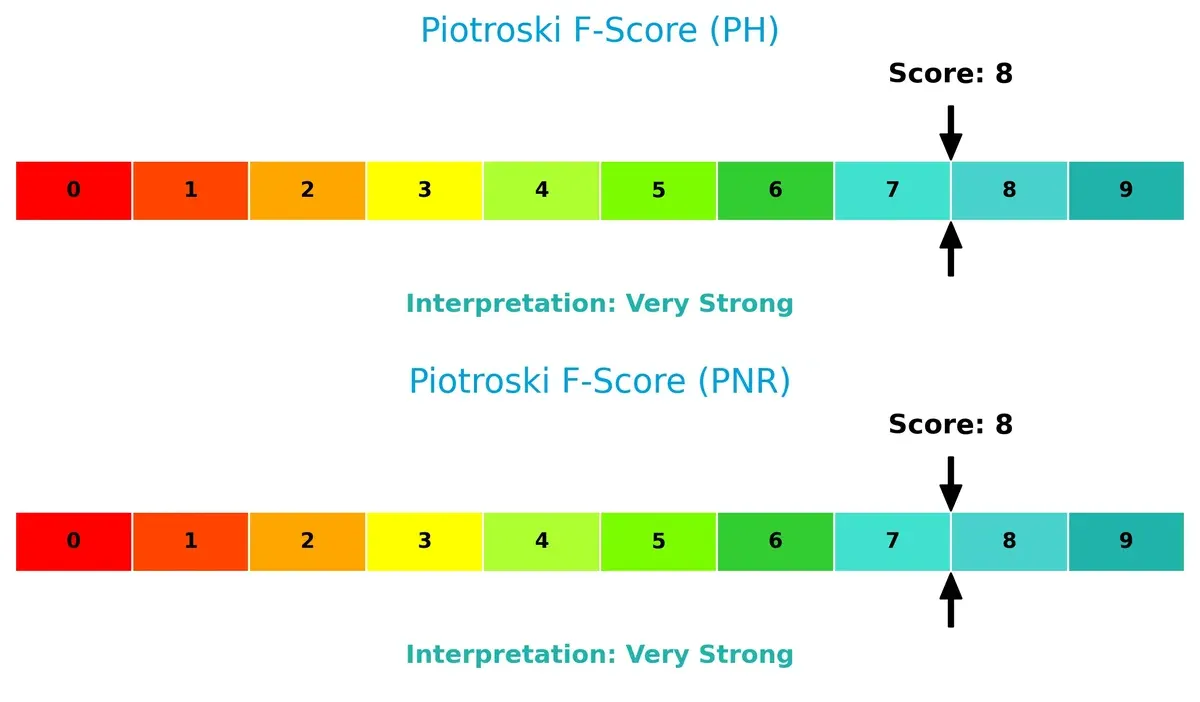
Financial Health: Quality of Operations
Both companies share a robust Piotroski F-Score of 8, signaling excellent financial health and operational quality without red flags in underlying metrics:
How are the two companies positioned?
This section dissects the operational DNA of PH and PNR by comparing their revenue distribution and internal dynamics. The goal is to confront their economic moats to reveal which model offers a more resilient, sustainable competitive advantage today.
Revenue Segmentation: The Strategic Mix
The following comparison dissects how Parker-Hannifin and Pentair diversify their income streams and where their primary sector bets lie:
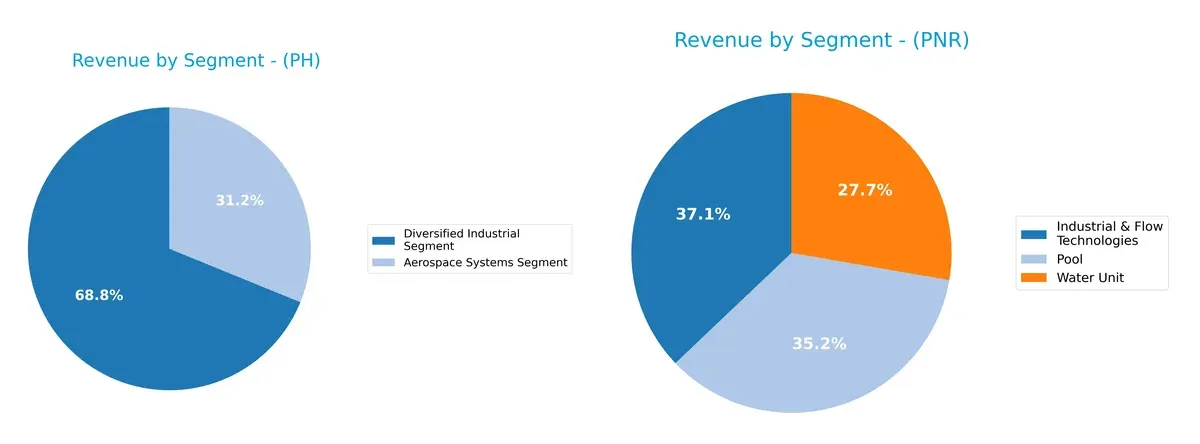
Parker-Hannifin anchors 2025 revenue heavily in Diversified Industrial at $13.7B, with Aerospace Systems at $6.2B, showing a solid two-pronged focus. Pentair spreads $4.1B across Industrial & Flow Technologies, Pool, and Water Units, reflecting a more balanced portfolio. Parker-Hannifin’s concentration signals strength in industrial infrastructure but exposes sector risk. Pentair’s diversified mix mitigates risk, pivoting on water and flow tech ecosystems for steady growth.
Strengths and Weaknesses Comparison
This table compares the Strengths and Weaknesses of Parker-Hannifin Corporation (PH) and Pentair plc (PNR):
PH Strengths
- Strong profitability with net margin 17.79% and ROE 25.81%
- Favorable ROIC above WACC at 13.69%
- Diversified industrial and aerospace segments generate multi-billion revenues
- Significant North American and European market presence
- Solid interest coverage ratio at 11.04
- High fixed asset turnover at 6.76
PNR Strengths
- Favorable profitability with net margin 15.66% and ROE 16.9%
- ROIC exceeds WACC at 12.46%
- Strong liquidity with current ratio 1.61
- Low debt-to-assets at 23.86% indicating conservative leverage
- Diverse revenue streams from industrial, pool, and water units
- Robust fixed asset turnover at 11.08 and interest coverage at 11.9
PH Weaknesses
- Unfavorable valuation multiples: PE 25.38 and PB 6.55
- Quick ratio low at 0.71 signals weaker short-term liquidity
- Dividend yield low at 0.96%
- Moderate debt level with D/E 0.69
- Neutral asset turnover at 0.67
- Geographic exposure heavily concentrated in North America (13.4B)
PNR Weaknesses
- Unfavorable valuation multiples: PE 26.14 and PB 4.42
- Quick ratio moderate at 0.95, less liquidity cushion
- Dividend yield also low at 0.96%
- Lower ROE compared to PH at 16.9%
- Asset turnover neutral at 0.61
- Revenue heavily dependent on the US market (2.8B)
Both companies demonstrate solid profitability and diversified product lines, but PH shows higher returns and broader geographic exposure. PNR maintains stronger liquidity and lower leverage. Valuation multiples and dividend yields are unfavorable for both, highlighting caution for investors.
The Moat Duel: Analyzing Competitive Defensibility
A structural moat is the only true defense against profit erosion from competition in the long term. Here’s how Parker-Hannifin and Pentair stack up:
Parker-Hannifin Corporation: Robust Operational Moat via Innovation and Scale
Parker-Hannifin leverages high switching costs and specialized motion control technology, reflected in a strong 22.75% EBIT margin and growing ROIC. New aerospace and industrial products in 2026 should deepen its moat.
Pentair plc: Niche Water Solutions with Cost Advantage
Pentair’s moat centers on cost efficiency and brand strength in water filtration. While it creates value, its declining ROIC signals margin pressure. Expansion in emerging markets offers upside but risks intensifying competition.
Parker-Hannifin’s Innovation vs. Pentair’s Cost Efficiency
Parker-Hannifin’s wider and improving moat outmatches Pentair’s narrower, weakening one. Its superior ROIC growth and margin stability position it better to defend market share in 2026 and beyond.
Which stock offers better returns?
Price movements over the past year reveal distinct trajectories: one stock accelerates sharply upward, while the other shows slower gains with recent weakness.
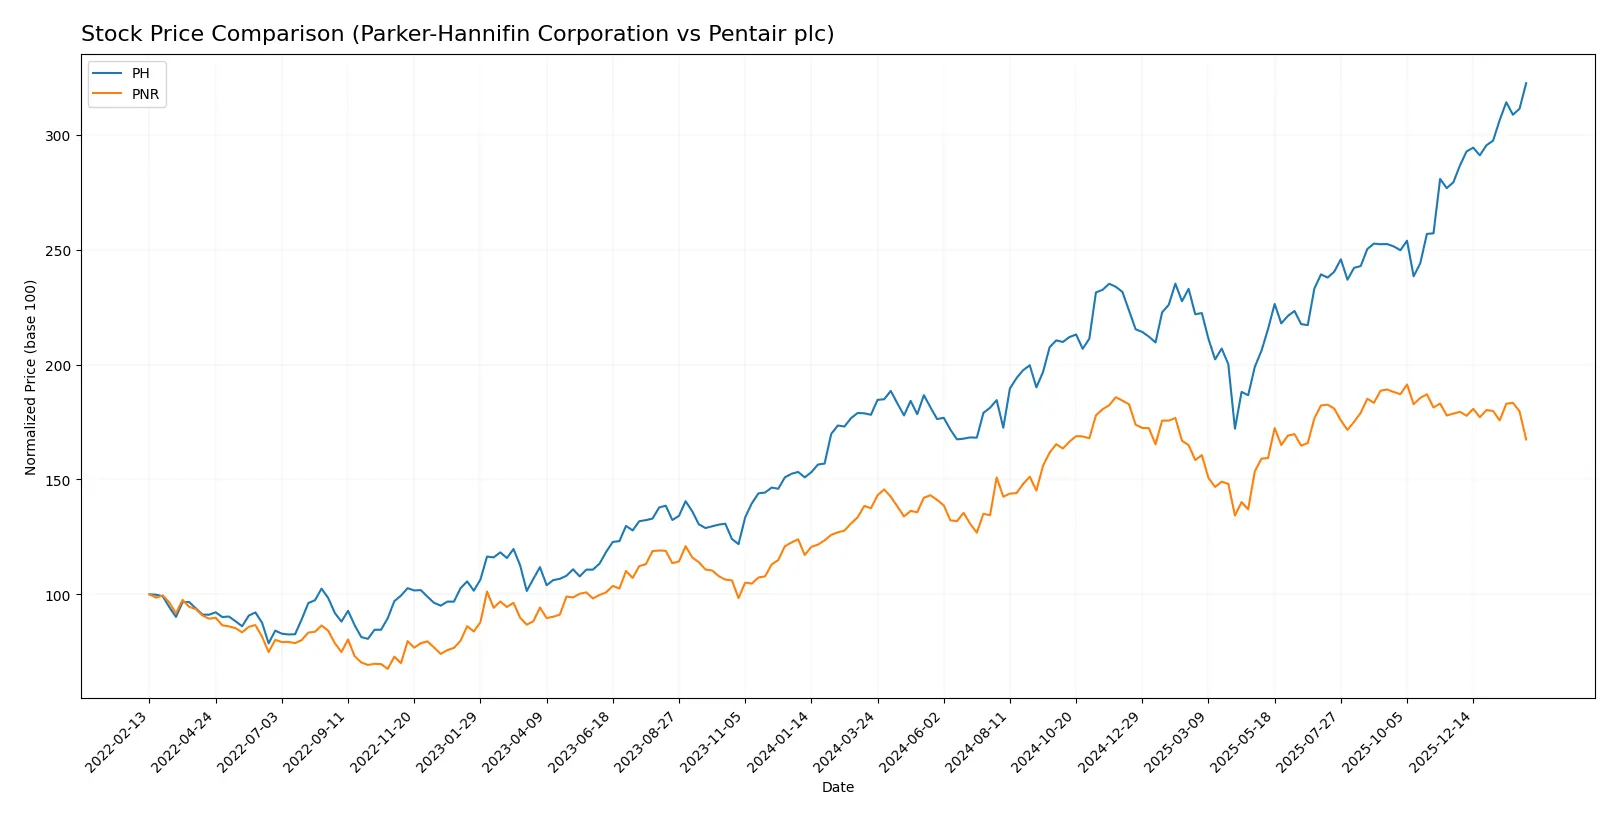
Trend Comparison
Parker-Hannifin Corporation (PH) exhibits a strong bullish trend over the past 12 months, gaining 81.03%. The stock shows price acceleration and a wide trading range from 503.3 to 969.26.
Pentair plc (PNR) also maintains a bullish trend with a 21.78% rise during the same period. However, the price trend decelerates recently, with a small 6.29% decline in the last months.
PH outperforms PNR significantly in total returns and recent momentum, delivering the highest market performance over the analyzed timeframe.
Target Prices
Analysts present a solid target price consensus for both Parker-Hannifin Corporation and Pentair plc, reflecting positive outlooks.
| Company | Target Low | Target High | Consensus |
|---|---|---|---|
| Parker-Hannifin Corporation | 825 | 1,139 | 995.46 |
| Pentair plc | 90 | 135 | 120 |
For Parker-Hannifin, the consensus target of $995.46 modestly exceeds the current price of $969.07, indicating moderate upside potential. Pentair’s target consensus of $120 suggests a significant premium over its $98.19 share price, signaling stronger expected growth.

Don’t Let Luck Decide Your Entry Point
Optimize your entry points with our advanced ProRealTime indicators. You’ll get efficient buy signals with precise price targets for maximum performance. Start outperforming now!
How do institutions grade them?
Parker-Hannifin Corporation Grades
The following table summarizes recent grades for Parker-Hannifin Corporation from major institutions:
| Grading Company | Action | New Grade | Date |
|---|---|---|---|
| Jefferies | Maintain | Buy | 2026-01-30 |
| Barclays | Maintain | Overweight | 2026-01-30 |
| Stifel | Maintain | Hold | 2026-01-30 |
| JP Morgan | Maintain | Overweight | 2026-01-30 |
| Wells Fargo | Maintain | Overweight | 2026-01-30 |
| Citigroup | Maintain | Buy | 2026-01-30 |
| Stifel | Maintain | Hold | 2026-01-23 |
| JP Morgan | Maintain | Overweight | 2026-01-16 |
| Morgan Stanley | Maintain | Equal Weight | 2026-01-14 |
| Barclays | Maintain | Overweight | 2026-01-07 |
Pentair plc Grades
Below are recent institutional grades for Pentair plc from recognized grading firms:
| Grading Company | Action | New Grade | Date |
|---|---|---|---|
| Oppenheimer | Maintain | Outperform | 2026-02-04 |
| Citigroup | Maintain | Buy | 2026-02-04 |
| JP Morgan | Maintain | Overweight | 2026-01-16 |
| Citigroup | Maintain | Buy | 2026-01-12 |
| BNP Paribas Exane | Downgrade | Underperform | 2026-01-07 |
| TD Cowen | Downgrade | Sell | 2026-01-05 |
| Jefferies | Upgrade | Buy | 2025-12-10 |
| Barclays | Downgrade | Equal Weight | 2025-12-04 |
| Oppenheimer | Maintain | Outperform | 2025-11-20 |
| UBS | Maintain | Buy | 2025-10-22 |
Which company has the best grades?
Parker-Hannifin consistently holds Buy and Overweight ratings with no downgrades, indicating stable institutional confidence. Pentair shows more mixed grades, including downgrades to Underperform and Sell, reflecting higher perceived risk for investors.
Risks specific to each company
In 2026’s complex market, these categories reveal critical pressure points and systemic threats facing Parker-Hannifin Corporation and Pentair plc:
1. Market & Competition
Parker-Hannifin Corporation
- Faces intense competition in diversified industrial and aerospace sectors, with margin pressure from innovation cycles.
Pentair plc
- Competes primarily in water solutions with steady demand but vulnerable to commoditization and price sensitivity.
2. Capital Structure & Debt
Parker-Hannifin Corporation
- Moderate leverage (D/E 0.69) with neutral debt-to-assets; interest coverage strong at 11.04x but quick ratio weak at 0.71 signals liquidity caution.
Pentair plc
- Lower leverage (D/E 0.42) and better liquidity (current ratio 1.61) enhance financial flexibility and reduce refinancing risk.
3. Stock Volatility
Parker-Hannifin Corporation
- Beta of 1.24 indicates above-market volatility, reflecting cyclical industrial exposure.
Pentair plc
- Beta of 1.22 similarly denotes above-average volatility but slightly less than PH, linked to water sector dynamics.
4. Regulatory & Legal
Parker-Hannifin Corporation
- Aerospace segment exposes PH to stringent aerospace and defense regulations, increasing compliance costs and risk of penalties.
Pentair plc
- Water treatment regulations in multiple jurisdictions require constant adaptation; potential liabilities from environmental compliance.
5. Supply Chain & Operations
Parker-Hannifin Corporation
- Complex global supply chain for aerospace and industrial components vulnerable to raw material cost spikes and logistical disruptions.
Pentair plc
- Supply chain focused on pumps and filtration; risks from component shortages and rising input costs but more concentrated scope.
6. ESG & Climate Transition
Parker-Hannifin Corporation
- Pressure to innovate eco-friendly aerospace and industrial solutions; faces transition risks in emissions and materials sourcing.
Pentair plc
- Strong ESG focus on water sustainability aligns with emerging regulations but dependent on capex investments to meet targets.
7. Geopolitical Exposure
Parker-Hannifin Corporation
- Global footprint includes sensitive defense contracts and exposure to trade tensions affecting aerospace and industrial markets.
Pentair plc
- UK-based with significant operations in North America; geopolitical risks moderate but include trade policy and currency fluctuations.
Which company shows a better risk-adjusted profile?
Parker-Hannifin’s key risk stems from regulatory complexity and supply chain fragility in aerospace, while Pentair’s leverage and liquidity position minimize financial risk. Pentair’s stronger capital structure and liquidity give it a superior risk-adjusted profile. PH’s quick ratio below 1 signals potential short-term stress. Meanwhile, Pentair’s consistent Altman Z-Score in the safe zone and higher favorable ratio count reinforce its stability advantage.
Final Verdict: Which stock to choose?
Parker-Hannifin’s superpower lies in its robust value creation and consistently growing profitability. It delivers strong returns on invested capital, reflecting a durable competitive advantage. A point of vigilance is its stretched valuation multiples, which could temper near-term upside. It suits an aggressive growth portfolio seeking quality with some valuation risk.
Pentair offers a solid strategic moat through steady operating cash flow and a conservative balance sheet. Its financial stability outshines Parker-Hannifin’s, with lower leverage and a healthier liquidity position. This profile fits investors favoring GARP—growth at a reasonable price—with a preference for stability and moderate expansion.
If you prioritize dynamic value creation and accelerating earnings growth, Parker-Hannifin is the compelling choice due to its very favorable moat and strong income statement momentum. However, if you seek better financial stability and a more moderate risk profile, Pentair offers superior balance sheet strength and a consistent cash flow base, though with a slightly declining profitability trend.
Disclaimer: Investment carries a risk of loss of initial capital. The past performance is not a reliable indicator of future results. Be sure to understand risks before making an investment decision.
Go Further
I encourage you to read the complete analyses of Parker-Hannifin Corporation and Pentair plc to enhance your investment decisions: