Home > Comparison > Industrials > PH vs PSN
The strategic rivalry between Parker-Hannifin Corporation and Parsons Corporation shapes the Industrials sector’s evolution. Parker-Hannifin excels as a capital-intensive machinery manufacturer with diversified industrial and aerospace segments. Parsons operates as a specialized service provider focusing on defense, intelligence, and critical infrastructure solutions. This analysis contrasts their operational models and growth trajectories to identify which offers a superior risk-adjusted return for diversified portfolios amid evolving industrial demands.
Table of contents
Companies Overview
Parker-Hannifin and Parsons Corporation stand as influential players within the industrial sector, each commanding unique niches.
Parker-Hannifin Corporation: Global Leader in Motion and Control Technologies
Parker-Hannifin dominates the industrial machinery market by manufacturing motion and control systems. Its revenue relies heavily on diversified industrial and aerospace segments addressing OEMs and distributors. In 2026, the company emphasizes expanding its aerospace systems and enhancing product precision under the leadership of CEO Jennifer A. Parmentier. Its broad product portfolio supports various critical industries worldwide.
Parsons Corporation: Specialist in Defense and Infrastructure Solutions
Parsons focuses on integrated solutions for defense, intelligence, and critical infrastructure markets. Its core revenue stems from federal solutions and critical infrastructure services including cybersecurity, missile defense, and smart city technologies. In 2026, CEO Carey A. Smith drives growth through advanced technology deployments in U.S. government contracts. Parsons’ niche expertise in security and infrastructure distinguishes it in the defense sector.
Strategic Collision: Similarities & Divergences
Both firms operate in industrial machinery but diverge sharply in business philosophy. Parker-Hannifin pursues a diversified product-driven model, while Parsons adopts a service-oriented approach rooted in government contracts. Their primary battleground lies in technology-driven innovation for complex systems. Investors face contrasting profiles: Parker-Hannifin offers broad industrial exposure, whereas Parsons presents focused defense and infrastructure growth potential.
Income Statement Comparison
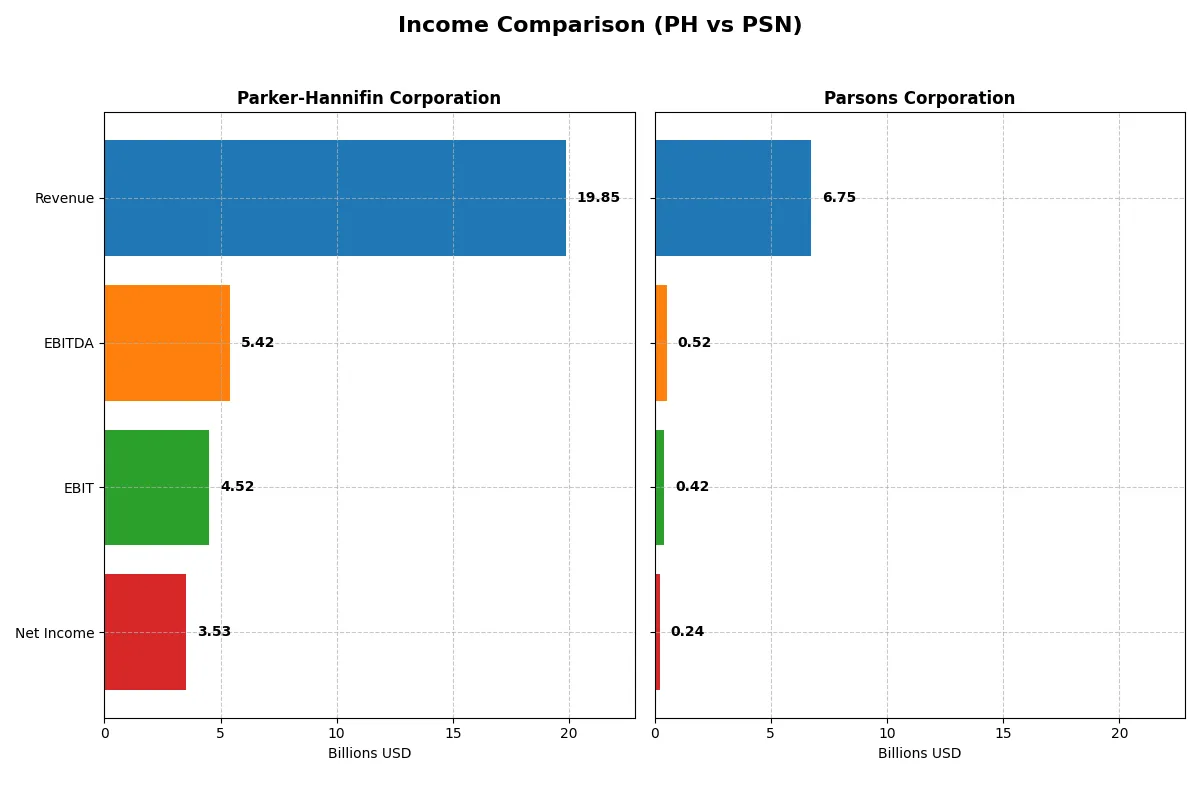
This data dissects the core profitability and scalability of both corporate engines to reveal who dominates the bottom line:
| Metric | Parker-Hannifin Corporation (PH) | Parsons Corporation (PSN) |
|---|---|---|
| Revenue | 19.85B | 6.75B |
| Cost of Revenue | 12.54B | 5.34B |
| Operating Expenses | 3.26B | 978M |
| Gross Profit | 7.32B | 1.41B |
| EBITDA | 5.42B | 518M |
| EBIT | 4.52B | 419M |
| Interest Expense | 409M | 52M |
| Net Income | 3.53B | 238M |
| EPS | 27.52 | 2.21 |
| Fiscal Year | 2025 | 2024 |
Income Statement Analysis: The Bottom-Line Duel
The following income statement comparison reveals how efficiently each company converts sales into profits and sustains margin strength over time.
Parker-Hannifin Corporation Analysis
Parker-Hannifin’s revenue grew 38% over five years, reaching $19.85B in 2025, with a slight 0.4% dip year-on-year. Net income surged 102% over the period to $3.53B, reflecting strong margin expansion. Gross margin remains healthy at 36.85%, and net margin improved to 17.79%, signaling excellent cost control and profitability momentum despite flat revenue.
Parsons Corporation Analysis
Parsons posted a robust 72% revenue increase over five years, hitting $6.75B in 2024 and accelerating 24% year-on-year. Net income more than doubled, rising 139% to $238M, though margins are thinner. Gross margin stands at 20.83%, and net margin is modest at 3.48%. However, strong EBIT growth (42%) and EPS gains suggest improving operational efficiency and growth momentum.
Margin Strength vs. Rapid Growth
Parker-Hannifin dominates in margin quality and absolute profits, boasting superior net and EBIT margins above industry norms. Parsons impresses with faster revenue and earnings growth but operates with significantly lower margins. For investors, Parker-Hannifin offers steady high profitability, while Parsons presents a growth profile with improving efficiency but higher risk due to thinner margins.
Financial Ratios Comparison
These vital ratios act as a diagnostic tool to expose the underlying fiscal health, valuation premiums, and capital efficiency of the companies compared below:
| Ratios | Parker-Hannifin (PH) | Parsons Corporation (PSN) |
|---|---|---|
| ROE | 25.8% | 9.7% |
| ROIC | 13.7% | 8.3% |
| P/E | 25.4 | 41.7 |
| P/B | 6.55 | 4.06 |
| Current Ratio | 1.19 | 1.29 |
| Quick Ratio | 0.71 | 1.29 |
| D/E (Debt-to-Equity) | 0.69 | 0.59 |
| Debt-to-Assets | 32.2% | 25.9% |
| Interest Coverage | 9.93 | 8.30 |
| Asset Turnover | 0.67 | 1.23 |
| Fixed Asset Turnover | 6.76 | 25.51 |
| Payout Ratio | 24.4% | 0% |
| Dividend Yield | 0.96% | 0% |
| Fiscal Year | 2025 | 2024 |
Efficiency & Valuation Duel: The Vital Signs
Financial ratios act as a company’s DNA, uncovering hidden risks and operational strengths that shape investor decisions.
Parker-Hannifin Corporation
Parker-Hannifin delivers strong profitability with a 25.8% ROE and a solid 17.8% net margin, signaling operational excellence. However, the stock trades expensive at a 25.4 P/E and 6.6 P/B, indicating stretched valuation. Shareholder returns mostly come from modest dividends, with limited buybacks, reflecting a cautious capital allocation strategy.
Parsons Corporation
Parsons shows weaker profitability, with a 9.7% ROE and a low 3.5% net margin, pointing to operational challenges. Its valuation appears stretched, trading at a 41.7 P/E and 4.1 P/B. The company pays no dividends, reinvesting heavily in growth and maintaining favorable liquidity, which supports future expansion but delays shareholder returns.
Premium Valuation vs. Operational Safety
Parker-Hannifin blends strong profitability with a high valuation, offering operational safety but limited margin for error. Parsons trades at a higher P/E with weaker profits but invests in growth. Risk-tolerant investors may prefer Parsons’ profile, while those favoring stability find Parker-Hannifin’s metrics more reassuring.
Which one offers the Superior Shareholder Reward?
I see Parker-Hannifin (PH) pays a modest 0.96% dividend yield with a prudent 24% payout ratio, supported by strong free cash flow coverage near 88%. PH also executes disciplined buybacks, enhancing total return sustainably. In contrast, Parsons (PSN) pays no dividends but reinvests heavily in growth, showing solid free cash flow conversion and moderate buybacks. However, PH’s balanced distribution mix of dividends and buybacks offers more reliable, long-term shareholder reward in 2026.
Comparative Score Analysis: The Strategic Profile
The radar chart reveals the fundamental DNA and trade-offs of Parker-Hannifin Corporation and Parsons Corporation, highlighting their financial strengths and valuation nuances:
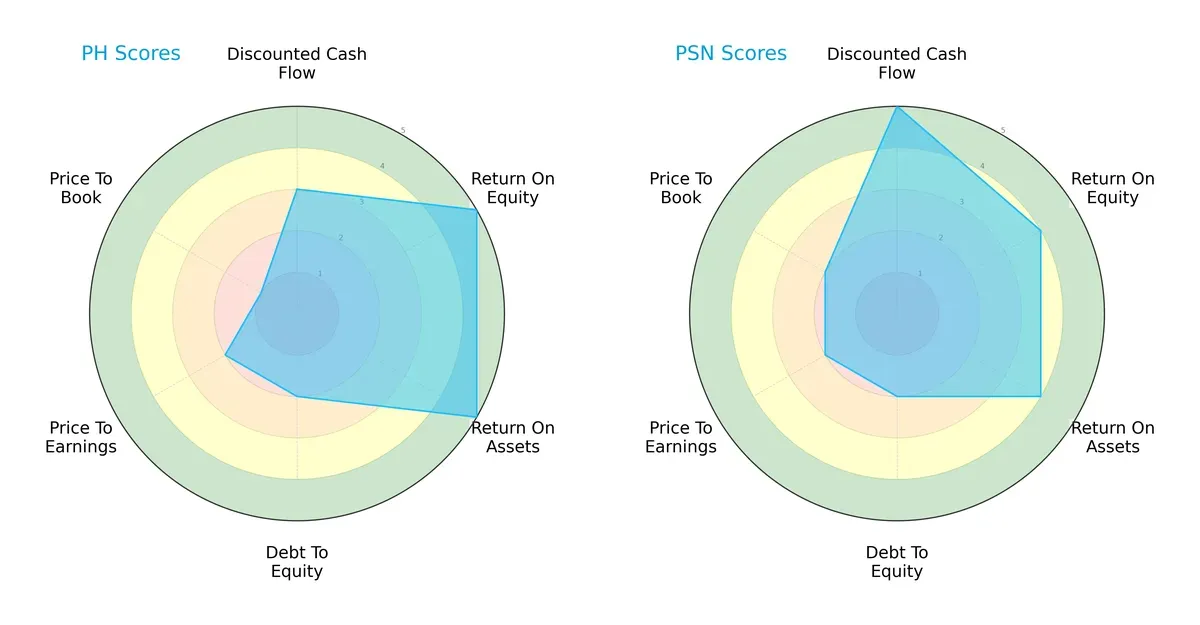
Parker-Hannifin excels in profitability metrics, scoring a 5 in both ROE and ROA, while Parsons leads in discounted cash flow with a top score of 5. Both share moderate debt levels and P/E scores, but Parker-Hannifin’s very unfavorable price-to-book score (1) contrasts with Parsons’ moderate valuation, signaling a less balanced profile for Parker-Hannifin. Parsons offers a more evenly distributed financial score set.
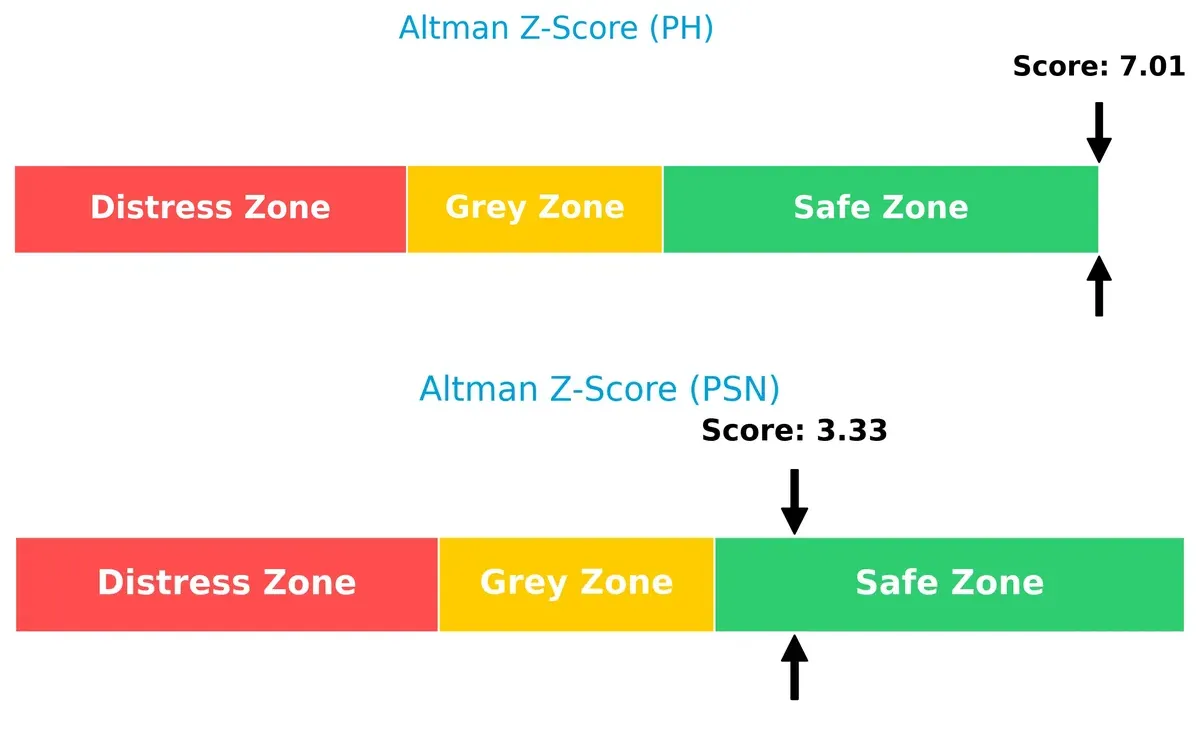
Bankruptcy Risk: Solvency Showdown
The Altman Z-Scores place both firms comfortably in the safe zone, but Parker-Hannifin’s 7.0 score significantly outpaces Parsons’ 3.3, indicating a stronger solvency buffer and higher resilience in this economic cycle:
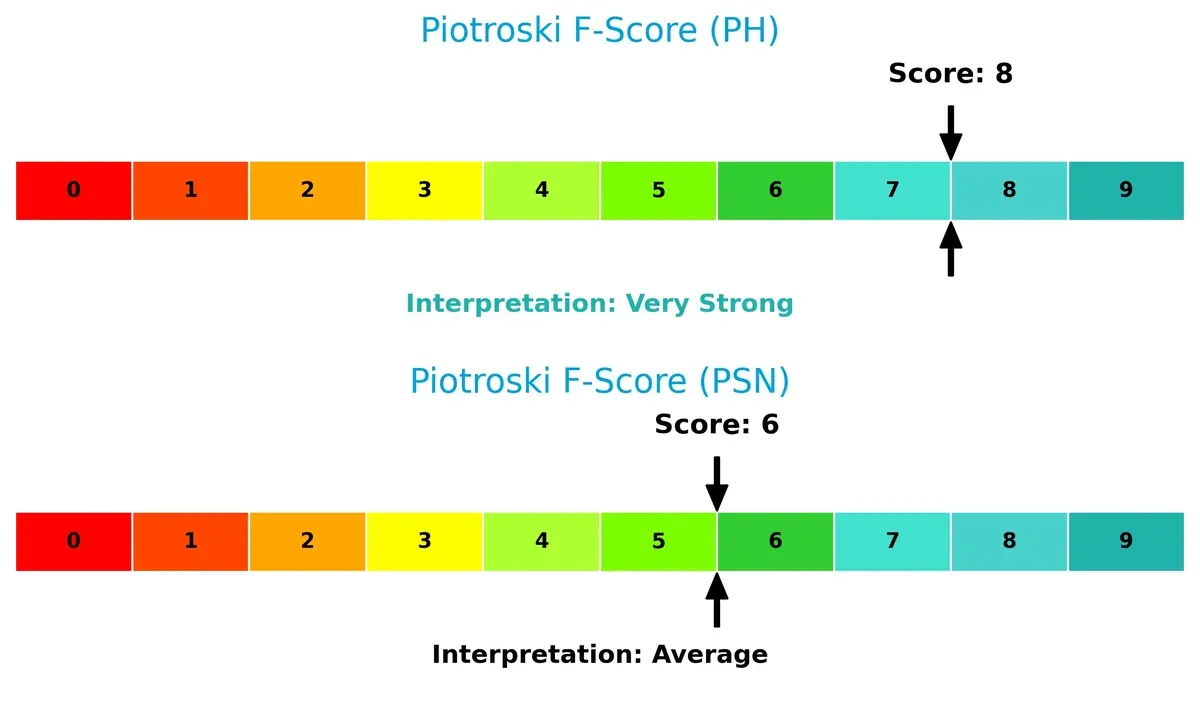
Financial Health: Quality of Operations
Parker-Hannifin’s Piotroski F-Score of 8 signals very strong financial health, outperforming Parsons’ average score of 6. This suggests Parker-Hannifin maintains superior internal operational metrics and fewer red flags:
How are the two companies positioned?
This section dissects the operational DNA of PH and PSN by comparing their revenue distribution and internal dynamics. The goal is to confront their economic moats and identify which business model offers the most resilient competitive advantage today.
Revenue Segmentation: The Strategic Mix
This visual comparison dissects how Parker-Hannifin Corporation and Parsons Corporation diversify their income streams and reveals their primary sector bets:
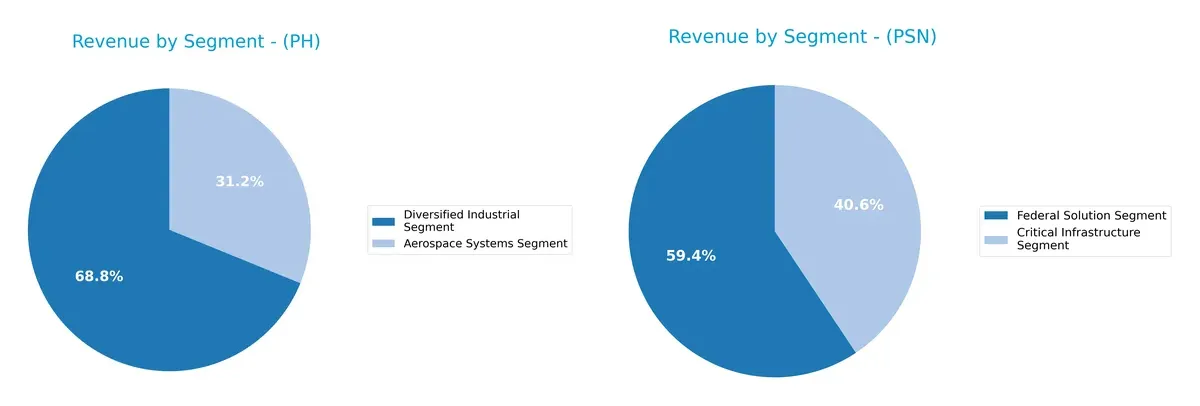
Parker-Hannifin anchors its revenue in two robust segments: $13.7B from Diversified Industrial and $6.2B from Aerospace Systems in 2025. This balance shows a diversified industrial powerhouse with aerospace exposure. Parsons, by contrast, leans heavily on Federal Solutions at $4B, with a smaller $2.7B from Critical Infrastructure. Parsons’ concentration signals reliance on government contracts, raising concentration risk versus Parker-Hannifin’s broader industrial ecosystem.
Strengths and Weaknesses Comparison
This table compares the Strengths and Weaknesses of Parker-Hannifin Corporation (PH) and Parsons Corporation (PSN):
PH Strengths
- Diversified revenue streams from Aerospace and Industrial segments
- Strong profitability with high net margin and ROE
- Global presence with significant North America, Europe, Asia Pacific sales
- Favorable interest coverage and fixed asset turnover ratios
PSN Strengths
- Favorable WACC and debt-to-assets ratios indicate efficient capital structure
- Higher asset turnover and fixed asset turnover suggest operational efficiency
- Strong liquidity with a favorable quick ratio
- Expanding presence in Middle East and North America markets
PH Weaknesses
- Elevated P/E and P/B ratios suggest possible overvaluation
- Quick ratio below 1 signals potential short-term liquidity pressure
- Dividend yield under 1% may limit income appeal
- Moderate debt leverage with neutral ratings
PSN Weaknesses
- Low profitability with unfavorable net margin and ROE
- High P/E ratio questions valuation sustainability
- No dividend yield reduces investor income potential
- Limited product diversification with concentrated segments
Parker-Hannifin’s broad diversification and profitability underpin its slightly favorable financial profile, but valuation and liquidity ratios warrant caution. Parsons’ strengths lie in capital efficiency and market expansion, yet weak profitability and concentrated revenue segments pose strategic challenges.
The Moat Duel: Analyzing Competitive Defensibility
A structural moat protects long-term profits from relentless competitive erosion. Without it, gains erode to zero over time:
Parker-Hannifin Corporation: Deep Engineering Expertise with Durable Cost Advantage
Parker-Hannifin’s moat stems from complex motion and control technologies, driving a stable 22.75% EBIT margin and 17.79% net margin. Its growing ROIC (+26%) signals efficient capital use. Expansion in aerospace and industrial segments could deepen this moat in 2026.
Parsons Corporation: Niche Defense and Infrastructure Solutions with Rising ROIC
Parsons leverages specialized cyber and defense services, contrasting Parker-Hannifin’s manufacturing edge. Its ROIC growth (+80%) and 6.21% EBIT margin reflect rising operational efficiency. 2026 offers new defense contracts and infrastructure tech to widen its moat.
Engineering Precision vs. Specialized Defense: Which Moat Endures?
Parker-Hannifin’s wider moat is anchored by superior margins and diversified industrial scale. Parsons shows faster ROIC growth but from a narrower base. Parker-Hannifin remains better equipped to defend market share against competitive pressures.
Which stock offers better returns?
Over the past 12 months, Parker-Hannifin Corporation’s stock surged sharply, showing strong buyer dominance, while Parsons Corporation’s price declined amid seller dominance and decelerating momentum.
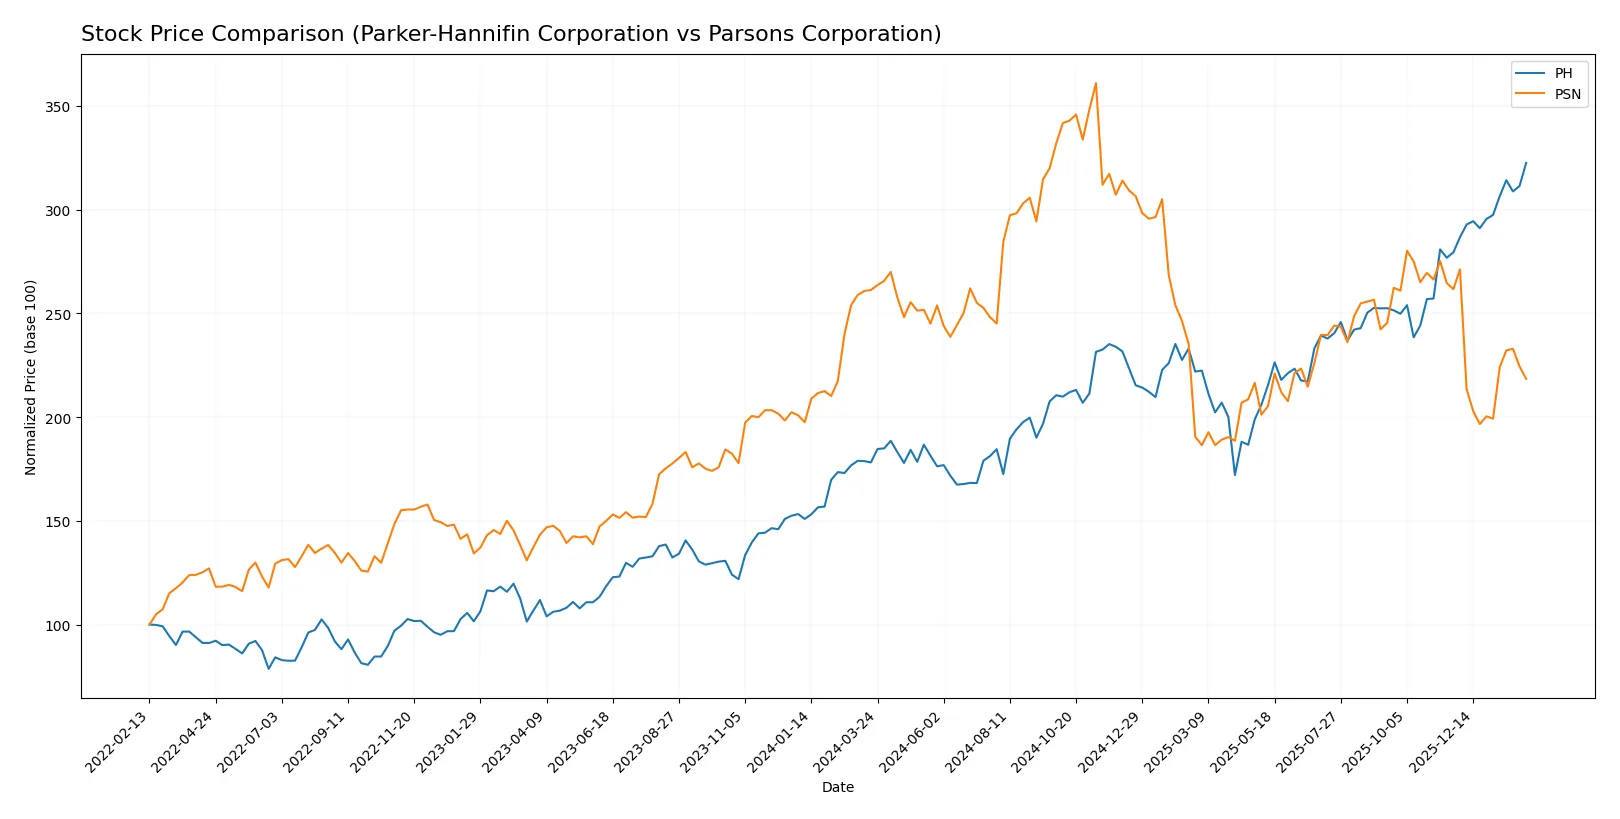
Trend Comparison
Parker-Hannifin Corporation’s stock gained 81.03% over the last year, marking a clear bullish trend with accelerating momentum and high price volatility between 503.3 and 969.26.
Parsons Corporation’s stock fell 16.39% over the same period, reflecting a bearish trend with deceleration and lower volatility, ranging from 58.22 to 112.69.
Parker-Hannifin delivered significantly stronger market performance than Parsons, supported by rising prices and dominant buyer activity versus Parsons’ persistent downtrend.
Target Prices
Analysts present a cautiously optimistic target consensus for Parker-Hannifin and Parsons Corporation.
| Company | Target Low | Target High | Consensus |
|---|---|---|---|
| Parker-Hannifin Corporation | 825 | 1139 | 995.46 |
| Parsons Corporation | 78 | 104 | 86.8 |
The consensus targets for Parker-Hannifin exceed its current price of 970, signaling moderate upside. Parsons’ targets also suggest potential appreciation from its 68.48 price.

Don’t Let Luck Decide Your Entry Point
Optimize your entry points with our advanced ProRealTime indicators. You’ll get efficient buy signals with precise price targets for maximum performance. Start outperforming now!
How do institutions grade them?
Here are the recent institutional grades for Parker-Hannifin Corporation and Parsons Corporation:
Parker-Hannifin Corporation Grades
The table below summarizes Parker-Hannifin’s current grades from leading financial institutions:
| Grading Company | Action | New Grade | Date |
|---|---|---|---|
| Jefferies | Maintain | Buy | 2026-01-30 |
| Barclays | Maintain | Overweight | 2026-01-30 |
| Stifel | Maintain | Hold | 2026-01-30 |
| JP Morgan | Maintain | Overweight | 2026-01-30 |
| Wells Fargo | Maintain | Overweight | 2026-01-30 |
| Citigroup | Maintain | Buy | 2026-01-30 |
| Morgan Stanley | Maintain | Equal Weight | 2026-01-14 |
Parsons Corporation Grades
Below is a summary of Parsons Corporation’s recent institutional grades:
| Grading Company | Action | New Grade | Date |
|---|---|---|---|
| Barclays | Maintain | Overweight | 2026-01-23 |
| Keybanc | Maintain | Overweight | 2026-01-20 |
| UBS | Maintain | Buy | 2026-01-15 |
| Citigroup | Maintain | Buy | 2026-01-13 |
| B of A Securities | Maintain | Buy | 2025-12-30 |
| Stifel | Maintain | Buy | 2025-12-23 |
| Jefferies | Maintain | Hold | 2025-12-11 |
| TD Cowen | Upgrade | Buy | 2025-12-10 |
| Truist Securities | Maintain | Buy | 2025-12-08 |
| Baird | Maintain | Outperform | 2025-12-08 |
Which company has the best grades?
Parsons Corporation generally holds a stronger consensus, with multiple Buy and Outperform ratings. Parker-Hannifin shows a mix of Buy, Overweight, and Hold grades. Parsons’ higher concentration of bullish grades could attract more investor interest.
Risks specific to each company
The following categories identify the critical pressure points and systemic threats facing both firms in the 2026 market environment:
1. Market & Competition
Parker-Hannifin Corporation
- Faces intense competition in diverse industrial and aerospace markets, requiring continuous innovation to maintain moats.
Parsons Corporation
- Competes in specialized defense and infrastructure sectors with fewer direct rivals but high reliance on government contracts.
2. Capital Structure & Debt
Parker-Hannifin Corporation
- Moderate debt-to-equity ratio (0.69) with solid interest coverage (11.04), indicating manageable leverage.
Parsons Corporation
- Lower debt-to-equity ratio (0.59) and good interest coverage (8.13) suggest conservative capital structure.
3. Stock Volatility
Parker-Hannifin Corporation
- Beta of 1.24 indicates above-market volatility, reflecting sensitivity to economic cycles.
Parsons Corporation
- Beta of 0.67 shows below-market volatility, offering relative stability amid sector fluctuations.
4. Regulatory & Legal
Parker-Hannifin Corporation
- Exposed to aerospace and industrial regulations globally; compliance costs can pressure margins.
Parsons Corporation
- Faces stringent defense contracting and cybersecurity regulations, with legal risks tied to government audits.
5. Supply Chain & Operations
Parker-Hannifin Corporation
- Complex global supply chain for motion and control systems; vulnerable to raw material price swings.
Parsons Corporation
- Operational risks linked to critical infrastructure projects and reliance on specialized technology suppliers.
6. ESG & Climate Transition
Parker-Hannifin Corporation
- Increasing pressure to reduce carbon footprint in manufacturing and aerospace sectors.
Parsons Corporation
- ESG demands growing in defense and critical infrastructure, particularly in cyber and environmental impact.
7. Geopolitical Exposure
Parker-Hannifin Corporation
- Global footprint exposes it to trade tensions and tariffs affecting industrial supply chains.
Parsons Corporation
- High exposure to U.S. defense spending and Middle East operations, sensitive to geopolitical instability.
Which company shows a better risk-adjusted profile?
Parsons’ lower beta and conservative debt profile reduce volatility and financial risk. However, Parker-Hannifin’s robust profitability and strong Altman Z-Score indicate superior financial resilience. Parsons faces concentrated regulatory and geopolitical risks, while Parker-Hannifin contends with broader market competition and supply chain complexity. Overall, Parker-Hannifin’s high Piotroski score and safe-zone bankruptcy risk give it a slight edge in risk-adjusted stability despite higher market sensitivity.
Final Verdict: Which stock to choose?
Parker-Hannifin (PH) excels as a cash-generating powerhouse with a durable competitive edge reflected in its very favorable ROIC exceeding WACC. Its main point of vigilance lies in its elevated valuation multiples, which may temper upside for value-conscious investors. PH aligns well with aggressive growth portfolios seeking robust profitability and capital efficiency.
Parsons Corporation (PSN) stands out for its strategic moat in specialized engineering services, supported by a healthy balance sheet and superior liquidity metrics versus PH. Though it carries a more moderate profitability profile, PSN offers greater stability and consistent free cash flow, fitting neatly into GARP portfolios aiming to balance growth with reasonable risk.
If you prioritize capital efficiency and strong earnings power, Parker-Hannifin is the compelling choice due to its proven value creation and accelerating bullish momentum. However, if you seek steadier cash flow and a lower-risk profile, Parsons offers better stability and a more defensible position amid market volatility. Both present valid scenarios depending on your risk tolerance and investment horizon.
Disclaimer: Investment carries a risk of loss of initial capital. The past performance is not a reliable indicator of future results. Be sure to understand risks before making an investment decision.
Go Further
I encourage you to read the complete analyses of Parker-Hannifin Corporation and Parsons Corporation to enhance your investment decisions: