In today’s rapidly evolving cybersecurity landscape, Palo Alto Networks, Inc. (PANW) and Zscaler, Inc. (ZS) stand out as pivotal players in software infrastructure. Both companies deliver cutting-edge security solutions to protect enterprises against growing digital threats, yet they approach innovation through distinct strategies and market focuses. This comparison will help you identify which company offers the most compelling investment opportunity in 2026. Let’s explore their strengths and growth potential together.

Table of contents
Companies Overview
I will begin the comparison between Palo Alto Networks and Zscaler by providing an overview of these two companies and their main differences.
Palo Alto Networks Overview
Palo Alto Networks, Inc. focuses on delivering comprehensive cybersecurity solutions globally. The company offers firewall appliances, software, and cloud security services, targeting medium to large enterprises, service providers, and government entities. Founded in 2005 and headquartered in Santa Clara, California, Palo Alto Networks emphasizes threat prevention, security analytics, and consulting services to protect various industries, including healthcare, financial services, and telecommunications.
Zscaler Overview
Zscaler, Inc. operates as a cloud security company providing secure access to SaaS applications and private data centers worldwide. Headquartered in San Jose, California, and established in 2007, Zscaler offers solutions like Zscaler Internet Access and Private Access to protect users, servers, and IoT devices. Its platform includes workload segmentation and digital experience measurement, serving industries such as financial services, healthcare, technology, and public sector.
Key similarities and differences
Both companies operate in the software infrastructure industry, focusing on cybersecurity, but their approaches differ. Palo Alto Networks provides a broader range of hardware and software firewall solutions combined with cloud security and consulting services. In contrast, Zscaler specializes in cloud-native security platforms with emphasis on secure access and workload segmentation. While Palo Alto Networks has a larger workforce and market cap, Zscaler is more concentrated on cloud security and digital experience analytics.
Income Statement Comparison
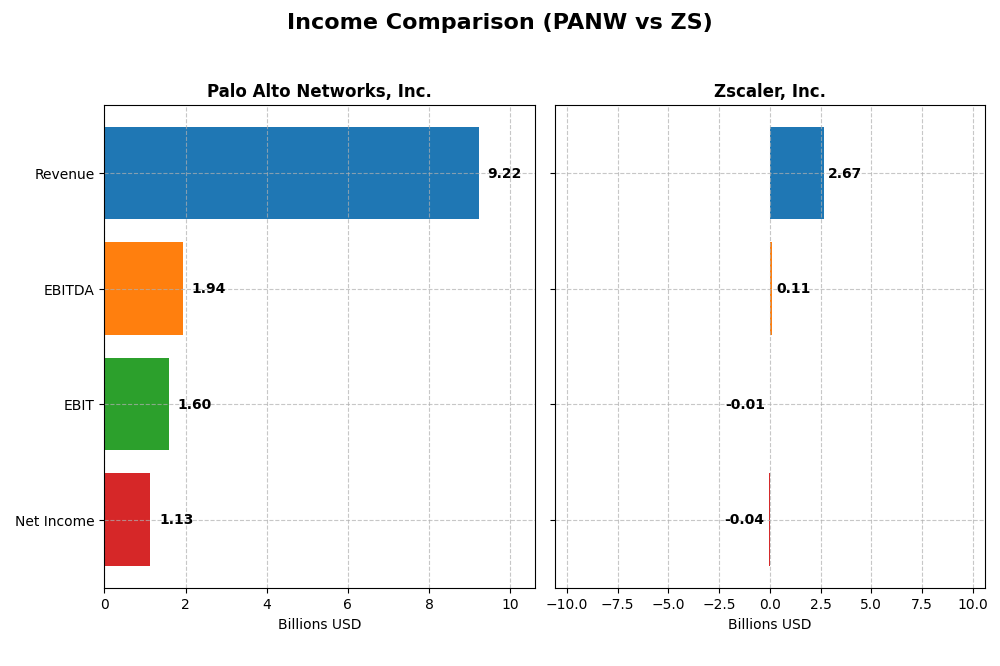
Below is the latest fiscal year income statement comparison for Palo Alto Networks, Inc. and Zscaler, Inc., highlighting key financial metrics to provide a snapshot of their performance.
| Metric | Palo Alto Networks, Inc. | Zscaler, Inc. |
|---|---|---|
| Market Cap | 120B | 34.4B |
| Revenue | 9.22B | 2.67B |
| EBITDA | 1.94B | 112M |
| EBIT | 1.60B | -8.8M |
| Net Income | 1.13B | -41.5M |
| EPS | 1.71 | -0.27 |
| Fiscal Year | 2025 | 2025 |
Income Statement Interpretations
Palo Alto Networks, Inc.
Palo Alto Networks showed consistent revenue growth from $4.3B in 2021 to $9.2B in 2025, with net income swinging from a $499M loss in 2021 to $1.1B profit in 2025. Margins improved overall, with a strong gross margin of 73.4% and EBIT margin of 17.3% in 2025. Despite a net margin decline in 2025, growth across revenue and operating profit remains favorable.
Zscaler, Inc.
Zscaler’s revenue rose sharply from $673M in 2021 to $2.7B in 2025, with net losses narrowing to $41M in 2025 from $262M in 2021. The company maintained a high gross margin of 76.9% but operated at a slight EBIT loss of -0.3% in 2025. Improvements in net margin and EPS growth in the latest year highlight continued progress despite remaining unprofitable.
Which one has the stronger fundamentals?
Both companies exhibit favorable income statement trends with solid revenue growth and operational improvements. Palo Alto Networks benefits from positive net income and stronger EBIT margins, while Zscaler shows rapid revenue expansion and margin improvements but still posts net losses. Palo Alto’s higher profitability contrasts with Zscaler’s faster growth, reflecting different maturity stages in fundamentals.
Financial Ratios Comparison
This table presents a side-by-side comparison of key financial ratios for Palo Alto Networks, Inc. and Zscaler, Inc. for the fiscal year 2025, providing a snapshot of their financial health and market valuation metrics.
| Ratios | Palo Alto Networks, Inc. (PANW) | Zscaler, Inc. (ZS) |
|---|---|---|
| ROE | 14.49% | -2.31% |
| ROIC | 5.17% | -3.18% |
| P/E | 101.4 | -1063.0 |
| P/B | 14.70 | 24.51 |
| Current Ratio | 0.89 | 2.01 |
| Quick Ratio | 0.89 | 2.01 |
| D/E | 0.04 | 1.00 |
| Debt-to-Assets | 1.43% | 27.98% |
| Interest Coverage | 414.3 | -13.49 |
| Asset Turnover | 0.39 | 0.42 |
| Fixed Asset Turnover | 12.56 | 4.22 |
| Payout ratio | 0% | 0% |
| Dividend yield | 0% | 0% |
Interpretation of the Ratios
Palo Alto Networks, Inc.
Palo Alto Networks shows a mixed ratio profile with favorable net margin (12.3%) and low debt levels, but unfavorable valuation multiples like a high PE of 101.43 and PB of 14.7. Liquidity is weak, with a current ratio below 1. Dividend yield is zero, reflecting no dividend payments, consistent with likely reinvestment in growth and technology development.
Zscaler, Inc.
Zscaler’s ratios reveal challenges, including negative net margin (-1.55%), ROE (-2.31%), and interest coverage, indicating operational losses and financial strain. However, liquidity ratios are strong, with a current ratio of 2.01. Like Palo Alto, Zscaler pays no dividends, likely prioritizing reinvestment and expansion during its growth phase.
Which one has the best ratios?
Palo Alto Networks has a slightly favorable overall ratio profile, with profitability and leverage strengths offsetting valuation and liquidity weaknesses. Zscaler presents a slightly unfavorable picture due to persistent losses and poor coverage ratios, despite solid liquidity. Thus, Palo Alto’s ratios are generally more favorable in this comparison.
Strategic Positioning
This section compares the strategic positioning of Palo Alto Networks, Inc. and Zscaler, Inc. including their market position, key segments, and exposure to technological disruption:
Palo Alto Networks, Inc.
- Leading cybersecurity provider with a large marketCap of $120B, facing moderate competitive pressure.
- Diverse revenue streams from products ($1.8B), subscriptions ($5B), and support ($2.4B) across multiple industries.
- Positioned around firewall appliances, cloud security, and threat intelligence, adapting to evolving cyber threats.
Zscaler, Inc.
- Cloud security specialist with $34B marketCap, competing in a dynamic sector with higher beta risk.
- Focused on cloud security solutions, notably secure access and workload segmentation, with $2.7B revenue in one segment.
- Centered on cloud-native security and digital experience monitoring, emphasizing SaaS and cloud workload protection.
Palo Alto Networks, Inc. vs Zscaler, Inc. Positioning
Palo Alto Networks operates a diversified cybersecurity business with broad industry coverage and a mix of product and service revenues. Zscaler focuses more narrowly on cloud security platforms and SaaS application access, which may offer agility but less diversification.
Which has the best competitive advantage?
Both companies are currently shedding value as ROIC is below WACC but show improving profitability trends. Neither displays a strong economic moat yet, with Palo Alto Networks having a smaller negative spread versus Zscaler.
Stock Comparison
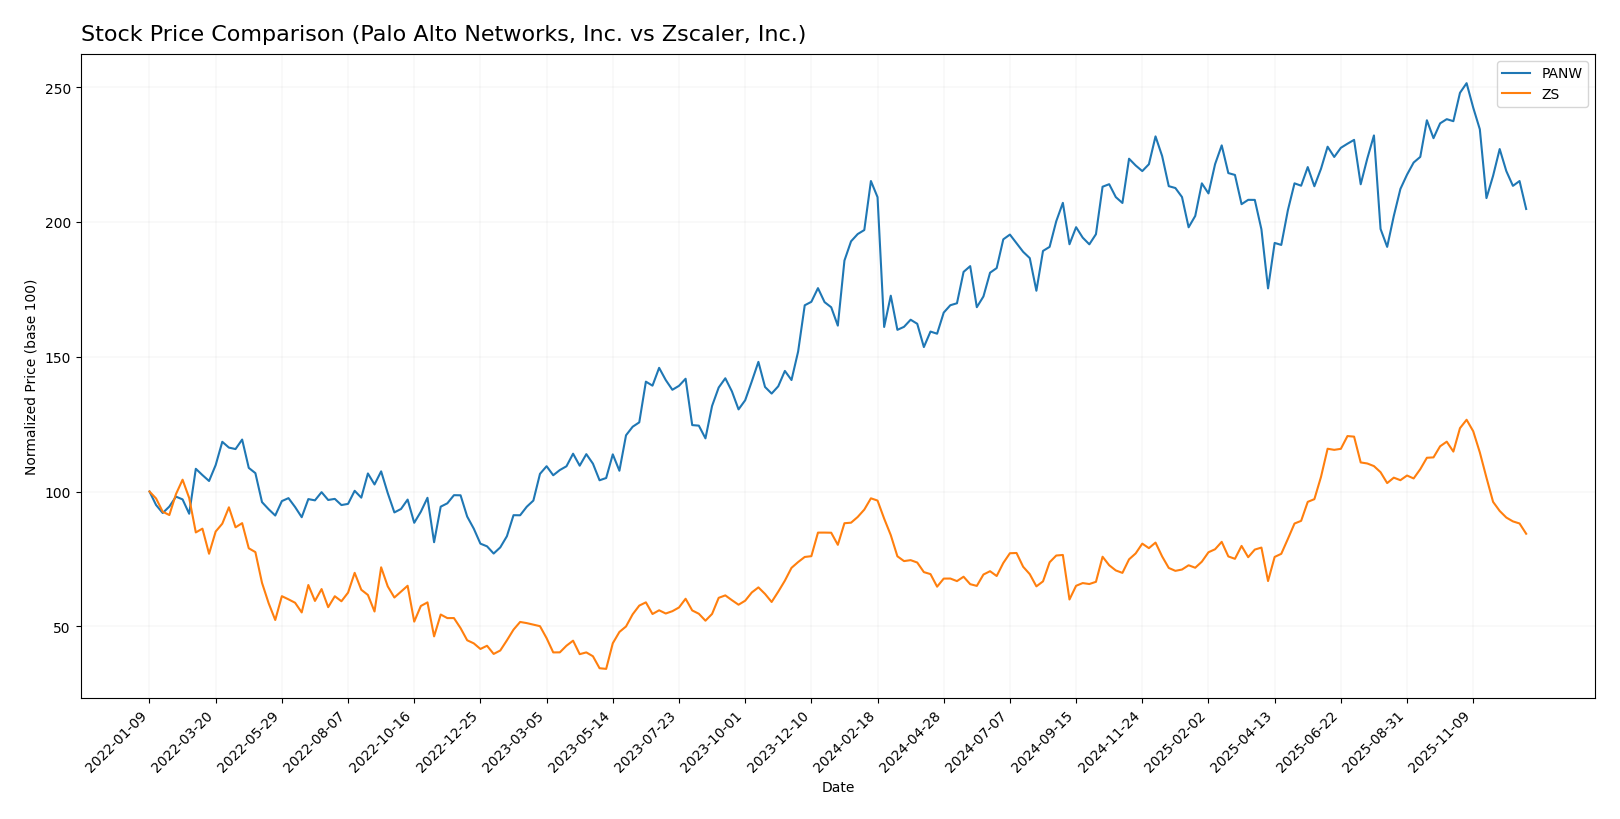
Over the past 12 months, both Palo Alto Networks, Inc. and Zscaler, Inc. experienced notable bearish trends marked by significant price declines and decelerating momentum, reflecting challenging trading dynamics.
Trend Analysis
Palo Alto Networks, Inc. shows a bearish trend with a -4.82% price change over the past year, accompanied by deceleration. The stock fluctuated between 134.51 and 220.24, with moderate volatility (std deviation 19.94).
Zscaler, Inc. also exhibits a bearish trend, with a larger -13.48% price decline and deceleration. The stock’s price ranged from 156.78 to 331.14, showing higher volatility (std deviation 47.29).
Comparing both stocks, Zscaler delivered the steepest negative market performance over the period, underperforming Palo Alto Networks in overall price depreciation.
Target Prices
The current analyst consensus reflects a positive outlook for both Palo Alto Networks, Inc. and Zscaler, Inc.
| Company | Target High | Target Low | Consensus |
|---|---|---|---|
| Palo Alto Networks, Inc. | 250 | 157 | 231.07 |
| Zscaler, Inc. | 360 | 264 | 319.6 |
Analysts expect Palo Alto Networks’ stock to rise significantly above its current price of 179.37 USD, while Zscaler’s consensus target suggests a strong upside from its present 220.57 USD. Both show promising potential with notable upside risk.
Analyst Opinions Comparison
This section compares analysts’ ratings and grades for Palo Alto Networks, Inc. and Zscaler, Inc.:
Rating Comparison
Palo Alto Networks, Inc. Rating
- Rating: B, evaluated as Very Favorable by analysts.
- Discounted Cash Flow Score: 4, indicating favorable future cash flow projections.
- ROE Score: 4, reflecting efficient profit generation from equity.
- ROA Score: 3, showing moderate asset utilization effectiveness.
- Debt To Equity Score: 4, favorable financial risk with low debt reliance.
- Overall Score: 3, a moderate overall financial standing.
Zscaler, Inc. Rating
- Rating: C-, also considered Very Favorable.
- Discounted Cash Flow Score: 4, showing favorable cash flow outlook.
- ROE Score: 1, indicating very unfavorable profit efficiency.
- ROA Score: 1, considered very unfavorable in asset use.
- Debt To Equity Score: 1, very unfavorable due to high debt risk.
- Overall Score: 1, very unfavorable overall financial position.
Which one is the best rated?
Palo Alto Networks, Inc. holds higher ratings and financial scores than Zscaler, Inc., with favorable scores in ROE, ROA, and debt-to-equity metrics, indicating a stronger financial profile overall.
Scores Comparison
Here is a comparison of the Altman Z-Score and Piotroski Score for both companies:
PANW Scores
- Altman Z-Score: 5.77, indicating a safe financial zone.
- Piotroski Score: 6, representing average financial health.
ZS Scores
- Altman Z-Score: 5.24, also indicating a safe zone.
- Piotroski Score: 3, considered very weak financial health.
Which company has the best scores?
PANW has a higher Altman Z-Score and a significantly stronger Piotroski Score compared to ZS, indicating better overall financial health based on the provided metrics.
Grades Comparison
This section presents a detailed comparison of the latest grades assigned to Palo Alto Networks, Inc. and Zscaler, Inc.:
Palo Alto Networks, Inc. Grades
The table below shows recent analyst grades from reputable institutions for Palo Alto Networks, Inc.:
| Grading Company | Action | New Grade | Date |
|---|---|---|---|
| Morgan Stanley | Maintain | Overweight | 2025-12-18 |
| HSBC | Downgrade | Reduce | 2025-11-21 |
| Goldman Sachs | Maintain | Buy | 2025-11-21 |
| Rosenblatt | Maintain | Buy | 2025-11-20 |
| Piper Sandler | Maintain | Overweight | 2025-11-20 |
| Bernstein | Maintain | Outperform | 2025-11-20 |
| WestPark Capital | Maintain | Hold | 2025-11-20 |
| Wedbush | Maintain | Outperform | 2025-11-20 |
| BTIG | Maintain | Buy | 2025-11-20 |
| Oppenheimer | Maintain | Outperform | 2025-11-20 |
Overall, Palo Alto Networks has predominantly maintained positive grades, with most analysts assigning Buy, Outperform, or Overweight ratings, despite one recent downgrade.
Zscaler, Inc. Grades
The following table lists the latest grades from recognized grading companies for Zscaler, Inc.:
| Grading Company | Action | New Grade | Date |
|---|---|---|---|
| Mizuho | Upgrade | Outperform | 2025-12-16 |
| Bernstein | Downgrade | Market Perform | 2025-12-01 |
| Citigroup | Maintain | Buy | 2025-12-01 |
| UBS | Maintain | Buy | 2025-11-26 |
| Bernstein | Maintain | Outperform | 2025-11-26 |
| Scotiabank | Maintain | Sector Outperform | 2025-11-26 |
| JP Morgan | Maintain | Overweight | 2025-11-26 |
| Stifel | Maintain | Buy | 2025-11-26 |
| Needham | Maintain | Buy | 2025-11-26 |
| Mizuho | Maintain | Neutral | 2025-11-26 |
Zscaler’s grades reveal a generally positive outlook with mostly Buy or Outperform ratings, but with some recent variability including a downgrade to Market Perform.
Which company has the best grades?
Comparing the two, Palo Alto Networks holds a slightly more consistent set of positive grades with multiple Buy and Outperform ratings, whereas Zscaler shows some recent rating fluctuations. This consistency may signal steadier analyst confidence, potentially influencing investor decisions on stability and growth expectations.
Strengths and Weaknesses
Below is a comparison table highlighting key strengths and weaknesses of Palo Alto Networks, Inc. (PANW) and Zscaler, Inc. (ZS) based on their most recent financial and strategic data.
| Criterion | Palo Alto Networks, Inc. (PANW) | Zscaler, Inc. (ZS) |
|---|---|---|
| Diversification | Strong product and subscription mix with $1.8B in Products and $4.97B in Subscriptions (2025) | Single reportable segment, less diversified revenue stream ($2.67B in 2025) |
| Profitability | Positive net margin (12.3%), ROIC 5.67%, but ROIC < WACC (-1.77% value creation) | Negative net margin (-1.55%), negative ROIC (-3.18%), ROIC significantly below WACC (-11.7%) |
| Innovation | Growing ROIC trend indicates improving efficiency and innovation | Also shows growing ROIC trend, but remains value destructive |
| Global presence | Large global footprint consistent with market leader status | Growing presence but smaller scale and market share |
| Market Share | Leading cybersecurity company with broad market penetration | Smaller player, focused on cloud security |
Key takeaways: Palo Alto Networks demonstrates stronger diversification and profitability, despite currently shedding value, but with improving efficiency. Zscaler faces greater profitability challenges and less diversification but shows potential in innovation growth. Both require cautious monitoring for investment decisions.
Risk Analysis
Below is a comparison of key risk factors for Palo Alto Networks, Inc. (PANW) and Zscaler, Inc. (ZS) based on the latest 2025 data:
| Metric | Palo Alto Networks, Inc. (PANW) | Zscaler, Inc. (ZS) |
|---|---|---|
| Market Risk | Beta 0.79 (moderate volatility) | Beta 1.07 (higher volatility) |
| Debt level | Low debt-to-equity 0.04 (favorable) | Debt-to-equity 1.0 (neutral) |
| Regulatory Risk | Moderate, due to cybersecurity sector compliance | Moderate, cloud security regulations evolving |
| Operational Risk | Low, with strong asset turnover and operational metrics | Moderate, weaker profitability and efficiency |
| Environmental Risk | Low, software sector with limited direct impact | Low, similar industry profile |
| Geopolitical Risk | Moderate, global operations in sensitive sectors | Moderate, exposure to global cloud services |
The most significant risks are Zscaler’s weak profitability and higher operational risk, indicated by negative margins and low Piotroski score (3). Palo Alto Networks shows a stronger financial position with better debt management and operational efficiency but faces valuation concerns due to high P/E and P/B ratios. Both companies operate in a fast-evolving regulatory environment, which requires close monitoring.
Which Stock to Choose?
Palo Alto Networks, Inc. (PANW) shows favorable income growth with a 116.67% revenue increase over five years and strong profitability metrics, including a 12.3% net margin. Its financial ratios are slightly favorable overall, with low debt and solid interest coverage, though valuation multiples appear stretched and liquidity ratios are weaker. The company’s rating is very favorable, supported by a safe-zone Altman Z-Score and average Piotroski score, despite a slightly unfavorable moat assessment indicating value destruction but improving profitability.
Zscaler, Inc. (ZS) also presents favorable income growth, with a higher 297.13% revenue rise over five years but suffers from negative net margin and profitability ratios. Its financial ratios are slightly unfavorable overall, marked by higher debt levels and weak returns, though liquidity ratios are strong. The rating is very favorable overall, yet its Altman Z-Score is in the safe zone contrasted by a very weak Piotroski score and a slightly unfavorable moat, reflecting ongoing value erosion despite improving ROIC.
Investors prioritizing growth may find Zscaler’s robust revenue expansion and liquidity appealing, while those seeking a balance of profitability and financial stability might lean toward Palo Alto Networks given its stronger margins and healthier debt metrics. The differing risk profiles and financial health metrics suggest that the choice could depend on an investor’s tolerance for risk and preference for growth versus profitability.
Disclaimer: Investment carries a risk of loss of initial capital. The past performance is not a reliable indicator of future results. Be sure to understand risks before making an investment decision.
Go Further
I encourage you to read the complete analyses of Palo Alto Networks, Inc. and Zscaler, Inc. to enhance your investment decisions: