In today’s fast-evolving tech landscape, Palo Alto Networks, Inc. and Veritone, Inc. stand out as key players in software infrastructure. Palo Alto Networks leads in cybersecurity solutions, while Veritone pioneers artificial intelligence computing platforms. Both companies target enterprise clients with innovative technologies, creating an intriguing comparison. As an investor, understanding their market positions and growth potential is crucial—this article will help determine which company offers the most compelling investment opportunity.

Table of contents
Companies Overview
I will begin the comparison between Palo Alto Networks and Veritone by providing an overview of these two companies and their main differences.
Palo Alto Networks Overview
Palo Alto Networks, Inc. specializes in cybersecurity solutions, offering a broad range of products including firewall appliances, security management software, and subscription services for threat prevention and cloud security. The company serves medium to large enterprises, service providers, and government entities across various industries. Headquartered in Santa Clara, California, it is a major player in software infrastructure with a market cap of $128B.
Veritone Overview
Veritone, Inc. provides artificial intelligence computing solutions through its aiWARE platform, which applies machine learning and AI models to extract insights from structured and unstructured data. The company targets media, government, legal, and energy sectors, offering both AI technology and media advertising agency services. Based in Denver, Colorado, Veritone has a market cap of $225M and focuses on AI-driven data analysis and advertising.
Key similarities and differences
Both companies operate within the software infrastructure sector but focus on distinct technologies and markets. Palo Alto Networks centers on cybersecurity with a large enterprise and government customer base, while Veritone leverages AI for data analytics and media services targeting specialized verticals. Their market caps and scale differ significantly, with Palo Alto being a major industry leader and Veritone a smaller, niche player.
Income Statement Comparison
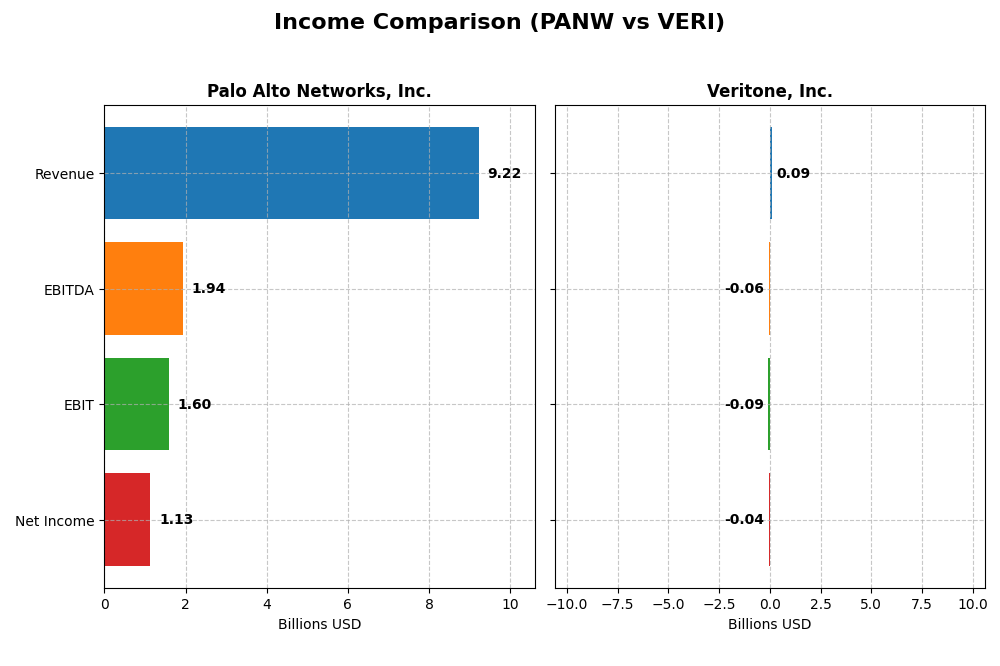
This table compares key income statement metrics for Palo Alto Networks, Inc. and Veritone, Inc. for their most recent fiscal years, providing a snapshot of their financial performance.
| Metric | Palo Alto Networks, Inc. (2025) | Veritone, Inc. (2024) |
|---|---|---|
| Market Cap | 128.4B | 225M |
| Revenue | 9.22B | 93M |
| EBITDA | 1.94B | -59M |
| EBIT | 1.60B | -88M |
| Net Income | 1.13B | -37M |
| EPS | 1.71 | -0.98 |
| Fiscal Year | 2025 | 2024 |
Income Statement Interpretations
Palo Alto Networks, Inc.
From 2021 to 2025, Palo Alto Networks displayed strong revenue growth, more than doubling its top line to $9.22B in 2025. Net income followed a positive trajectory overall, despite a dip in 2025 to $1.13B. Margins remained robust, with a gross margin of 73.41% and EBIT margin of 17.32%. The latest year showed solid revenue and EBIT growth, though net margin and EPS contracted.
Veritone, Inc.
Veritone’s revenue increased by 60.53% over 2020-2024, peaking at $92.6M in 2024 but fell 7.35% from 2023 to 2024. Net income remained negative, though improved to -$37.4M in 2024. Margins were less favorable, with a gross margin of 70.58%, but negative EBIT and net margins of -95.13% and -40.36%. The most recent year saw reduced revenue and EBIT decline, though net margin and EPS improved.
Which one has the stronger fundamentals?
Palo Alto Networks exhibits stronger fundamentals, supported by higher revenue scale, consistent margin strength, and significant overall growth in net income and EPS. While Veritone shows some improvement in net margin and EPS growth, its persistent losses and negative operating margins suggest weaker operational efficiency compared to Palo Alto Networks’ predominantly favorable income statement metrics.
Financial Ratios Comparison
The table below compares key financial ratios for Palo Alto Networks, Inc. (PANW) and Veritone, Inc. (VERI) based on their most recent fiscal year data.
| Ratios | Palo Alto Networks, Inc. (2025) | Veritone, Inc. (2024) |
|---|---|---|
| ROE | 14.49% | -277.91% |
| ROIC | 5.67% | -58.27% |
| P/E | 101.4 | -3.34 |
| P/B | 14.70 | 9.27 |
| Current Ratio | 0.89 | 0.97 |
| Quick Ratio | 0.89 | 0.97 |
| D/E | 0.04 | 8.91 |
| Debt-to-Assets | 1.43% | 60.54% |
| Interest Coverage | 414.3 | -7.31 |
| Asset Turnover | 0.39 | 0.47 |
| Fixed Asset Turnover | 12.56 | 8.51 |
| Payout Ratio | 0 | 0 |
| Dividend Yield | 0% | 0% |
Interpretation of the Ratios
Palo Alto Networks, Inc.
Palo Alto Networks exhibits a mix of strong and weak ratios. The company benefits from favorable net margin (12.3%), low debt-to-equity (0.04), and high interest coverage (532.53), yet faces concerns with a high P/E ratio (101.43) and low current ratio (0.89). No dividends are paid, reflecting a reinvestment strategy consistent with its growth focus.
Veritone, Inc.
Veritone’s financial ratios are largely unfavorable, with a negative net margin (-40.36%), very weak ROE (-277.91%), and high debt-to-assets (60.54%). Despite a favorable P/E due to negative earnings, the company struggles with liquidity (current ratio 0.97) and interest coverage (-7.3). It pays no dividends, likely prioritizing R&D and acquisitions amid losses.
Which one has the best ratios?
Palo Alto Networks holds a slightly favorable rating overall, balancing profitability and low leverage, while Veritone shows a very unfavorable profile with significant profitability and solvency challenges. Palo Alto’s stronger asset management and lower debt risks position it more favorably in terms of financial ratios compared to Veritone.
Strategic Positioning
This section compares the strategic positioning of Palo Alto Networks and Veritone, including market position, key segments, and exposure to disruption:
Palo Alto Networks
- Leading cybersecurity provider with strong market cap and moderate competitive pressure
- Key segments include firewall products, subscriptions, and support services driving revenue growth
- Exposed to technological disruption in cybersecurity innovations and cloud security evolution
Veritone
- Small AI software firm facing high beta and intense competition
- Focus on AI platform, licensing, managed services, and advertising revenue streams
- Faces disruption risks linked to rapid AI technology advancements and media services
Palo Alto Networks vs Veritone Positioning
Palo Alto Networks pursues a diversified approach with broad cybersecurity offerings across industries, while Veritone concentrates on AI-driven software and media services. Palo Alto’s scale offers wider market reach, whereas Veritone faces higher volatility and niche focus.
Which has the best competitive advantage?
Palo Alto Networks shows a slightly unfavorable moat with growing profitability despite value destruction. Veritone’s moat is very unfavorable, with declining profitability and value destruction, indicating weaker competitive advantage based on the MOAT evaluation.
Stock Comparison
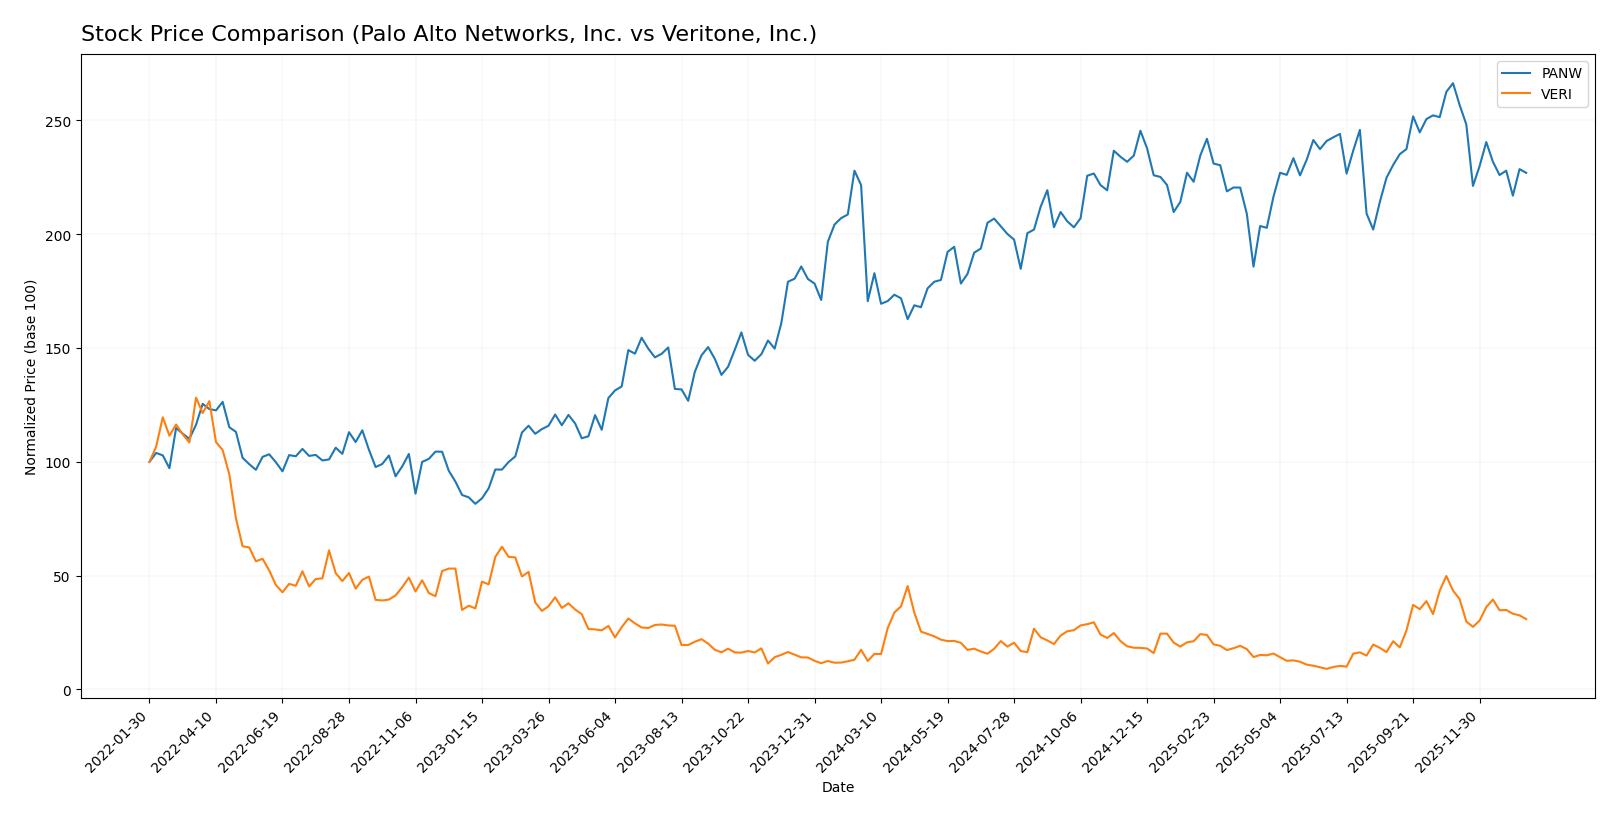
Over the past 12 months, Palo Alto Networks, Inc. and Veritone, Inc. have both exhibited bullish trends, with notable price appreciations and recent decelerations in upward momentum.
Trend Analysis
Palo Alto Networks, Inc. (PANW) showed a 33.05% price increase over the past year, indicating a bullish trend with decelerating momentum and a volatility reflected by a 19.95 standard deviation. The stock peaked at 220.24 and bottomed at 134.51.
Veritone, Inc. (VERI) experienced a 147.22% price increase over the same period, also bullish with deceleration and a much lower volatility at 1.26 standard deviation. Its highest price reached 7.18 and lowest was 1.3.
Comparing both, Veritone delivered the highest market performance with a significantly larger price increase, despite both stocks showing deceleration and recent downward trends.
Target Prices
Analyst consensus presents a clear outlook for Palo Alto Networks and Veritone, indicating potential price movements.
| Company | Target High | Target Low | Consensus |
|---|---|---|---|
| Palo Alto Networks, Inc. | 265 | 157 | 231.07 |
| Veritone, Inc. | 10 | 9 | 9.5 |
The consensus target for Palo Alto Networks is significantly above its current price of 187.66, suggesting upside potential. For Veritone, the target consensus of 9.5 is more than double the current price of 4.45, indicating strong growth expectations.
Analyst Opinions Comparison
This section compares analysts’ ratings and grades for Palo Alto Networks, Inc. and Veritone, Inc.:
Rating Comparison
Palo Alto Networks, Inc. Rating
- Rating: B, evaluated as Very Favorable overall.
- Discounted Cash Flow Score: 4, indicating a Favorable valuation.
- ROE Score: 4, showing Favorable profitability from equity.
- ROA Score: 3, representing Moderate asset utilization.
- Debt To Equity Score: 4, reflecting Favorable financial risk.
- Overall Score: 3, assessed as Moderate financial standing.
Veritone, Inc. Rating
- Rating: C, evaluated as Very Favorable overall.
- Discounted Cash Flow Score: 5, indicating a Very Favorable valuation.
- ROE Score: 1, indicating Very Unfavorable profitability.
- ROA Score: 1, indicating Very Unfavorable asset utilization.
- Debt To Equity Score: 1, reflecting Very Unfavorable financial risk.
- Overall Score: 2, assessed as Moderate financial standing.
Which one is the best rated?
Based strictly on provided data, Palo Alto Networks holds a higher rating of B compared to Veritone’s C, supported by stronger ROE, ROA, and debt-to-equity scores, despite Veritone’s better discounted cash flow score.
Scores Comparison
Here is a comparison of the Altman Z-Score and Piotroski Score for the two companies:
Palo Alto Networks, Inc. Scores
- Altman Z-Score: 5.95, indicating a safe zone, low bankruptcy risk.
- Piotroski Score: 6, classified as average financial strength.
Veritone, Inc. Scores
- Altman Z-Score: -0.07, indicating distress zone, high bankruptcy risk.
- Piotroski Score: 3, classified as very weak financial strength.
Which company has the best scores?
Palo Alto Networks, Inc. shows a strong Altman Z-Score in the safe zone and a moderate Piotroski Score, while Veritone, Inc. is in distress zone and has a very weak Piotroski Score. Palo Alto Networks has clearly stronger scores based on this data.
Grades Comparison
The grades assigned to Palo Alto Networks, Inc. and Veritone, Inc. by various grading companies are as follows:
Palo Alto Networks, Inc. Grades
The table below summarizes recent grades from reputable grading companies for Palo Alto Networks, Inc.:
| Grading Company | Action | New Grade | Date |
|---|---|---|---|
| UBS | Maintain | Neutral | 2026-01-13 |
| Piper Sandler | Maintain | Overweight | 2026-01-05 |
| Guggenheim | Upgrade | Neutral | 2026-01-05 |
| Morgan Stanley | Maintain | Overweight | 2025-12-18 |
| Goldman Sachs | Maintain | Buy | 2025-11-21 |
| HSBC | Downgrade | Reduce | 2025-11-21 |
| Needham | Maintain | Buy | 2025-11-20 |
| WestPark Capital | Maintain | Hold | 2025-11-20 |
| Bernstein | Maintain | Outperform | 2025-11-20 |
| DA Davidson | Maintain | Buy | 2025-11-20 |
Palo Alto Networks’ grades show a generally positive trend, with multiple buy and overweight ratings, though a few hold and reduce ratings indicate some caution.
Veritone, Inc. Grades
The table below presents recent grades from reputable grading companies for Veritone, Inc.:
| Grading Company | Action | New Grade | Date |
|---|---|---|---|
| D. Boral Capital | Maintain | Buy | 2025-12-09 |
| D. Boral Capital | Maintain | Buy | 2025-12-04 |
| Needham | Maintain | Buy | 2025-12-02 |
| D. Boral Capital | Maintain | Buy | 2025-12-02 |
| D. Boral Capital | Maintain | Buy | 2025-11-07 |
| D. Boral Capital | Maintain | Buy | 2025-10-28 |
| HC Wainwright & Co. | Maintain | Buy | 2025-10-20 |
| D. Boral Capital | Maintain | Buy | 2025-10-15 |
| D. Boral Capital | Maintain | Buy | 2025-09-24 |
| D. Boral Capital | Maintain | Buy | 2025-09-09 |
Veritone, Inc. consistently holds buy ratings from its grading companies, showing a stable and unanimous positive outlook.
Which company has the best grades?
Both companies have a consensus rating of “Buy,” but Palo Alto Networks has a broader range of grades including some neutral and reduce ratings, while Veritone shows consistently maintained buy ratings. This consistency in Veritone’s grades could suggest steadier analyst confidence, which may influence investor sentiment differently compared to the more varied opinions for Palo Alto Networks.
Strengths and Weaknesses
The table below summarizes the key strengths and weaknesses of Palo Alto Networks, Inc. (PANW) and Veritone, Inc. (VERI) based on their recent financial performance, market position, and operational metrics.
| Criterion | Palo Alto Networks, Inc. (PANW) | Veritone, Inc. (VERI) |
|---|---|---|
| Diversification | Strong product and subscription mix with $1.8B in products and $4.97B in subscriptions (2025) | Limited diversification; revenue mainly from software products and managed services totaling ~$80M (2024) |
| Profitability | Positive net margin at 12.3%, growing ROIC at 5.67% though slightly below WACC, indicating improving profitability | Negative net margin (-40.36%) and declining ROIC (-58.27%), indicating ongoing losses and value destruction |
| Innovation | High fixed asset turnover (12.56) suggests efficient use of assets; strong investment in subscriptions and support services | Lower fixed asset turnover (8.51) but struggling with operational inefficiencies and high debt levels |
| Global presence | Large global footprint reflected in subscription growth and support revenues | Smaller scale with niche market focus and limited global reach |
| Market Share | Leading cybersecurity firm with expanding subscription base and services | Small market presence with significant financial challenges and shrinking profitability |
Key takeaways: Palo Alto Networks shows solid growth and improving profitability with a diversified revenue base, though it faces some valuation and liquidity concerns. Veritone struggles with profitability, high leverage, and limited market penetration, making it a riskier investment at this stage.
Risk Analysis
Below is a comparison table summarizing key risk factors for Palo Alto Networks, Inc. (PANW) and Veritone, Inc. (VERI) based on the most recent data from 2025 and 2024.
| Metric | Palo Alto Networks, Inc. (PANW) | Veritone, Inc. (VERI) |
|---|---|---|
| Market Risk | Moderate (Beta 0.75) | High (Beta 2.05) |
| Debt level | Very Low (Debt/Equity 0.04) | Very High (Debt/Equity 8.91) |
| Regulatory Risk | Moderate (Technology sector) | Moderate (AI software sector) |
| Operational Risk | Low (Strong operational metrics) | High (Negative profitability) |
| Environmental Risk | Low to Moderate | Low to Moderate |
| Geopolitical Risk | Moderate (Global operations) | Moderate (US & UK focus) |
Palo Alto Networks shows lower financial and operational risks with strong liquidity and debt management, while Veritone faces significant financial distress risks, including high leverage and negative profitability, increasing its bankruptcy probability. Market volatility impacts Veritone more, given its higher beta. Investors should weigh these factors carefully when allocating capital.
Which Stock to Choose?
Palo Alto Networks, Inc. (PANW) shows a favorable income evolution with 14.87% revenue growth in one year and 116.67% over five years. Its profitability is solid, with a 12.3% net margin and improving ROIC, though it faces some ratio weaknesses like a low current ratio and high valuation multiples. The company carries minimal debt and holds a very favorable overall rating.
Veritone, Inc. (VERI) experiences mixed income trends, with a 7.35% revenue decline last year but positive net margin and EPS growth over the overall period. Profitability remains challenged with a negative net margin of -40.36%, and financial ratios are largely unfavorable, reflecting high debt and weak returns. The rating is very favorable overall despite financial distress signals.
Investors seeking stable growth and improving profitability might find PANW’s strong income and rating profile more aligned with their goals, while those with higher risk tolerance focusing on turnaround potential could interpret VERI’s price appreciation and recent improvements as interesting. The choice depends on individual risk appetite and investment strategy.
Disclaimer: Investment carries a risk of loss of initial capital. The past performance is not a reliable indicator of future results. Be sure to understand risks before making an investment decision.
Go Further
I encourage you to read the complete analyses of Palo Alto Networks, Inc. and Veritone, Inc. to enhance your investment decisions: