In the rapidly evolving technology sector, Palo Alto Networks, Inc. (PANW) and VeriSign, Inc. (VRSN) stand out as leaders in software infrastructure with strong market positions. Both companies focus on cybersecurity and internet infrastructure, addressing critical needs for secure and reliable digital environments. This analysis will explore their innovation strategies and market dynamics to help you decide which company offers the most compelling investment opportunity in 2026.

Table of contents
Companies Overview
I will begin the comparison between Palo Alto Networks and VeriSign by providing an overview of these two companies and their main differences.
Palo Alto Networks Overview
Palo Alto Networks, Inc. specializes in cybersecurity solutions worldwide, offering firewall appliances, software, and comprehensive security services like threat prevention and cloud security. It serves medium to large enterprises, service providers, and government entities across diverse industries. Founded in 2005 and headquartered in Santa Clara, California, the company is a major player in the software infrastructure sector with a market cap of $128B.
VeriSign Overview
VeriSign, Inc. focuses on domain name registry services and internet infrastructure, supporting global internet navigation and e-commerce through the management of .com and .net domains. The company also operates root zone services and provides security and data integrity solutions. Established in 1995 in Reston, Virginia, VeriSign has a market cap of $23B and is recognized for its role in maintaining internet stability.
Key similarities and differences
Both Palo Alto Networks and VeriSign operate within the software infrastructure industry, providing essential services that support internet security and functionality. However, Palo Alto Networks emphasizes cybersecurity products and threat prevention across various sectors, while VeriSign centers on domain registry and internet infrastructure stability. Their market capitalizations and employee counts also differ significantly, reflecting distinct scales and operational focuses.
Income Statement Comparison
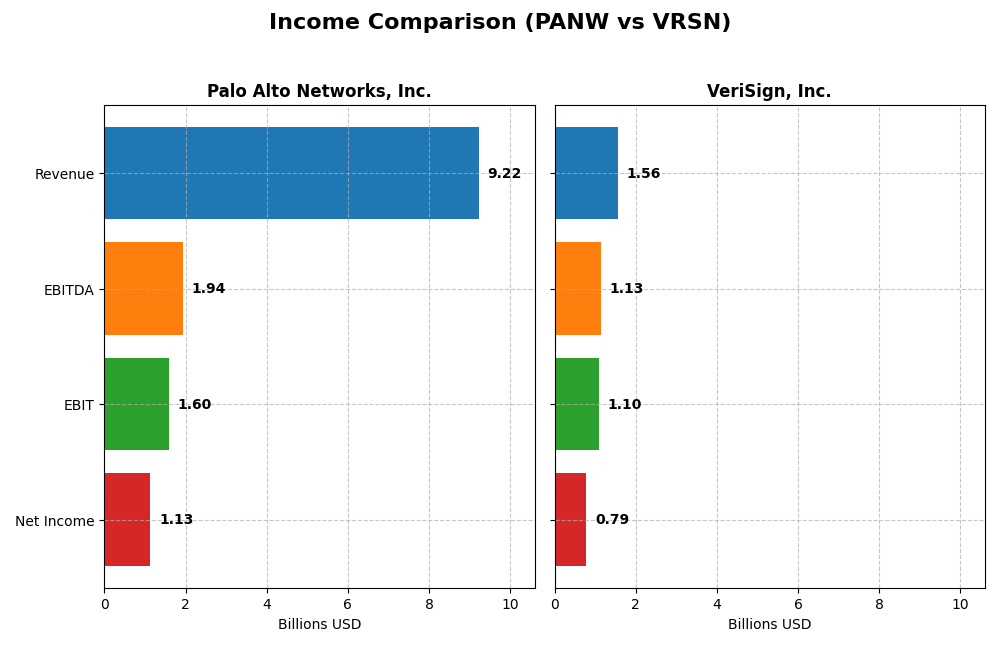
The table below presents a side-by-side comparison of key income statement metrics for Palo Alto Networks, Inc. and VeriSign, Inc. for their most recent fiscal years.
| Metric | Palo Alto Networks, Inc. (2025) | VeriSign, Inc. (2024) |
|---|---|---|
| Market Cap | 128.4B | 23.1B |
| Revenue | 9.22B | 1.56B |
| EBITDA | 1.94B | 1.13B |
| EBIT | 1.60B | 1.10B |
| Net Income | 1.13B | 786M |
| EPS | 1.71 | 8.01 |
| Fiscal Year | 2025 | 2024 |
Income Statement Interpretations
Palo Alto Networks, Inc.
From 2021 to 2025, Palo Alto Networks displayed strong revenue growth, climbing from $4.3B to $9.2B, with net income improving markedly despite a dip in the most recent year. Margins generally trended favorably; gross margin remained high at 73.4% in 2025. However, net margin and EPS declined last year, reflecting some pressure on profitability despite solid operational gains.
VeriSign, Inc.
VeriSign’s revenue increased steadily from $1.27B in 2020 to $1.56B in 2024, with net income fluctuating slightly but remaining robust at $786M in the latest year. Margins are notably strong, with a gross margin of 87.7% and net margin of 50.4% in 2024. Recent growth rates in revenue and EBIT were moderate, with a slight contraction in net margin last year.
Which one has the stronger fundamentals?
Palo Alto Networks shows stronger revenue and net income growth over the long term, alongside improving margins except for recent net margin softness. VeriSign boasts higher margins and stable profitability but experiences mixed net income growth and a net margin decline over the period. Both have favorable income statements, with Palo Alto Networks showing more dynamic growth and VeriSign exhibiting more consistent margin strength.
Financial Ratios Comparison
The table below presents the latest available financial ratios for Palo Alto Networks, Inc. and VeriSign, Inc., offering a snapshot of their financial health and performance metrics.
| Ratios | Palo Alto Networks, Inc. (2025) | VeriSign, Inc. (2024) |
|---|---|---|
| ROE | 14.49% | -40.13% |
| ROIC | 5.17% | 451.00% |
| P/E | 101.43 | 25.84 |
| P/B | 14.70 | -10.37 |
| Current Ratio | 0.89 | 0.43 |
| Quick Ratio | 0.89 | 0.43 |
| D/E (Debt-to-Equity) | 0.04 | -0.92 |
| Debt-to-Assets | 1.43% | 128.08% |
| Interest Coverage | 414.3 | 14.05 |
| Asset Turnover | 0.39 | 1.11 |
| Fixed Asset Turnover | 12.56 | 6.66 |
| Payout Ratio | 0% | 0% |
| Dividend Yield | 0% | 0% |
Interpretation of the Ratios
Palo Alto Networks, Inc.
Palo Alto Networks shows a mix of favorable and unfavorable financial ratios, with strong interest coverage and low debt levels, but weak liquidity indicated by a current ratio below 1. Asset turnover is low, which may suggest inefficiency. The company does not pay dividends, likely reflecting a reinvestment strategy focused on growth and innovation rather than shareholder payouts.
VeriSign, Inc.
VeriSign presents mostly favorable ratios, including an excellent net margin and strong asset turnover, though it faces concerns with a negative return on equity and a high debt-to-assets ratio above 100%. The current and quick ratios are weak, indicating liquidity risks. VeriSign also does not pay dividends, prioritizing reinvestment and operational stability over direct returns.
Which one has the best ratios?
VeriSign exhibits a more favorable overall ratio profile, with 57% favorable metrics compared to Palo Alto Networks’ 43%, despite some liquidity and leverage concerns. Palo Alto Networks, while showing strengths in debt management and interest coverage, has more unfavorable ratios including valuation and liquidity, positioning VeriSign as having the better financial ratio set based on this analysis.
Strategic Positioning
This section compares the strategic positioning of Palo Alto Networks and VeriSign, including market position, key segments, and exposure to technological disruption:
Palo Alto Networks
- Leading cybersecurity provider facing competition in software infrastructure
- Cybersecurity products, subscriptions, support; broad enterprise and government client base
- Exposure to rapid cybersecurity technology changes and evolving threats
VeriSign
- Specialist in domain registry with limited direct competition
- Domain name registry services for .com, .net, and other domains
- Relatively stable internet infrastructure with lower disruption risk
Palo Alto Networks vs VeriSign Positioning
Palo Alto Networks pursues a diversified cybersecurity offering across multiple segments, while VeriSign focuses on concentrated domain registry services. Palo Alto has broader market exposure but faces higher competitive pressure; VeriSign benefits from niche specialization and infrastructure stability.
Which has the best competitive advantage?
VeriSign demonstrates a very favorable moat with strong ROIC well above WACC and growing profitability, indicating a durable competitive advantage. Palo Alto Networks shows slightly unfavorable moat status, shedding value despite improving ROIC trends.
Stock Comparison
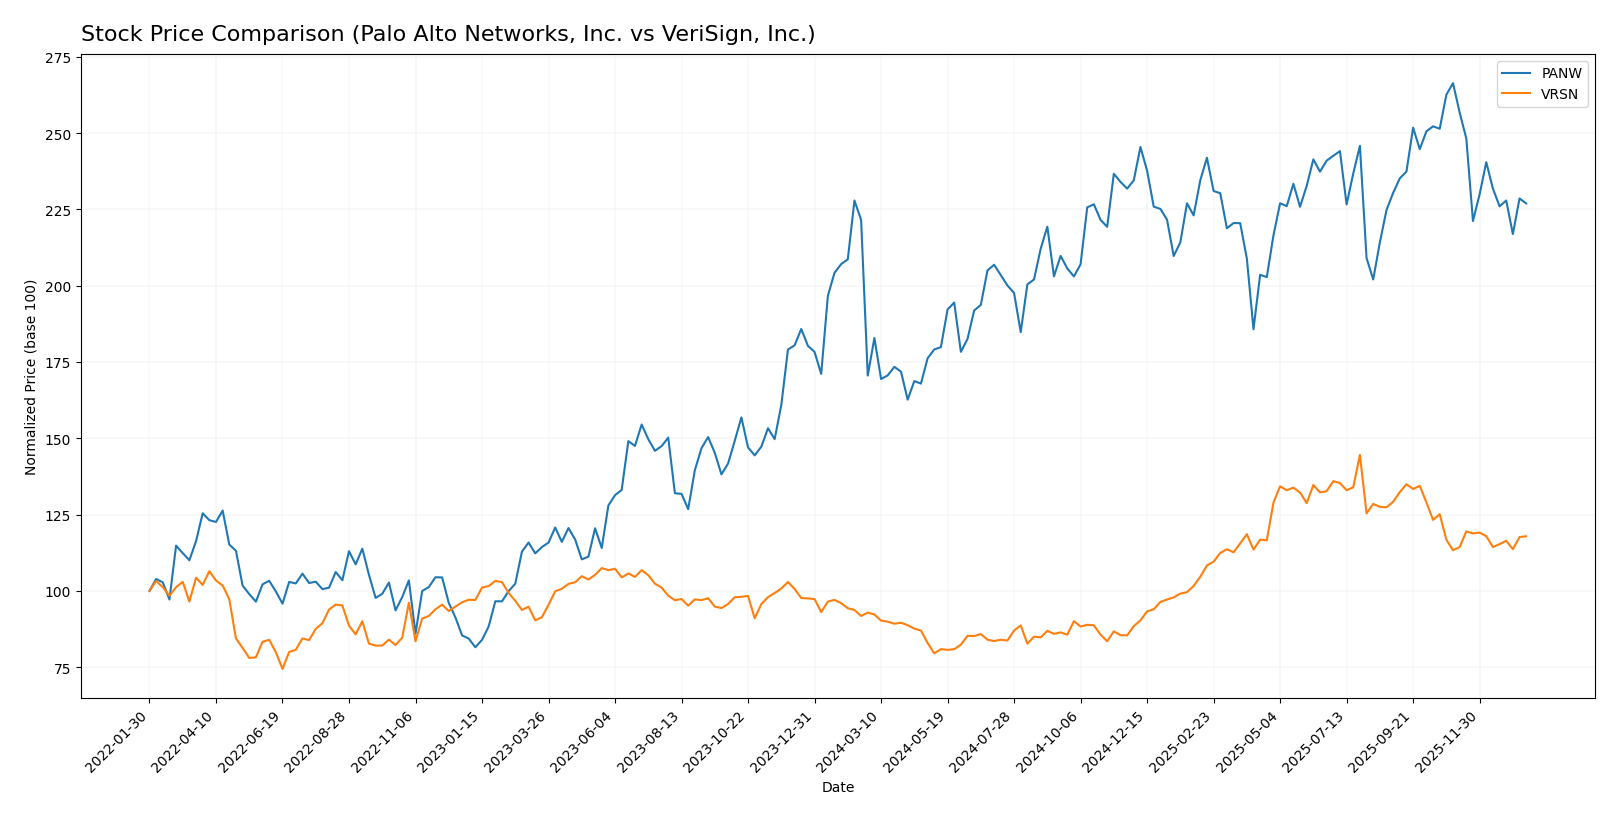
The stock prices of Palo Alto Networks, Inc. and VeriSign, Inc. have shown significant bullish momentum over the past 12 months, with Palo Alto Networks exhibiting a stronger overall gain but recent weakness, while VeriSign’s price trend remains stable with modest recent growth.
Trend Analysis
Palo Alto Networks, Inc. recorded a 33.05% price increase over the past year, indicating a bullish trend with decelerating momentum and notable volatility (std. dev. 19.95). The stock peaked at 220.24 and bottomed at 134.51.
VeriSign, Inc. posted a 26.92% gain over the same period, also bullish with deceleration and higher volatility (std. dev. 40.88). Its price reached a high of 305.79 and a low of 168.32, with a slight positive trend recently (+4.03%).
Comparing both, Palo Alto Networks delivered the highest market performance with a 33.05% gain versus VeriSign’s 26.92%, despite recent short-term weakness in PANW’s stock price.
Target Prices
The current analyst consensus on target prices indicates potential upside for both Palo Alto Networks, Inc. and VeriSign, Inc.
| Company | Target High | Target Low | Consensus |
|---|---|---|---|
| Palo Alto Networks, Inc. | 265 | 157 | 231.07 |
| VeriSign, Inc. | 325 | 325 | 325 |
Analysts expect Palo Alto Networks’ stock to rise from its current price of $187.66 to a consensus target of $231.07, while VeriSign’s current price of $249.47 is also forecasted to increase to $325. Both show upside potential reflecting positive market sentiment.
Analyst Opinions Comparison
This section compares analysts’ ratings and grades for Palo Alto Networks, Inc. and VeriSign, Inc.:
Rating Comparison
PANW Rating
- Rating: B, classified as Very Favorable based on overall financial standing.
- Discounted Cash Flow Score: 4, indicating a Favorable outlook on future cash flow valuation.
- ROE Score: 4, Favorable, demonstrating efficient profit generation from shareholders’ equity.
- ROA Score: 3, Moderate, showing average effectiveness in utilizing assets to generate earnings.
- Debt To Equity Score: 4, Favorable, reflecting a strong balance sheet with low financial risk.
- Overall Score: 3, Moderate, summarizing the general financial health and performance.
VRSN Rating
- Rating: B-, also considered Very Favorable but slightly lower than PANW.
- Discounted Cash Flow Score: 4, similarly Favorable, showing comparable valuation prospects.
- ROE Score: 1, Very Unfavorable, indicating less efficiency in generating profits from equity.
- ROA Score: 5, Very Favorable, highlighting strong asset utilization to produce earnings.
- Debt To Equity Score: 1, Very Unfavorable, suggesting higher financial risk due to reliance on debt.
- Overall Score: 2, Moderate, slightly lower than PANW, indicating a weaker overall financial position.
Which one is the best rated?
Based strictly on the provided data, PANW holds a higher overall rating (B vs. B-) and better scores in ROE and Debt to Equity, while VRSN excels in ROA but scores lower overall. Therefore, PANW is the better rated company according to these metrics.
Scores Comparison
The following table presents a direct comparison of Palo Alto Networks and VeriSign scores:
Palo Alto Networks Scores
- Altman Z-Score of 5.95 indicates a safe zone status.
- Piotroski Score of 6 reflects an average financial health.
VeriSign Scores
- Altman Z-Score of -4.67 indicates a distress zone status.
- Piotroski Score of 8 reflects a very strong financial health.
Which company has the best scores?
Palo Alto Networks shows a safer financial stability with an Altman Z-Score in the safe zone, whereas VeriSign is in distress by this metric. Conversely, VeriSign’s Piotroski Score is stronger, indicating better financial strength than Palo Alto Networks.
Grades Comparison
Here is a comparison of the latest available grading data for Palo Alto Networks, Inc. and VeriSign, Inc.:
Palo Alto Networks, Inc. Grades
Below is the table of recent grades for Palo Alto Networks from reputable grading firms.
| Grading Company | Action | New Grade | Date |
|---|---|---|---|
| UBS | Maintain | Neutral | 2026-01-13 |
| Piper Sandler | Maintain | Overweight | 2026-01-05 |
| Guggenheim | Upgrade | Neutral | 2026-01-05 |
| Morgan Stanley | Maintain | Overweight | 2025-12-18 |
| Goldman Sachs | Maintain | Buy | 2025-11-21 |
| HSBC | Downgrade | Reduce | 2025-11-21 |
| Needham | Maintain | Buy | 2025-11-20 |
| WestPark Capital | Maintain | Hold | 2025-11-20 |
| Bernstein | Maintain | Outperform | 2025-11-20 |
| DA Davidson | Maintain | Buy | 2025-11-20 |
The grading trend for Palo Alto Networks shows a majority of buy and overweight ratings, with a few hold and one downgrade to reduce, indicating mixed but generally positive sentiment.
VeriSign, Inc. Grades
Below is the table of recent grades for VeriSign from recognized grading firms.
| Grading Company | Action | New Grade | Date |
|---|---|---|---|
| JP Morgan | Maintain | Neutral | 2026-01-06 |
| Baird | Maintain | Outperform | 2025-07-01 |
| Baird | Maintain | Outperform | 2025-04-25 |
| Baird | Maintain | Outperform | 2025-04-01 |
| Citigroup | Maintain | Buy | 2025-02-04 |
| Citigroup | Maintain | Buy | 2025-01-03 |
| Baird | Upgrade | Outperform | 2024-12-09 |
| Baird | Maintain | Neutral | 2024-06-27 |
| Baird | Maintain | Neutral | 2024-04-26 |
| Citigroup | Maintain | Buy | 2024-04-02 |
VeriSign’s grades consistently show buy and outperform recommendations, with multiple upgrades, reflecting a stable and positive analyst outlook.
Which company has the best grades?
Both Palo Alto Networks and VeriSign have consensus ratings of “Buy,” but VeriSign shows a more consistent pattern of outperform and buy grades with fewer downgrades, potentially implying steadier analyst confidence. This may impact investors differently depending on their tolerance for mixed signals versus consistent ratings.
Strengths and Weaknesses
Below is a comparison of key strengths and weaknesses for Palo Alto Networks, Inc. (PANW) and VeriSign, Inc. (VRSN), based on the most recent financial and competitive data.
| Criterion | Palo Alto Networks, Inc. (PANW) | VeriSign, Inc. (VRSN) |
|---|---|---|
| Diversification | Moderate product and subscription revenue mix; strong growth in subscriptions | Limited product range focused on domain services |
| Profitability | Net margin 12.3%, ROIC 5.67%, but ROIC < WACC indicates value destruction | Very high net margin 50.45%, ROIC 451%, strong value creation |
| Innovation | Growing ROIC trend signals improving profitability and innovation | Durable competitive advantage with growing ROIC; strong innovation moat |
| Global presence | Significant global cybersecurity footprint with expanding subscriptions | Global presence in domain name services, a niche but critical market |
| Market Share | Strong in cybersecurity with growing subscription base | Dominant in domain registry market, with high profitability |
Key takeaways: VeriSign demonstrates a very favorable economic moat with exceptional profitability and a durable competitive advantage. Palo Alto Networks is growing profitability and innovation but currently sheds value, reflecting a need for cautious investment consideration despite its strong market position.
Risk Analysis
Below is a comparative risk table for Palo Alto Networks, Inc. (PANW) and VeriSign, Inc. (VRSN) based on the most recent data from 2025 and 2024.
| Metric | Palo Alto Networks, Inc. (PANW) | VeriSign, Inc. (VRSN) |
|---|---|---|
| Market Risk | Beta 0.75 (moderate volatility) | Beta 0.77 (moderate volatility) |
| Debt Level | Low debt-to-assets 1.43% (favorable) | High debt-to-assets 128.08% (unfavorable) |
| Regulatory Risk | Moderate, cybersecurity sector highly regulated | Moderate, internet infrastructure with government contracts |
| Operational Risk | Medium, complex software and cloud security services | Medium, dependency on .com and .net domains infrastructure |
| Environmental Risk | Low, primarily software business | Low, primarily software and internet infrastructure |
| Geopolitical Risk | Moderate, exposure to global cybersecurity threats | Moderate, internet governance and geopolitical tensions impact |
Synthesis: VeriSign faces high financial risk due to its elevated debt levels and is in the distress zone per Altman Z-Score, despite strong operational scores. Palo Alto Networks shows a safer financial position with low debt and moderate market risk but carries valuation risks due to high P/E and P/B ratios. Investors should weigh VeriSign’s financial distress against its strong core business and Palo Alto Networks’ growth potential with cautious valuation.
Which Stock to Choose?
Palo Alto Networks, Inc. (PANW) shows a favorable income evolution with strong revenue and net income growth overall, supported by a solid gross margin and EBIT margin. Its financial ratios are slightly favorable, with notable strengths in debt management and interest coverage, but valuations appear stretched. Despite a growing ROIC, its value creation is slightly unfavorable, and the company holds a very favorable B rating.
VeriSign, Inc. (VRSN) presents a favorable income statement with high profitability margins but mixed growth results, including declining net income over the period. Its financial ratios are generally favorable, particularly in asset turnover and ROIC, though it faces challenges in debt-to-equity and liquidity ratios. VRSN has a very favorable rating and a very favorable moat status, reflecting durable competitive advantage despite some financial risks.
Investors focused on quality and competitive advantage might find VeriSign’s very favorable moat and financial ratios appealing, while those valuing strong income growth and solid debt metrics could interpret Palo Alto Networks’ profile as attractive. Risk-tolerant investors might weigh VRSN’s higher volatility against PANW’s valuation concerns. Ultimately, the choice could depend on the investor’s preference for growth dynamics versus established value creation.
Disclaimer: Investment carries a risk of loss of initial capital. The past performance is not a reliable indicator of future results. Be sure to understand risks before making an investment decision.
Go Further
I encourage you to read the complete analyses of Palo Alto Networks, Inc. and VeriSign, Inc. to enhance your investment decisions: