In today’s fast-evolving technology landscape, Palo Alto Networks, Inc. (PANW) and UiPath Inc. (PATH) stand out as leaders in software infrastructure, each driving innovation in cybersecurity and automation respectively. Both companies cater to enterprise clients seeking advanced solutions, making them natural peers for comparison. This article will dissect their strategies and market positions to reveal which offers the most compelling opportunity for an investor like you.

Table of contents
Companies Overview
I will begin the comparison between Palo Alto Networks and UiPath by providing an overview of these two companies and their main differences.
Palo Alto Networks Overview
Palo Alto Networks, Inc. specializes in cybersecurity solutions, offering firewall appliances, software, and subscription services focused on threat prevention and cloud security. The company serves medium to large enterprises, service providers, and governments across various industries. Founded in 2005 and headquartered in Santa Clara, California, it holds a strong position in the software infrastructure market with a market cap of 128B USD.
UiPath Overview
UiPath Inc. delivers an end-to-end automation platform centered on robotic process automation (RPA), combining AI and visualization tools to streamline business processes. It targets sectors such as banking, healthcare, and government, offering software, maintenance, and professional services. Founded in 2005 and based in New York City, UiPath operates primarily in the US, Romania, and Japan, with a market cap of approximately 7.7B USD.
Key similarities and differences
Both companies operate in the software infrastructure industry, focusing on technology-driven solutions for enterprise clients. Palo Alto Networks emphasizes cybersecurity products and services, while UiPath concentrates on automation through RPA and AI. Additionally, Palo Alto Networks has a significantly larger market cap and workforce, reflecting its established presence compared to UiPath’s more specialized automation platform approach.
Income Statement Comparison
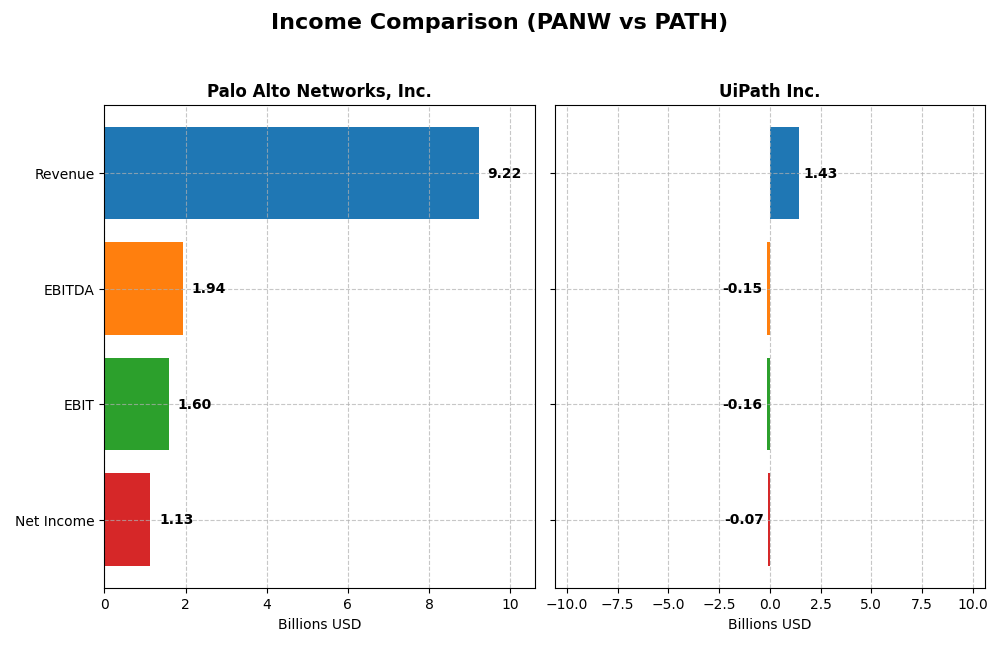
This table compares the key income statement metrics for Palo Alto Networks, Inc. and UiPath Inc. for the most recent fiscal year available.
| Metric | Palo Alto Networks, Inc. | UiPath Inc. |
|---|---|---|
| Market Cap | 128.4B | 7.7B |
| Revenue | 9.22B | 1.43B |
| EBITDA | 1.94B | -145M |
| EBIT | 1.60B | -163M |
| Net Income | 1.13B | -74M |
| EPS | 1.71 | -0.13 |
| Fiscal Year | 2025 | 2025 |
Income Statement Interpretations
Palo Alto Networks, Inc.
Palo Alto Networks showed strong revenue growth from 2021 to 2025, with a 116.67% increase, reaching $9.22B in 2025. Net income grew substantially over the period, though it declined sharply by 61.7% in 2025. Margins remained favorable, with a gross margin of 73.4% and net margin of 12.3%. The latest year saw solid revenue and EBIT growth, despite margin compression.
UiPath Inc.
UiPath’s revenue increased steadily by 135.3% over 2021–2025, reaching $1.43B in 2025. Net income improved moderately by 20.2% overall, with a favorable net margin growth of 66.1%. However, the company maintained a negative net margin of -5.15% in 2025. Gross margins were strong at 82.7%, but EBIT margin remained unfavorable at -11.4%, reflecting ongoing operational challenges.
Which one has the stronger fundamentals?
Palo Alto Networks exhibits more robust fundamentals with higher absolute revenue and net income, alongside consistently favorable margins and strong EBIT growth. UiPath, while showing solid revenue expansion and improving net income growth, continues to operate at an overall net loss and negative EBIT margin. Both show favorable income statement trends, but Palo Alto Networks’ scale and margin stability provide a clearer financial strength.
Financial Ratios Comparison
The table below presents a side-by-side comparison of the most recent key financial ratios for Palo Alto Networks, Inc. and UiPath Inc., reflecting their fiscal year 2025.
| Ratios | Palo Alto Networks, Inc. (PANW) | UiPath Inc. (PATH) |
|---|---|---|
| ROE | 14.5% | -4.0% |
| ROIC | 5.7% | -7.4% |
| P/E | 101.4 | -108.0 |
| P/B | 14.7 | 4.3 |
| Current Ratio | 0.89 | 2.93 |
| Quick Ratio | 0.89 | 2.93 |
| D/E (Debt/Equity) | 0.04 | 0.04 |
| Debt-to-Assets | 1.4% | 2.7% |
| Interest Coverage | 414.3 | 0 (not reported) |
| Asset Turnover | 0.39 | 0.50 |
| Fixed Asset Turnover | 12.6 | 14.4 |
| Payout ratio | 0% | 0% |
| Dividend yield | 0% | 0% |
Interpretation of the Ratios
Palo Alto Networks, Inc.
Palo Alto Networks displays a mix of strong and weak ratios, with favorable net margin at 12.3% and low debt levels indicating financial stability. However, a high PE ratio of 101.43 and a current ratio below 1 highlight some liquidity concerns. The company does not pay dividends, likely prioritizing reinvestment and growth over shareholder payouts.
UiPath Inc.
UiPath’s ratios reveal challenges with negative net margin (-5.15%) and return on equity (-3.99%), reflecting ongoing losses. It maintains a strong liquidity position with a current ratio of 2.93, but interest coverage is zero, signaling difficulty servicing debt. UiPath does not distribute dividends, likely focusing on reinvestment and expansion in its growth phase.
Which one has the best ratios?
Palo Alto Networks shows a slightly favorable ratio profile, balancing profitability with manageable debt, despite some valuation and liquidity concerns. UiPath’s ratios are slightly unfavorable, marked by losses and weak profitability despite better liquidity. Overall, Palo Alto Networks presents a comparatively stronger financial ratio set in 2025.
Strategic Positioning
This section compares the strategic positioning of Palo Alto Networks and UiPath, including market position, key segments, and exposure to technological disruption:
Palo Alto Networks, Inc.
- Leading cybersecurity provider with strong market cap and moderate competitive pressure.
- Focus on cybersecurity solutions: firewalls, cloud security, subscriptions, and consulting.
- Faces technological disruption from evolving cybersecurity threats and cloud adoption.
UiPath Inc.
- Specialist in robotic process automation with smaller market cap and higher beta.
- End-to-end automation platform with RPA, AI integration, licenses, and subscriptions.
- Exposed to disruption via AI advancements and automation technology evolution.
Palo Alto Networks, Inc. vs UiPath Inc. Positioning
Palo Alto Networks has a diversified offering across cybersecurity hardware, software, and services, targeting various industries. UiPath concentrates on automation software with a focus on RPA and AI, serving select sectors like banking and healthcare.
Which has the best competitive advantage?
Both companies are currently shedding value as ROIC is below WACC, but both show growing profitability trends. Neither has a clearly sustainable competitive advantage based on the moat evaluation data.
Stock Comparison
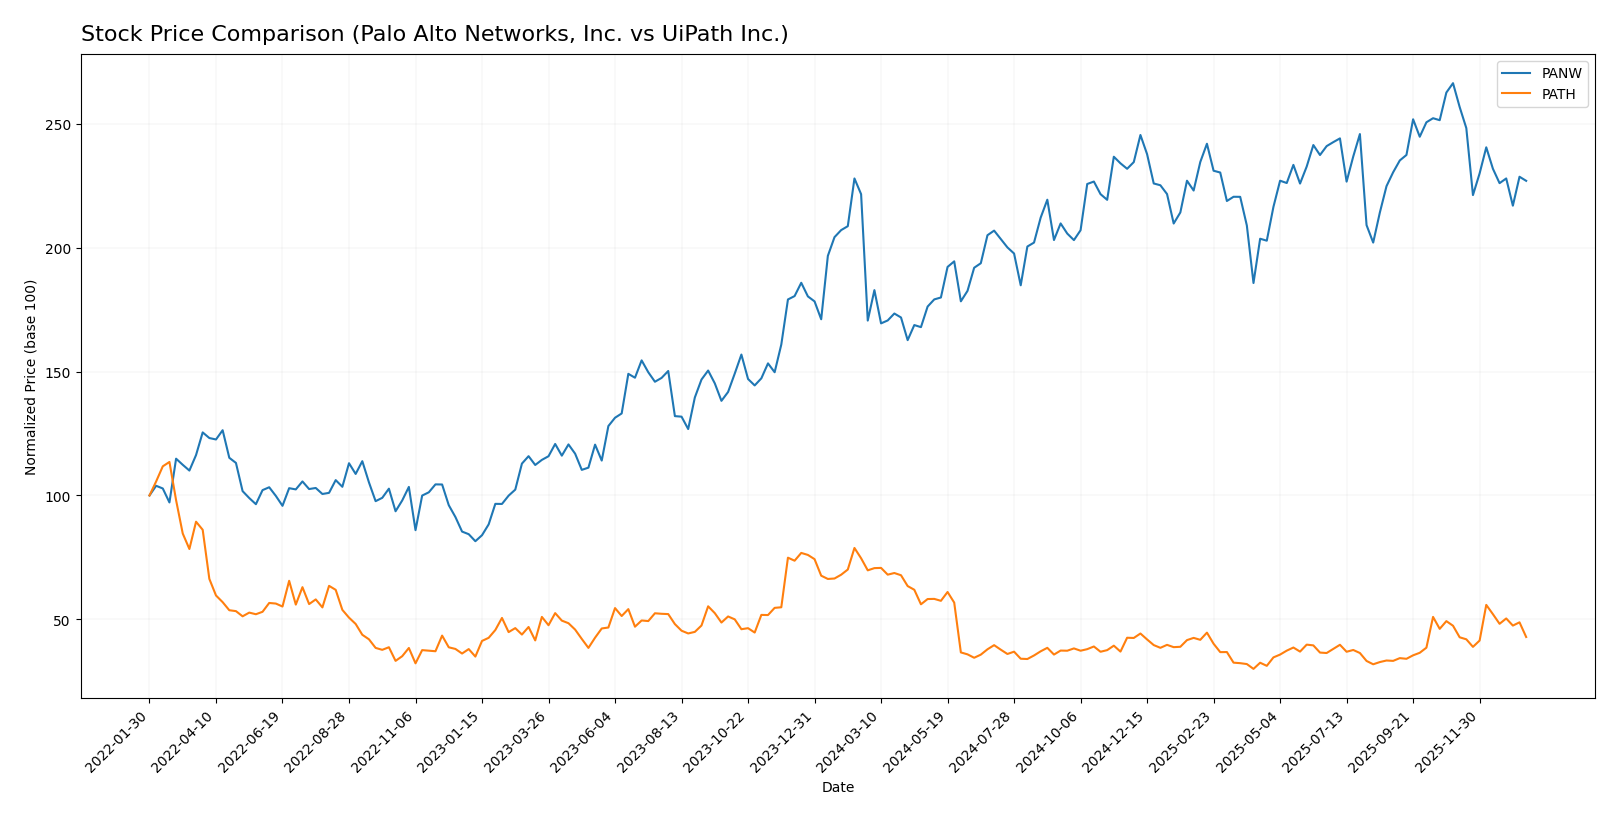
The stock price movements over the past 12 months reveal a bullish trend for Palo Alto Networks, Inc. with a 33.05% gain, while UiPath Inc. experienced a bearish trend marked by a 38.53% decline, both showing distinct trading dynamics.
Trend Analysis
Palo Alto Networks, Inc. showed a bullish trend over the past year with a 33.05% increase, though the trend is decelerating. The stock ranged between 134.51 and 220.24, with volatility at 19.95. Recent months show a -14.79% decline.
UiPath Inc. exhibited a bearish trend with a 38.53% drop over the same period and accelerating downward momentum. The price fluctuated between 10.04 and 23.66, with lower volatility at 3.33. Recent trend shows slight recovery with a 0.14 slope.
Comparing both, Palo Alto Networks delivered the highest market performance in the past year, outperforming UiPath’s substantial decline despite recent downward pressure.
Target Prices
Analysts present a clear target price consensus for both Palo Alto Networks, Inc. and UiPath Inc.
| Company | Target High | Target Low | Consensus |
|---|---|---|---|
| Palo Alto Networks, Inc. | 265 | 157 | 231.07 |
| UiPath Inc. | 19 | 14 | 16.6 |
The consensus target prices for Palo Alto Networks and UiPath suggest upside potential compared to their current prices of $187.66 and $14.34, respectively, indicating moderate to strong analyst confidence in future growth.
Analyst Opinions Comparison
This section compares analysts’ ratings and grades for Palo Alto Networks, Inc. and UiPath Inc.:
Rating Comparison
Palo Alto Networks, Inc. Rating
- Rating: B, considered very favorable by analysts.
- Discounted Cash Flow Score: 4, indicating a favorable DCF.
- ROE Score: 4, favorable return on equity performance.
- ROA Score: 3, moderate return on assets efficiency.
- Debt To Equity Score: 4, favorable financial risk profile.
- Overall Score: 3, moderate overall financial standing.
UiPath Inc. Rating
- Rating: B+, also very favorable according to analysts.
- Discounted Cash Flow Score: 3, indicating a moderate DCF.
- ROE Score: 4, favorable return on equity performance.
- ROA Score: 4, favorable return on assets efficiency.
- Debt To Equity Score: 4, favorable financial risk profile.
- Overall Score: 3, moderate overall financial standing.
Which one is the best rated?
UiPath holds a slightly better rating of B+ compared to Palo Alto Networks’ B, supported by a higher ROA score and moderate DCF score. Both share the same overall and debt-to-equity scores, indicating similar financial health levels.
Scores Comparison
This section compares the Altman Z-Score and Piotroski Score of Palo Alto Networks, Inc. (PANW) and UiPath Inc. (PATH) to provide insights into their financial health:
PANW Scores
- Altman Z-Score: 5.95, indicating a safe zone with low bankruptcy risk.
- Piotroski Score: 6, classified as average financial strength.
PATH Scores
- Altman Z-Score: 5.27, also in the safe zone, indicating low bankruptcy risk.
- Piotroski Score: 7, classified as strong financial strength.
Which company has the best scores?
Based on the provided scores, PANW and PATH both have safe zone Altman Z-Scores, indicating low bankruptcy risk, but PATH has a higher Piotroski Score (7 vs. 6), suggesting stronger financial health compared to PANW.
Grades Comparison
Here is the comparison of recent grades assigned to Palo Alto Networks, Inc. and UiPath Inc.:
Palo Alto Networks, Inc. Grades
The following table summarizes recent grades from recognized grading companies for Palo Alto Networks, Inc.:
| Grading Company | Action | New Grade | Date |
|---|---|---|---|
| UBS | maintain | Neutral | 2026-01-13 |
| Piper Sandler | maintain | Overweight | 2026-01-05 |
| Guggenheim | upgrade | Neutral | 2026-01-05 |
| Morgan Stanley | maintain | Overweight | 2025-12-18 |
| Goldman Sachs | maintain | Buy | 2025-11-21 |
| HSBC | downgrade | Reduce | 2025-11-21 |
| Needham | maintain | Buy | 2025-11-20 |
| WestPark Capital | maintain | Hold | 2025-11-20 |
| Bernstein | maintain | Outperform | 2025-11-20 |
| DA Davidson | maintain | Buy | 2025-11-20 |
Palo Alto Networks shows mostly stable or positive ratings with multiple “Buy” and “Overweight” grades and a single downgrade to “Reduce.”
UiPath Inc. Grades
The following table summarizes recent grades from recognized grading companies for UiPath Inc.:
| Grading Company | Action | New Grade | Date |
|---|---|---|---|
| Barclays | maintain | Equal Weight | 2026-01-12 |
| RBC Capital | maintain | Sector Perform | 2026-01-05 |
| RBC Capital | maintain | Sector Perform | 2025-12-10 |
| Morgan Stanley | maintain | Equal Weight | 2025-12-09 |
| DA Davidson | maintain | Neutral | 2025-12-05 |
| Canaccord Genuity | maintain | Buy | 2025-12-04 |
| Mizuho | maintain | Neutral | 2025-12-04 |
| RBC Capital | maintain | Sector Perform | 2025-12-04 |
| Wells Fargo | maintain | Equal Weight | 2025-12-04 |
| Evercore ISI Group | maintain | In Line | 2025-12-04 |
UiPath’s grades are consistently neutral or sector average, with one “Buy” rating, indicating a cautious market stance.
Which company has the best grades?
Palo Alto Networks holds generally more favorable grades, with a consensus “Buy” and several “Buy” and “Overweight” ratings, whereas UiPath’s consensus is “Hold” with mostly neutral or sector perform grades. This suggests Palo Alto Networks is viewed more positively by analysts, potentially impacting investor confidence and portfolio positioning accordingly.
Strengths and Weaknesses
Below is a comparative overview of key strengths and weaknesses for Palo Alto Networks, Inc. (PANW) and UiPath Inc. (PATH) based on the most recent financial and operational data.
| Criterion | Palo Alto Networks, Inc. (PANW) | UiPath Inc. (PATH) |
|---|---|---|
| Diversification | Strong: Revenue mix with 2.5B subscription, 1.8B product, 2.4B support (2025) | Moderate: Balanced between 801M subscription, 587M license, 71M services (2025) |
| Profitability | Positive net margin 12.3%, ROIC 5.67%, but ROIC below WACC (7.37%) | Negative net margin -5.15%, ROIC -7.41%, ROIC below WACC (8.86%) |
| Innovation | High fixed asset turnover (12.56), indicates efficient use of assets | Higher fixed asset turnover (14.41), but overall profitability weak |
| Global presence | Established global footprint with consistent revenue growth | Growing presence, but lower scale and profitability |
| Market Share | Large market share in cybersecurity, subscription revenue growing | Expanding automation market share, but profitability challenges persist |
Key takeaways: Palo Alto Networks leads in diversification and profitability with growing ROIC despite slight value erosion. UiPath shows solid innovation and service diversification but struggles with negative profitability and value destruction. Both companies exhibit improving profitability trends, suggesting potential for future value creation.
Risk Analysis
The table below compares key risk factors for Palo Alto Networks, Inc. and UiPath Inc. based on the most recent data available in 2025.
| Metric | Palo Alto Networks, Inc. (PANW) | UiPath Inc. (PATH) |
|---|---|---|
| Market Risk | Moderate (Beta 0.75) | Higher (Beta 1.08) |
| Debt level | Low (Debt-to-Equity 0.04) | Low (Debt-to-Equity 0.04) |
| Regulatory Risk | Moderate (Cybersecurity sensitive) | Moderate (Automation software regulation) |
| Operational Risk | Moderate (Complex product suite) | Moderate (Rapid growth, integration challenges) |
| Environmental Risk | Low (Technology sector exposure) | Low (Technology sector exposure) |
| Geopolitical Risk | Moderate (Global customer base) | Moderate (US, Romania, Japan exposure) |
Palo Alto Networks faces moderate market and regulatory risks typical of the cybersecurity industry, but benefits from very low debt levels and strong financial stability. UiPath shows higher market volatility and operational risks from rapid expansion, though it maintains healthy liquidity. Both companies exhibit manageable geopolitical and environmental risks. Market risk and operational challenges are the most impactful for investors to monitor closely.
Which Stock to Choose?
Palo Alto Networks, Inc. (PANW) shows a favorable income evolution with 14.87% revenue growth in 2025 and strong profitability metrics, including a 12.3% net margin. Its financial ratios are slightly favorable overall, with low debt levels and a very favorable rating of B. However, the company is shedding value as ROIC remains below WACC despite a growing ROIC trend.
UiPath Inc. (PATH) presents a favorable income statement growth overall, with 9.3% revenue growth in 2025 but negative profitability, including a -5.15% net margin. Its financial ratios appear slightly unfavorable, though it maintains low debt and a very favorable B+ rating. Similar to PANW, PATH is shedding value but shows improving profitability.
Investors focused on stability and profitability might find PANW more appealing due to its favorable income and financial ratios despite value destruction signs. Conversely, those with tolerance for risk and interest in growth could see potential in PATH, given its improving profitability and solid rating, albeit with ongoing value challenges.
Disclaimer: Investment carries a risk of loss of initial capital. The past performance is not a reliable indicator of future results. Be sure to understand risks before making an investment decision.
Go Further
I encourage you to read the complete analyses of Palo Alto Networks, Inc. and UiPath Inc. to enhance your investment decisions: