In today’s fast-evolving technology landscape, Palo Alto Networks, Inc. and Teradata Corporation stand out as key players in the software infrastructure industry. Both companies focus on innovative solutions—cybersecurity for Palo Alto Networks and multi-cloud data analytics for Teradata—serving overlapping enterprise markets. This article will carefully analyze their strategies and market positions to help you identify which stock holds the most promise for your investment portfolio.

Table of contents
Companies Overview
I will begin the comparison between Palo Alto Networks and Teradata by providing an overview of these two companies and their main differences.
Palo Alto Networks Overview
Palo Alto Networks, Inc. is a leading cybersecurity company providing firewall appliances, software, and cloud security solutions worldwide. Its mission centers on protecting enterprises, service providers, and government entities with advanced threat prevention, security analytics, and consulting services. Headquartered in Santa Clara, California, the company operates in the software infrastructure industry with a market cap of $128B and employs around 15,758 people.
Teradata Overview
Teradata Corporation offers a connected multi-cloud data platform, Teradata Vantage, to enable enterprise analytics and simplify data ecosystems. The company supports clients in various sectors, including financial services and healthcare, with data platform solutions and consulting services. Based in San Diego, California, Teradata has a market cap of $2.8B and employs approximately 5,700 people, competing in the software infrastructure industry.
Key similarities and differences
Both Palo Alto Networks and Teradata operate in the software infrastructure sector, serving enterprise clients with technology solutions that enhance data security and analytics. Palo Alto Networks focuses primarily on cybersecurity products and services, while Teradata specializes in multi-cloud data platforms and analytics consulting. Despite their shared industry and US headquarters, their business models diverge significantly in product offerings and target customer needs.
Income Statement Comparison
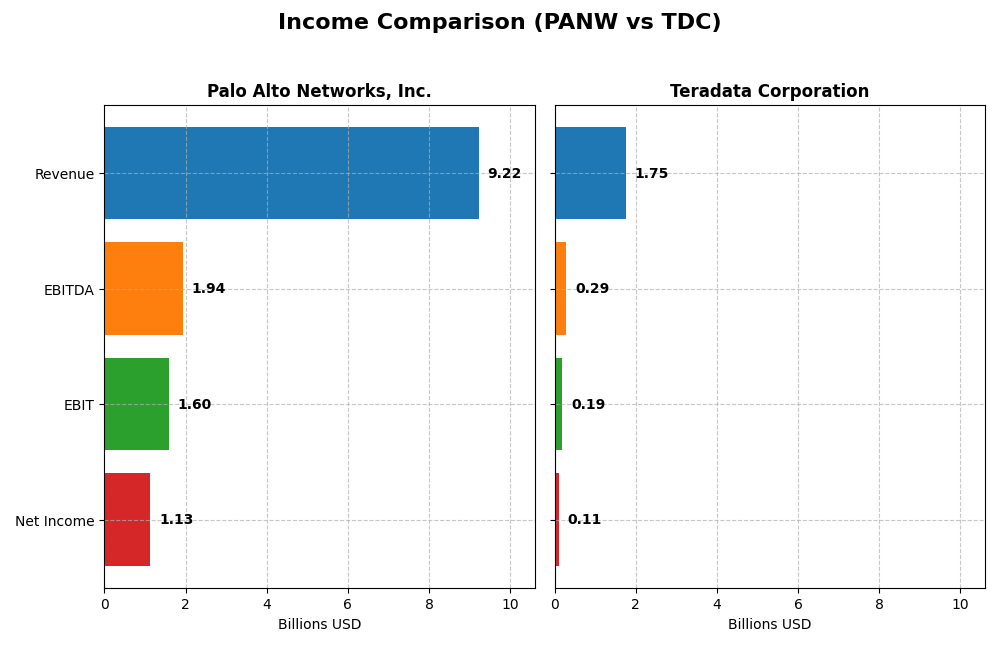
The table below presents a side-by-side comparison of key income statement metrics for Palo Alto Networks, Inc. and Teradata Corporation for their most recent fiscal years.
| Metric | Palo Alto Networks, Inc. (2025) | Teradata Corporation (2024) |
|---|---|---|
| Market Cap | 128.4B | 2.8B |
| Revenue | 9.22B | 1.75B |
| EBITDA | 1.94B | 293M |
| EBIT | 1.60B | 193M |
| Net Income | 1.13B | 114M |
| EPS | 1.71 | 1.18 |
| Fiscal Year | 2025 | 2024 |
Income Statement Interpretations
Palo Alto Networks, Inc.
From 2021 to 2025, Palo Alto Networks exhibited strong revenue growth, rising from $4.26B to $9.22B, with net income improving from a loss to $1.13B. Margins generally strengthened, with a gross margin around 73.4% and EBIT margin near 17.3% in 2025. The latest year showed favorable revenue and EBIT growth, although net margin and EPS declined.
Teradata Corporation
Teradata’s revenue declined slightly from $1.92B in 2021 to $1.75B in 2024, with net income decreasing from $147M to $114M. Margins remained positive but modest, with a 60.5% gross margin and 11.0% EBIT margin in 2024. The most recent year saw a revenue decrease but improvements in EBIT, net margin, and EPS growth, indicating operational efficiency gains.
Which one has the stronger fundamentals?
Palo Alto Networks demonstrates stronger fundamentals with significant revenue and net income growth, superior margins, and mostly favorable income statement metrics despite recent net margin pressure. Teradata shows margin stability and recent profitability improvements but faces challenges in revenue and net income declines over the period. Overall, Palo Alto Networks has a more robust growth trajectory and profitability profile.
Financial Ratios Comparison
The table below compares the most recent financial ratios for Palo Alto Networks, Inc. (PANW) and Teradata Corporation (TDC) based on their fiscal year 2025 and 2024 data respectively.
| Ratios | Palo Alto Networks, Inc. (2025) | Teradata Corporation (2024) |
|---|---|---|
| ROE | 14.49% | 85.71% |
| ROIC | 5.67% | 16.89% |
| P/E | 101.43 | 26.34 |
| P/B | 14.70 | 22.58 |
| Current Ratio | 0.89 | 0.81 |
| Quick Ratio | 0.89 | 0.79 |
| D/E (Debt to Equity) | 0.04 | 4.33 |
| Debt-to-Assets | 1.43% | 33.80% |
| Interest Coverage | 414.3 | 7.21 |
| Asset Turnover | 0.39 | 1.03 |
| Fixed Asset Turnover | 12.56 | 9.07 |
| Payout Ratio | 0% | 0% |
| Dividend Yield | 0% | 0% |
Interpretation of the Ratios
Palo Alto Networks, Inc.
Palo Alto Networks shows a mix of strong and weak ratios, with favorable metrics like net margin at 12.3% and low debt levels, but unfavorable valuation ratios such as a high PE of 101.43 and PB of 14.7. The liquidity position is weak with a current ratio below 1. The company does not pay dividends, likely prioritizing growth and reinvestment in R&D.
Teradata Corporation
Teradata displays strong profitability and efficiency ratios, including an impressive ROE of 85.71% and ROIC of 16.89%, along with solid asset turnover. However, it faces challenges with leverage as its debt-to-equity is high at 4.33, and liquidity ratios are below 1. Teradata also does not pay dividends, possibly focusing on growth and operational improvements.
Which one has the best ratios?
Both companies have 42.86% favorable ratios; however, Palo Alto Networks benefits from better leverage and interest coverage ratios, while Teradata excels in profitability and asset utilization. Palo Alto’s valuation is stretched, and Teradata’s leverage is concerning, resulting in a slightly favorable view for Palo Alto but a neutral stance overall.
Strategic Positioning
This section compares the strategic positioning of Palo Alto Networks and Teradata, including market position, key segments, and exposure to technological disruption:
Palo Alto Networks, Inc.
- Leading cybersecurity provider with strong presence in firewall and threat prevention markets; faces competitive pressure from other security firms.
- Revenue driven by subscription services, product sales, and support, targeting enterprises, service providers, and governments across multiple industries.
- Exposure to rapid cybersecurity technology changes; innovates in cloud security, automation, and threat intelligence to address disruption.
Teradata Corporation
- Focused on multi-cloud data platforms and analytics with competition from cloud and analytics service providers.
- Key business drivers include consulting services, recurring product and service revenue, and multi-cloud analytics solutions.
- Faces technological disruption through cloud migration trends; focuses on integrated migration and multi-cloud ecosystem support.
Palo Alto Networks, Inc. vs Teradata Corporation Positioning
Palo Alto Networks exhibits a diversified approach with cybersecurity products and subscriptions across many sectors, while Teradata concentrates on multi-cloud analytics and consulting. Palo Alto’s broad industry reach contrasts with Teradata’s specialized cloud data platform focus.
Which has the best competitive advantage?
Teradata demonstrates a very favorable moat with a strong ROIC above WACC and growing profitability, indicating durable competitive advantage; Palo Alto Networks shows slightly unfavorable moat status despite improving ROIC, signaling value destruction risk.
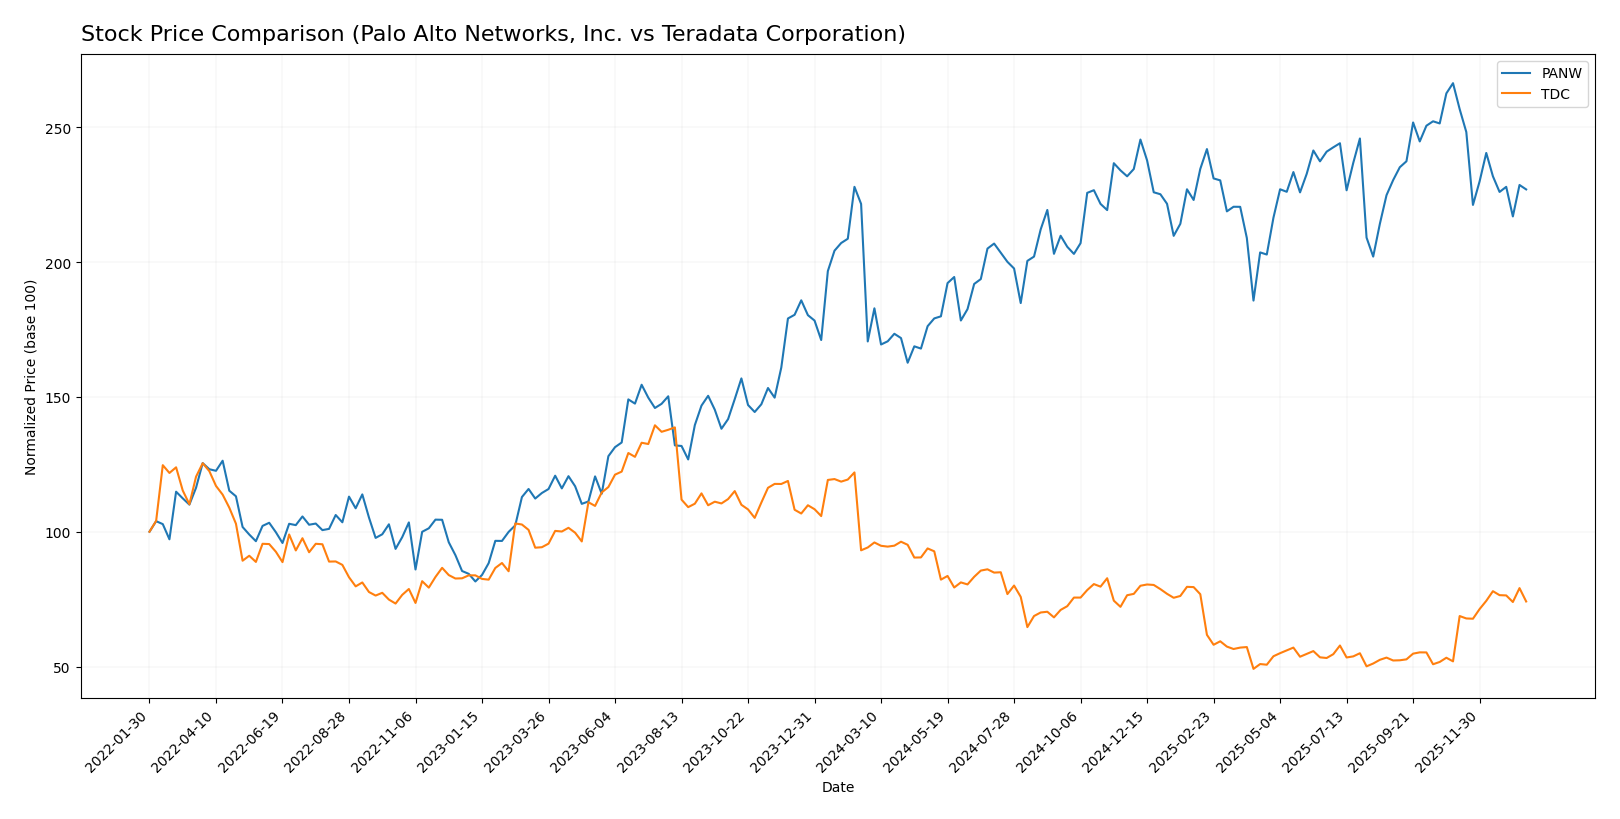
Stock Comparison
Over the past 12 months, Palo Alto Networks, Inc. experienced a strong bullish trend with a 33.05% price increase, while Teradata Corporation faced a 21.26% decline, reflecting contrasting trading dynamics and momentum shifts.
Trend Analysis
Palo Alto Networks, Inc. showed a bullish trend with a 33.05% price gain over the past year, despite recent deceleration and a 14.79% drop from November 2025 to January 2026. The stock’s volatility was relatively high, with a standard deviation of 19.95.
Teradata Corporation exhibited a bearish trend over the last 12 months, declining 21.26%, although recent months indicate an accelerating recovery with a 42.78% increase and a mild upward slope of 0.62. Its volatility remained low, with a standard deviation of 5.63.
Comparing both, Palo Alto Networks delivered the highest market performance over the full year, maintaining a strong overall gain despite recent short-term weakness, while Teradata’s longer-term losses contrast with its recent rebound.
Target Prices
Analysts present a generally optimistic consensus on the target prices for Palo Alto Networks, Inc. and Teradata Corporation.
| Company | Target High | Target Low | Consensus |
|---|---|---|---|
| Palo Alto Networks, Inc. | 265 | 157 | 231.07 |
| Teradata Corporation | 35 | 27 | 31 |
The consensus target prices for both companies exceed their current stock prices—Palo Alto Networks at $187.66 and Teradata at $29.77—indicating expected upside potential according to analyst estimates.
Analyst Opinions Comparison
This section compares analysts’ ratings and grades for Palo Alto Networks, Inc. and Teradata Corporation:
Rating Comparison
Palo Alto Networks, Inc. Rating
- Rating: B, indicating a very favorable overall assessment.
- Discounted Cash Flow Score: 4, favorable outlook on future cash flows.
- ROE Score: 4, favorable efficiency in generating profit from equity.
- ROA Score: 3, moderate effectiveness in asset utilization.
- Debt To Equity Score: 4, favorable financial risk profile.
- Overall Score: 3, moderate overall financial standing.
Teradata Corporation Rating
- Rating: B+, also reflecting a very favorable overall assessment.
- Discounted Cash Flow Score: 4, favorable outlook on future cash flows.
- ROE Score: 5, very favorable efficiency in generating profit from equity.
- ROA Score: 4, favorable effectiveness in asset utilization.
- Debt To Equity Score: 1, very unfavorable financial risk profile.
- Overall Score: 3, moderate overall financial standing.
Which one is the best rated?
Teradata holds a slightly better rating (B+) than Palo Alto Networks (B), driven by its higher ROE and ROA scores. However, Palo Alto Networks presents a stronger debt-to-equity score, indicating lower financial risk. Both have the same overall score of 3.
Scores Comparison
The comparison of Palo Alto Networks and Teradata scores provides insight into their financial health and risk levels:
Palo Alto Networks Scores
- Altman Z-Score: 5.95, indicating a safe zone with low bankruptcy risk.
- Piotroski Score: 6, reflecting average financial strength.
Teradata Scores
- Altman Z-Score: 0.81, indicating distress zone with high bankruptcy risk.
- Piotroski Score: 8, reflecting very strong financial health.
Which company has the best scores?
Palo Alto Networks shows a much stronger Altman Z-Score, signaling lower bankruptcy risk. Teradata, however, has a superior Piotroski Score, indicating stronger financial fundamentals. Each score highlights different aspects of their financial stability.
Grades Comparison
The following presents the recent grades and rating trends for Palo Alto Networks, Inc. and Teradata Corporation:
Palo Alto Networks, Inc. Grades
This table shows the latest grades and actions from various reputable grading companies for Palo Alto Networks, Inc.:
| Grading Company | Action | New Grade | Date |
|---|---|---|---|
| UBS | maintain | Neutral | 2026-01-13 |
| Piper Sandler | maintain | Overweight | 2026-01-05 |
| Guggenheim | upgrade | Neutral | 2026-01-05 |
| Morgan Stanley | maintain | Overweight | 2025-12-18 |
| Goldman Sachs | maintain | Buy | 2025-11-21 |
| HSBC | downgrade | Reduce | 2025-11-21 |
| Needham | maintain | Buy | 2025-11-20 |
| WestPark Capital | maintain | Hold | 2025-11-20 |
| Bernstein | maintain | Outperform | 2025-11-20 |
| DA Davidson | maintain | Buy | 2025-11-20 |
The overall grade trend for Palo Alto Networks is predominantly positive, with multiple buy and overweight ratings, although a single downgrade to reduce is noted.
Teradata Corporation Grades
This table summarizes the recent grades and actions from recognized grading firms for Teradata Corporation:
| Grading Company | Action | New Grade | Date |
|---|---|---|---|
| Barclays | maintain | Underweight | 2026-01-12 |
| RBC Capital | maintain | Sector Perform | 2026-01-05 |
| Morgan Stanley | maintain | Overweight | 2025-12-17 |
| Citizens | upgrade | Market Outperform | 2025-11-10 |
| Barclays | maintain | Underweight | 2025-11-05 |
| TD Cowen | maintain | Hold | 2025-11-05 |
| Evercore ISI Group | maintain | Outperform | 2025-11-05 |
| UBS | maintain | Neutral | 2025-08-06 |
| Guggenheim | maintain | Buy | 2025-05-07 |
| Barclays | maintain | Underweight | 2025-04-21 |
Teradata’s grading exhibits a mixed pattern, with several underweight and hold ratings alongside some outperform and buy grades, indicating varied analyst opinions.
Which company has the best grades?
Palo Alto Networks has received a stronger consensus rating with a majority of buy and overweight grades, suggesting more bullish analyst sentiment compared to Teradata’s mixed and more cautious outlook. For investors, this could imply differing expectations of growth and risk profiles between the two companies.
Strengths and Weaknesses
Below is a comparison table highlighting the key strengths and weaknesses of Palo Alto Networks, Inc. (PANW) and Teradata Corporation (TDC) based on their latest financial and operational data.
| Criterion | Palo Alto Networks, Inc. (PANW) | Teradata Corporation (TDC) |
|---|---|---|
| Diversification | Strong subscription-based revenue (4.97B in 2025), growing product and support segments | Balanced recurring product and service revenues (approx. 2.7B in 2024) with consulting services |
| Profitability | Moderate net margin at 12.3%, ROIC 5.67% below WACC (7.37%), slightly unfavorable moat | Lower net margin at 6.51%, but very favorable ROIC (16.89%) well above WACC (5.85%), strong moat |
| Innovation | High innovation with increasing ROIC trend but currently value destroying | Durable competitive advantage with strong ROIC growth, consistent innovation in analytics and software |
| Global presence | Significant global footprint in cybersecurity markets | Global data analytics presence with international revenues exceeding 1B |
| Market Share | Leading in cybersecurity subscriptions but facing high valuation multiples (PE 101.43) | Established player in data analytics with moderate valuation (PE 26.34) but higher debt levels |
Key takeaway: Teradata demonstrates a stronger economic moat and more efficient capital use despite lower margins, while Palo Alto Networks shows promising growth and innovation but currently struggles with value creation and high valuation risks.
Risk Analysis
Below is a comparative table summarizing key risks faced by Palo Alto Networks, Inc. (PANW) and Teradata Corporation (TDC) as of the most recent fiscal years:
| Metric | Palo Alto Networks, Inc. (PANW) | Teradata Corporation (TDC) |
|---|---|---|
| Market Risk | Moderate (beta 0.75) | Lower (beta 0.57) |
| Debt level | Very low (D/E 0.04, favorable) | High (D/E 4.33, unfavorable) |
| Regulatory Risk | Moderate (cybersecurity industry compliance) | Moderate (data privacy regulations) |
| Operational Risk | Moderate (complex cloud security services) | Moderate (multi-cloud platform integration) |
| Environmental Risk | Low (technology sector, no major exposure) | Low (technology sector) |
| Geopolitical Risk | Moderate (global cybersecurity tensions) | Moderate (global data operations) |
The most impactful risks are Teradata’s high debt level, which increases financial vulnerability despite strong operational scores, and Palo Alto Networks’ exposure to regulatory and geopolitical risks due to its cybersecurity focus. Both companies show moderate operational risks given their complex technology services. Investors should monitor debt management closely for Teradata and regulatory developments for Palo Alto Networks.
Which Stock to Choose?
Palo Alto Networks, Inc. (PANW) has shown strong income growth with a 116.67% revenue increase over five years and a 327.28% net income rise. Its profitability is favorable with a 12.3% net margin, though recent net margin and EPS growth declined. Financial ratios are slightly favorable overall, with low debt and high interest coverage, but valuation multiples appear stretched. The company’s economic moat is slightly unfavorable due to ROIC below WACC despite growing profitability, and it holds a very favorable B rating.
Teradata Corporation (TDC) presents mixed income trends, with a recent 4.53% revenue decline and an 11.63% net income drop over five years, but improving profit margins and EPS growth in the latest year. Its financial ratios are neutral overall, supported by strong returns on equity and capital employed, but burdened by high debt levels and moderate valuation multiples. TDC’s economic moat is very favorable with ROIC well above WACC and a growing trend, complemented by a very favorable B+ rating.
Investors with a focus on growth and income statement strength might find Palo Alto Networks’ expanding revenues and profitability appealing despite valuation concerns and a slightly unfavorable moat. Conversely, those prioritizing durable competitive advantages and strong capital returns could interpret Teradata’s very favorable moat and improving earnings as positive, despite recent top-line pressures and higher leverage. The choice may thus depend on the investor’s risk tolerance and strategic preferences.
Disclaimer: Investment carries a risk of loss of initial capital. The past performance is not a reliable indicator of future results. Be sure to understand risks before making an investment decision.
Go Further
I encourage you to read the complete analyses of Palo Alto Networks, Inc. and Teradata Corporation to enhance your investment decisions: