In the fast-evolving technology sector, Palo Alto Networks, Inc. (PANW) and Synopsys, Inc. (SNPS) stand out as leaders in software infrastructure. Both companies drive innovation—Palo Alto Networks focuses on cybersecurity solutions, while Synopsys excels in electronic design automation. Their shared emphasis on advanced software and market presence makes this comparison relevant. Join me as I analyze which company offers the most compelling investment opportunity in 2026.

Table of contents
Companies Overview
I will begin the comparison between Palo Alto Networks and Synopsys by providing an overview of these two companies and their main differences.
Palo Alto Networks Overview
Palo Alto Networks, Inc. is a cybersecurity company focused on providing firewall appliances, software, and comprehensive security subscription services worldwide. Its solutions include cloud security, threat intelligence, and professional consulting, targeting medium to large enterprises and government entities across various sectors. Founded in 2005 and headquartered in Santa Clara, California, it is a prominent player in the software infrastructure industry.
Synopsys Overview
Synopsys, Inc. specializes in electronic design automation software used for designing and testing integrated circuits. It offers platforms for digital design, verification, FPGA prototyping, and extensive intellectual property solutions for various applications. Established in 1986 and based in Mountain View, California, Synopsys serves industries such as electronics, automotive, and medicine, positioning itself as a leader in software infrastructure for chip design.
Key similarities and differences
Both Palo Alto Networks and Synopsys operate in the software infrastructure sector and serve a diverse range of industries with technology-focused solutions. Palo Alto Networks emphasizes cybersecurity and cloud security services, while Synopsys concentrates on design automation and IP for integrated circuits. Their business models differ in product focus: cybersecurity protection versus electronic design tools, although both provide professional services and target global markets.
Income Statement Comparison
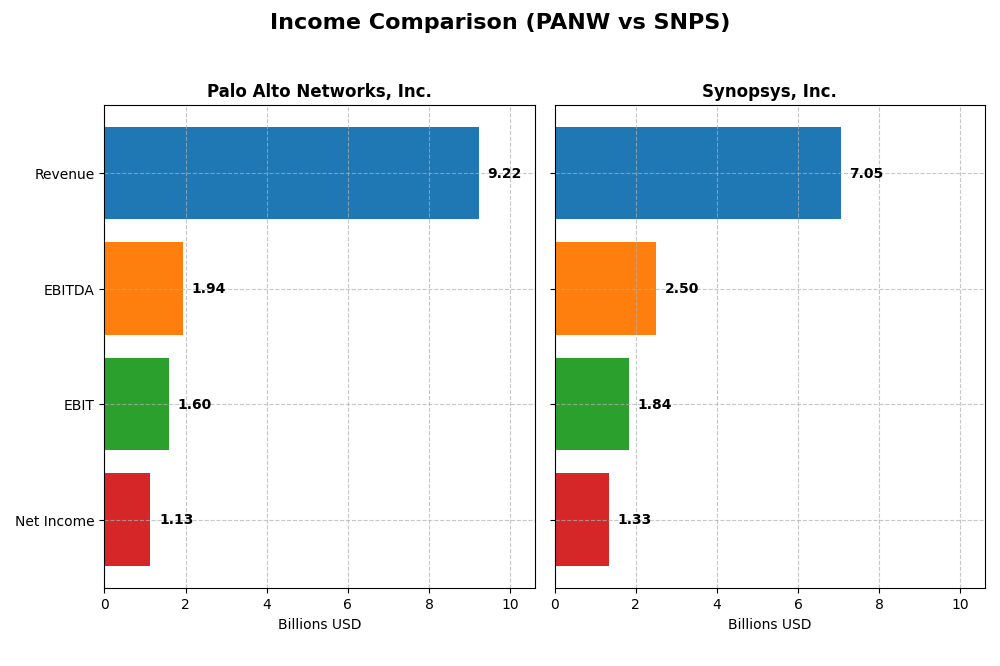
The table below presents a side-by-side comparison of key income statement metrics for Palo Alto Networks, Inc. and Synopsys, Inc. for the fiscal year 2025.
| Metric | Palo Alto Networks, Inc. | Synopsys, Inc. |
|---|---|---|
| Market Cap | 128.4B | 98.8B |
| Revenue | 9.22B | 7.05B |
| EBITDA | 1.94B | 2.50B |
| EBIT | 1.60B | 1.84B |
| Net Income | 1.13B | 1.33B |
| EPS | 1.71 | 8.13 |
| Fiscal Year | 2025 | 2025 |
Income Statement Interpretations
Palo Alto Networks, Inc.
Palo Alto Networks showed strong revenue growth from 4.3B in 2021 to 9.2B in 2025, with net income rising significantly from a loss of 0.5B in 2021 to 1.1B in 2025. Margins improved overall, with a gross margin above 73% and an EBIT margin around 17%. However, net margin and EPS declined sharply in the latest year despite revenue growth, signaling some recent profitability pressure.
Synopsys, Inc.
Synopsys’ revenue increased steadily from 4.2B in 2021 to 7.1B in 2025, alongside net income growth from 0.76B to 1.33B. Margins remain robust, with a gross margin near 77% and EBIT margin over 26%. The latest year showed solid revenue and EBIT growth, though net margin and EPS declined moderately, reflecting some margin compression and higher operating expenses.
Which one has the stronger fundamentals?
Palo Alto Networks exhibits higher overall growth rates and strong margin improvements over five years, but recent net margin and EPS declines raise caution. Synopsys shows consistent profitability with better EBIT margins and steadier net income growth, despite slightly weaker long-term growth. Both companies have favorable income statements, but Palo Alto’s recent margin volatility contrasts with Synopsys’ steadier fundamentals.
Financial Ratios Comparison
The table below compares key financial ratios for Palo Alto Networks, Inc. and Synopsys, Inc. based on their most recent fiscal year data, providing insight into profitability, liquidity, leverage, and valuation metrics.
| Ratios | Palo Alto Networks, Inc. (2025) | Synopsys, Inc. (2025) |
|---|---|---|
| ROE | 14.5% | 4.7% |
| ROIC | 5.7% | 2.0% |
| P/E | 101.4 | 54.4 |
| P/B | 14.7 | 2.6 |
| Current Ratio | 0.89 | 1.62 |
| Quick Ratio | 0.89 | 1.52 |
| D/E (Debt-to-Equity) | 0.04 | 0.50 |
| Debt-to-Assets | 1.4% | 29.6% |
| Interest Coverage | 414.3 | 2.05 |
| Asset Turnover | 0.39 | 0.15 |
| Fixed Asset Turnover | 12.6 | 5.0 |
| Payout Ratio | 0% | 0% |
| Dividend Yield | 0% | 0% |
Interpretation of the Ratios
Palo Alto Networks, Inc.
Palo Alto Networks shows mixed financial strength with favorable net margin at 12.3% and strong interest coverage of 532.53, indicating solid profitability and low risk on debt. However, its high PE ratio of 101.43 and price-to-book of 14.7 suggest overvaluation concerns. A low current ratio of 0.89 signals liquidity pressure. The company does not pay dividends, likely reinvesting in growth and R&D.
Synopsys, Inc.
Synopsys presents a favorable net margin of 18.96% but weaker returns on equity (4.72%) and invested capital (1.97%). Its liquidity is strong, with current and quick ratios above 1.5. The PE ratio at 54.36 is elevated, though price-to-book at 2.57 is moderate. Interest coverage is neutral at 4.12. Synopsys also does not distribute dividends, probably focusing on reinvestment and innovation.
Which one has the best ratios?
Palo Alto Networks has a slightly favorable overall ratio profile with better profitability and debt metrics, while Synopsys holds a neutral stance with stronger liquidity but weaker returns. Both face valuation concerns and do not pay dividends, reflecting reinvestment priorities. The choice depends on weighing profitability versus liquidity and valuation risks.
Strategic Positioning
This section compares the strategic positioning of Palo Alto Networks and Synopsys, focusing on market position, key segments, and exposure to technological disruption:
Palo Alto Networks, Inc.
- Leading cybersecurity firm with strong market cap and moderate competitive pressure.
- Revenue driven by subscriptions, support, and product sales centered on cybersecurity solutions.
- Faces disruption from evolving cybersecurity threats but leverages cloud and AI security innovations.
Synopsys, Inc.
- Major player in electronic design automation with significant market cap and competitive industry.
- Revenue concentrated in license, maintenance, technology services, and IP products for chip design.
- Exposed to rapid tech shifts in semiconductor design and verification tools requiring continual innovation.
Palo Alto Networks vs Synopsys Positioning
Palo Alto Networks pursues a diversified cybersecurity portfolio with subscriptions and support, while Synopsys focuses on specialized semiconductor design software and IP licensing. Palo Alto’s broad customer base contrasts with Synopsys’s niche industry focus, reflecting differing strategic scopes.
Which has the best competitive advantage?
Both companies are shedding value relative to their cost of capital; however, Palo Alto Networks shows growing profitability trends, whereas Synopsys experiences declining returns, indicating a relatively stronger competitive advantage for Palo Alto Networks based on MOAT evaluation.
Stock Comparison
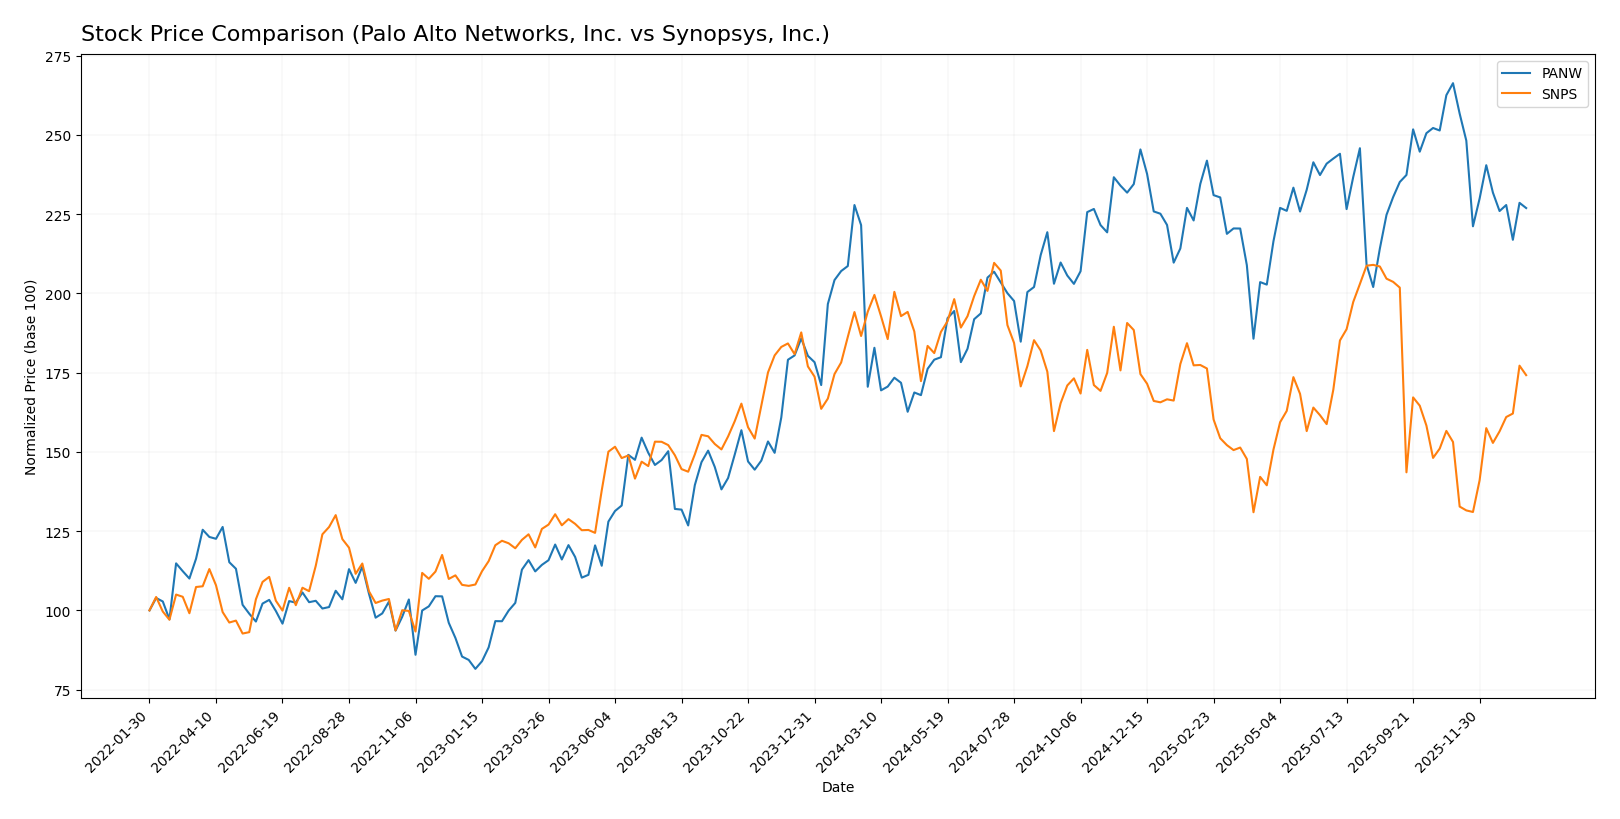
Over the past year, Palo Alto Networks, Inc. (PANW) showed a strong bullish trend with a 33.05% price increase, while Synopsys, Inc. (SNPS) experienced a 10.31% decline, indicating contrasting trading dynamics.
Trend Analysis
Palo Alto Networks, Inc. recorded a 33.05% price rise over the past 12 months, reflecting a bullish trend with deceleration and a price range between 134.51 and 220.24. Recent months show a -14.79% dip and increased volatility.
Synopsys, Inc. posted a -10.31% price change over the past year, marking a bearish trend despite acceleration and high volatility. Its recent trend reversed with a 13.77% gain since November 2025.
Comparing both, PANW delivered the highest market performance over the last year, contrasting with SNPS’s overall bearish trend despite short-term recovery.
Target Prices
The consensus target prices for Palo Alto Networks, Inc. and Synopsys, Inc. suggest positive upside potential from current levels.
| Company | Target High | Target Low | Consensus |
|---|---|---|---|
| Palo Alto Networks, Inc. | 265 | 157 | 231.07 |
| Synopsys, Inc. | 600 | 425 | 530 |
Analysts expect Palo Alto Networks’ price to rise from $187.66 to near $231 on average, while Synopsys shows a strong consensus target significantly above its $516.31 market price.
Analyst Opinions Comparison
This section compares analysts’ ratings and grades for Palo Alto Networks, Inc. and Synopsys, Inc.:
Rating Comparison
Palo Alto Networks Rating
- Rating: B, considered very favorable overall.
- Discounted Cash Flow Score: 4, favorable valuation metric.
- ROE Score: 4, strong profitability from equity.
- ROA Score: 3, moderate asset utilization.
- Debt To Equity Score: 4, favorable financial leverage.
- Overall Score: 3, moderate financial standing.
Synopsys Rating
- Rating: B-, also very favorable overall.
- Discounted Cash Flow Score: 3, moderate valuation.
- ROE Score: 3, moderate profitability from equity.
- ROA Score: 3, moderate asset utilization.
- Debt To Equity Score: 2, moderate financial risk.
- Overall Score: 3, moderate financial standing.
Which one is the best rated?
Palo Alto Networks holds a slightly stronger rating with better scores in discounted cash flow, return on equity, and debt to equity compared to Synopsys. Both have the same overall score of 3, indicating moderate financial standing.
Scores Comparison
Here is the comparison of the Altman Z-Score and Piotroski Score for both companies:
Palo Alto Networks, Inc. Scores
- Altman Z-Score: 5.95, indicating a safe zone with low bankruptcy risk.
- Piotroski Score: 6, classified as average financial strength.
Synopsys, Inc. Scores
- Altman Z-Score: 3.54, indicating a safe zone with low bankruptcy risk.
- Piotroski Score: 4, classified as average financial strength.
Which company has the best scores?
Palo Alto Networks shows a higher Altman Z-Score (5.95) compared to Synopsys (3.54), both in the safe zone. Its Piotroski Score (6) is also higher than Synopsys’s (4), indicating relatively stronger financial metrics in this comparison.
Grades Comparison
Here is a comparison of the most recent reliable grades assigned to Palo Alto Networks, Inc. and Synopsys, Inc.:
Palo Alto Networks, Inc. Grades
The following table summarizes recent analyst grades for Palo Alto Networks, Inc.:
| Grading Company | Action | New Grade | Date |
|---|---|---|---|
| UBS | Maintain | Neutral | 2026-01-13 |
| Piper Sandler | Maintain | Overweight | 2026-01-05 |
| Guggenheim | Upgrade | Neutral | 2026-01-05 |
| Morgan Stanley | Maintain | Overweight | 2025-12-18 |
| Goldman Sachs | Maintain | Buy | 2025-11-21 |
| HSBC | Downgrade | Reduce | 2025-11-21 |
| Needham | Maintain | Buy | 2025-11-20 |
| WestPark Capital | Maintain | Hold | 2025-11-20 |
| Bernstein | Maintain | Outperform | 2025-11-20 |
| DA Davidson | Maintain | Buy | 2025-11-20 |
Palo Alto Networks shows a mixed but generally positive trend with several “Buy” and “Overweight” ratings and only one downgrade to “Reduce.”
Synopsys, Inc. Grades
The following table summarizes recent analyst grades for Synopsys, Inc.:
| Grading Company | Action | New Grade | Date |
|---|---|---|---|
| Piper Sandler | Downgrade | Neutral | 2026-01-13 |
| Morgan Stanley | Maintain | Overweight | 2025-12-12 |
| Rosenblatt | Maintain | Buy | 2025-12-11 |
| Keybanc | Maintain | Overweight | 2025-12-11 |
| Piper Sandler | Maintain | Overweight | 2025-12-11 |
| Needham | Maintain | Buy | 2025-12-11 |
| B of A Securities | Upgrade | Buy | 2025-12-11 |
| JP Morgan | Maintain | Overweight | 2025-12-11 |
| Wells Fargo | Maintain | Equal Weight | 2025-12-11 |
| Rosenblatt | Upgrade | Buy | 2025-12-09 |
Synopsys maintains a solid set of “Buy” and “Overweight” ratings with a recent downgrade to “Neutral” by Piper Sandler.
Which company has the best grades?
Both Palo Alto Networks and Synopsys have strong buy-side support, but Palo Alto Networks has a larger number of “Buy” and “Overweight” ratings with only one downgrade to “Reduce.” Synopsys also shows mainly positive ratings but includes a recent downgrade to “Neutral.” Investors might consider these differing trends when assessing growth and risk profiles.
Strengths and Weaknesses
Below is a comparison of key strengths and weaknesses for Palo Alto Networks, Inc. (PANW) and Synopsys, Inc. (SNPS) based on the most recent financial and operational data.
| Criterion | Palo Alto Networks, Inc. (PANW) | Synopsys, Inc. (SNPS) |
|---|---|---|
| Diversification | Strong subscription-based revenue (4.97B in 2025), growing product and support segments | Diverse revenue streams including license, maintenance, and technology services (3.49B License & Maintenance in 2025) |
| Profitability | Moderate net margin (12.3%), ROIC at 5.67% but below WACC, value slightly unfavorable | Higher net margin (18.96%) but ROIC (1.97%) below WACC, value very unfavorable with declining profitability |
| Innovation | Rapid ROIC growth (+224%), signaling improving efficiency despite current value destruction | Declining ROIC (-82%), indicating challenges in sustaining profitability and innovation returns |
| Global presence | Solid global footprint with increasing revenues across product lines | Established global presence with diverse offerings but profitability pressures evident |
| Market Share | High market valuation with premium multiples (PE 101.4, PB 14.7) reflecting growth expectations | Moderate valuation (PE 54.4, PB 2.57), but financial ratios indicate mixed operational efficiency |
In summary, Palo Alto Networks shows promising growth in profitability and innovation metrics despite currently shedding value, while Synopsys is facing declining profitability and a less favorable value creation profile. Investors should weigh Palo Alto’s growth potential against its high valuation and Synopsys’s operational challenges with steadier diversification.
Risk Analysis
Below is a risk comparison table for Palo Alto Networks, Inc. (PANW) and Synopsys, Inc. (SNPS) based on the most recent 2025 data:
| Metric | Palo Alto Networks, Inc. (PANW) | Synopsys, Inc. (SNPS) |
|---|---|---|
| Market Risk | Beta 0.75 (lower volatility) | Beta 1.12 (higher volatility) |
| Debt level | Very low debt/equity 0.04 (favorable) | Moderate debt/equity 0.5 (neutral) |
| Regulatory Risk | Moderate (cybersecurity sector subject to evolving regulations) | Moderate (IP and software regulations) |
| Operational Risk | Low (strong operational metrics, high interest coverage) | Moderate (lower asset turnover) |
| Environmental Risk | Low (technology sector, minimal direct impact) | Low (technology sector, minimal direct impact) |
| Geopolitical Risk | Moderate (global cybersecurity demands and government contracts) | Moderate (global supply chain and trade policies) |
Palo Alto Networks shows lower financial risk with very low leverage and strong liquidity but faces pressure from high valuation multiples and competitive regulatory landscapes. Synopsys carries moderate leverage and operational risks with higher market volatility; both companies are exposed to geopolitical uncertainties affecting global tech sectors. The most impactful risks remain market volatility for SNPS and the high valuation premium for PANW.
Which Stock to Choose?
Palo Alto Networks, Inc. (PANW) shows a favorable income evolution with a 14.87% revenue growth in 2025 and strong profitability metrics, including a 12.3% net margin. Its financial ratios are slightly favorable overall, with low debt and high interest coverage, though some valuation multiples and liquidity ratios are unfavorable. The company has a very favorable rating (B) and demonstrates a growing ROIC trend despite currently destroying value.
Synopsys, Inc. (SNPS) also reports favorable income growth with a 15.12% revenue increase in 2025 and a higher net margin of 18.89%. Its financial ratios are neutral overall, featuring solid liquidity and moderate debt levels but weaker returns on equity and invested capital. The rating is similarly very favorable (B-), though its ROIC trend is declining and indicates value destruction.
Investors focused on improving profitability and growth might see PANW’s growing ROIC and strong income growth as positive signals, while those prioritizing liquidity and stable margins could find SNPS’s higher net margin and current financial stability more appealing. Overall, the choice may depend on whether one values PANW’s improving profitability amid value destruction or SNPS’s steadier income metrics with declining capital efficiency.
Disclaimer: Investment carries a risk of loss of initial capital. The past performance is not a reliable indicator of future results. Be sure to understand risks before making an investment decision.
Go Further
I encourage you to read the complete analyses of Palo Alto Networks, Inc. and Synopsys, Inc. to enhance your investment decisions: