Home > Comparison > Technology > PLTR vs ZS
The strategic rivalry between Palantir Technologies Inc. and Zscaler, Inc. shapes the evolution of technology infrastructure software. Palantir operates as a data analytics powerhouse focused on intelligence and operational software, while Zscaler leads in cloud security solutions worldwide. This face-off highlights a contrast between data integration and secure access innovation. This analysis will assess which company offers a stronger risk-adjusted return for a diversified portfolio in today’s dynamic tech sector.
Table of contents
Companies Overview
Palantir Technologies and Zscaler, two leaders in software infrastructure, shape critical sectors of technology-driven security and data management.
Palantir Technologies Inc.: Data Integration Powerhouse
Palantir Technologies dominates as a software platform provider specializing in intelligence and operational data integration. Its core revenue comes from Palantir Gotham and Foundry, which unify data for government and commercial users. In 2026, Palantir focuses on expanding its AI-driven analytics and flexible deployment capabilities across industries, emphasizing secure, actionable insights.
Zscaler, Inc.: Cloud Security Innovator
Zscaler leads in cloud security solutions, safeguarding access to SaaS and private applications worldwide. It generates revenue mainly through its Zscaler Internet Access and Private Access products. The company’s 2026 strategy centers on enhancing workload segmentation and digital experience analytics to combat evolving cyber threats and support hybrid cloud infrastructures.
Strategic Collision: Similarities & Divergences
Both companies excel in software infrastructure but diverge in their business models. Palantir builds a data-centric, AI-powered ecosystem geared toward intelligence and operational use. Zscaler operates an open cloud security platform focusing on secure application access and threat mitigation. Their primary battleground is enterprise cybersecurity and data utilization. Palantir offers a high-tech data analytics moat, while Zscaler presents a scalable cloud security fortress with distinct risk profiles.
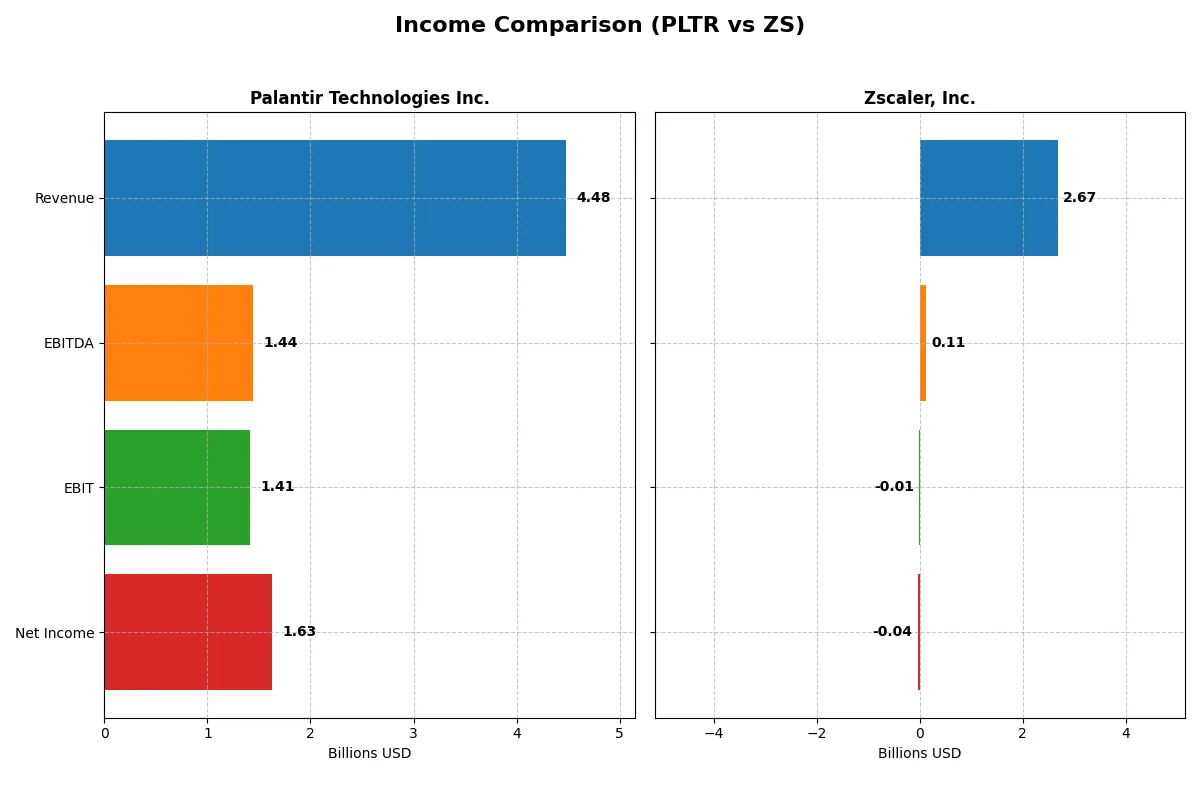
Income Statement Comparison
This data dissects the core profitability and scalability of both corporate engines to reveal who dominates the bottom line:
| Metric | Palantir Technologies Inc. (PLTR) | Zscaler, Inc. (ZS) |
|---|---|---|
| Revenue | 4.48B | 2.67B |
| Cost of Revenue | 789M | 618M |
| Operating Expenses | 2.27B | 2.18B |
| Gross Profit | 3.69B | 2.05B |
| EBITDA | 1.44B | 112M |
| EBIT | 1.41B | -8.77M |
| Interest Expense | 0 | 9.52M |
| Net Income | 1.63B | -41.5M |
| EPS | 0.69 | -0.27 |
| Fiscal Year | 2025 | 2025 |
Income Statement Analysis: The Bottom-Line Duel
The following income statement comparison reveals the true efficiency and profitability of Palantir Technologies Inc. and Zscaler, Inc. over recent years.
Palantir Technologies Inc. Analysis
Palantir shows robust revenue growth, surging from 1.54B in 2021 to 4.48B in 2025. Net income improved dramatically, turning from a 520M loss in 2021 to a 1.63B profit in 2025. Its gross margin holds strong at 82.4%, with net margin climbing to 36.3%, reflecting exceptional operational efficiency and accelerating momentum in 2025.
Zscaler, Inc. Analysis
Zscaler expands revenue steadily, from 673M in 2021 to 2.67B in 2025, a nearly fourfold increase. However, net income remains negative, with a 41M loss in 2025, despite improving margins. Its gross margin is healthy at 76.9%, but net margin is negative at -1.55%. The company shows improving EBIT and net margin trends, though profitability remains elusive.
Margin Supremacy vs. Growth Momentum
Palantir delivers superior profitability with strong positive net margins and exponential earnings growth, outperforming Zscaler’s revenue growth but ongoing losses. For investors prioritizing earnings and margins, Palantir’s efficient capital allocation and margin expansion present a clearer fundamental winner. Zscaler suits those focused on top-line growth with patience for profitability challenges.
Financial Ratios Comparison
These vital ratios act as a diagnostic tool to expose the underlying fiscal health, valuation premiums, and capital efficiency of the companies compared below:
| Ratios | Palantir Technologies Inc. (PLTR) | Zscaler, Inc. (ZS) |
|---|---|---|
| ROE | 22.0% | -2.3% |
| ROIC | 17.9% | -3.2% |
| P/E | 259.2x | -1063.0x |
| P/B | 57.0x | 24.5x |
| Current Ratio | 7.1 | 2.0 |
| Quick Ratio | 7.1 | 2.0 |
| D/E | 0.03 | 1.00 |
| Debt-to-Assets | 2.6% | 28.0% |
| Interest Coverage | 0 (no coverage or not reported) | -13.5 (negative coverage) |
| Asset Turnover | 0.50 | 0.42 |
| Fixed Asset Turnover | 17.8 | 4.2 |
| Payout ratio | 0% | 0% |
| Dividend yield | 0% | 0% |
| Fiscal Year | 2025 | 2025 |
Efficiency & Valuation Duel: The Vital Signs
Financial ratios act as the company’s DNA, exposing hidden risks and operational excellence that shape investor decisions.
Palantir Technologies Inc.
Palantir posts a robust 22% ROE and a strong 36.3% net margin, signaling high profitability and efficient capital use. However, its valuation is stretched, with a P/E of 259 and a P/B of 57, indicating expensive stock pricing. Palantir reinvests heavily in R&D, foregoing dividends to fuel growth.
Zscaler, Inc.
Zscaler suffers negative returns: ROE at -2.31% and net margin at -1.55%, reflecting operational challenges. The stock trades at a negative P/E, which can distort valuation comparisons, and a P/B of 24.5, suggesting moderate market skepticism. Zscaler focuses on growth via R&D, with no dividend payout.
Premium Valuation vs. Operational Safety
Palantir offers high profitability but at a steep valuation, increasing risk for price corrections. Zscaler’s weaker returns and unfavorable ratios weigh on its financial safety. Palantir fits investors seeking growth with operational strength; Zscaler suits those tolerating risk for potential turnaround rewards.
Which one offers the Superior Shareholder Reward?
Palantir Technologies Inc. (PLTR) and Zscaler, Inc. (ZS) both refrain from paying dividends, focusing instead on reinvestment and share buybacks. PLTR shows zero dividend payout but boasts a robust free cash flow per share of $0.89 and a high operating cash flow coverage ratio above 9x, indicating strong cash generation. Its buyback intensity is moderate but sustainable given a low debt-to-equity ratio of 0.03. ZS also pays no dividends, with free cash flow per share at $4.71, but suffers from higher leverage (debt-to-equity near 1.0) and weaker operating cash flow coverage around 0.54x. ZS’s buybacks appear less sustainable given its elevated debt and negative net margins. Historically in tech, sustainable buybacks coupled with strong free cash flow and low leverage underpin superior long-term returns. I conclude PLTR offers a more attractive total return profile in 2026 due to its disciplined capital allocation and healthier financial footing.
Comparative Score Analysis: The Strategic Profile
The radar chart reveals the fundamental DNA and strategic trade-offs of Palantir Technologies Inc. and Zscaler, Inc.:
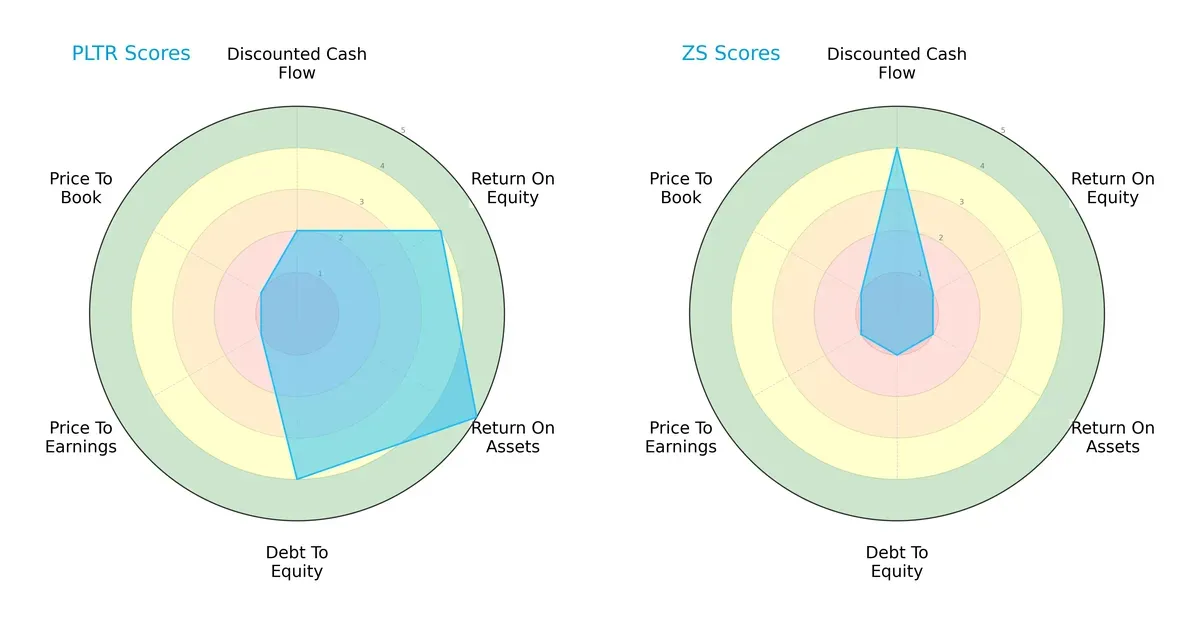
Palantir exhibits a more balanced profile, with favorable ROE (4) and very favorable ROA (5) scores, indicating efficient profit generation and asset use. Its debt-to-equity score (4) shows prudent leverage management. Conversely, Zscaler leans heavily on a strong DCF score (4) but lags in profitability and financial stability metrics, reflected in poor ROE (1), ROA (1), and debt-to-equity (1) scores. Palantir’s valuation scores (PE and PB at 1) are weak, signaling possible overvaluation, a risk absent in Zscaler’s profile but offset by its operational weaknesses.
—
Bankruptcy Risk: Solvency Showdown
The Altman Z-Score gap highlights Palantir’s superior financial resilience and long-term survival prospects versus Zscaler:
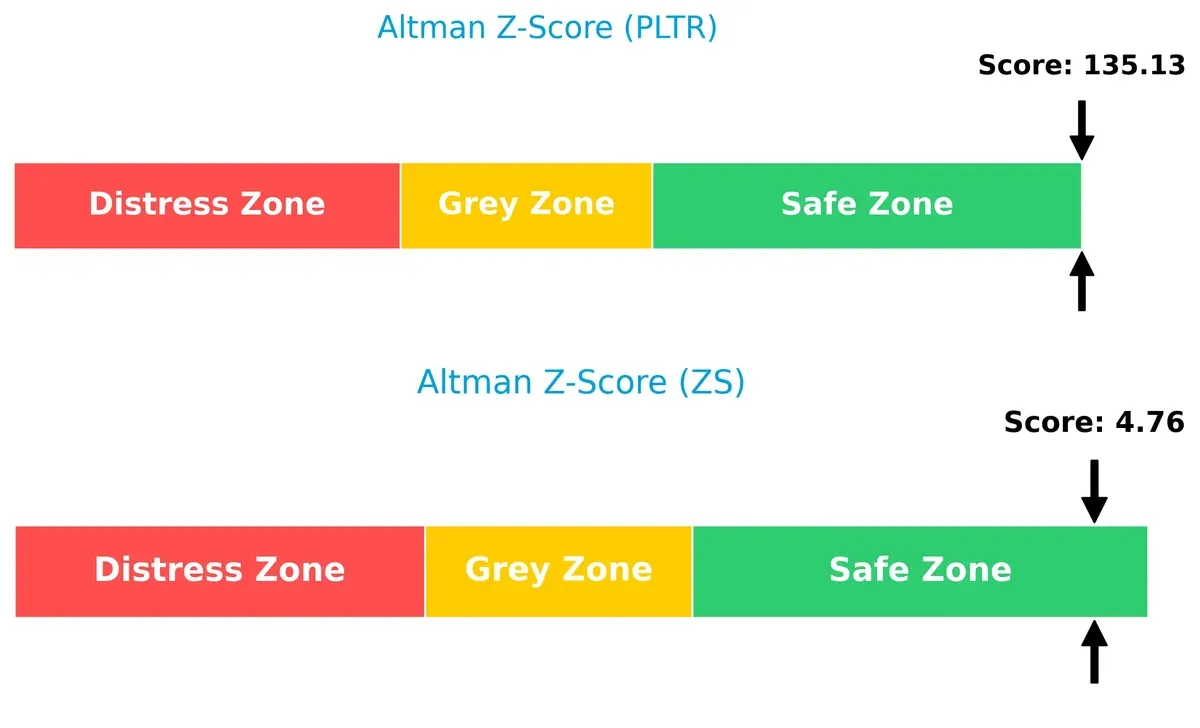
Palantir scores an extraordinary 135.1, far above the safe zone threshold, signaling negligible bankruptcy risk. Zscaler’s 4.76, while safely above distress levels, indicates a more conventional safety margin. Historically, firms with such divergent Z-scores reveal Palantir’s robust capital structure and operational stability, crucial in volatile market cycles.
—
Financial Health: Quality of Operations
Palantir’s Piotroski F-Score outperforms Zscaler’s, signaling stronger operational health and fewer red flags:
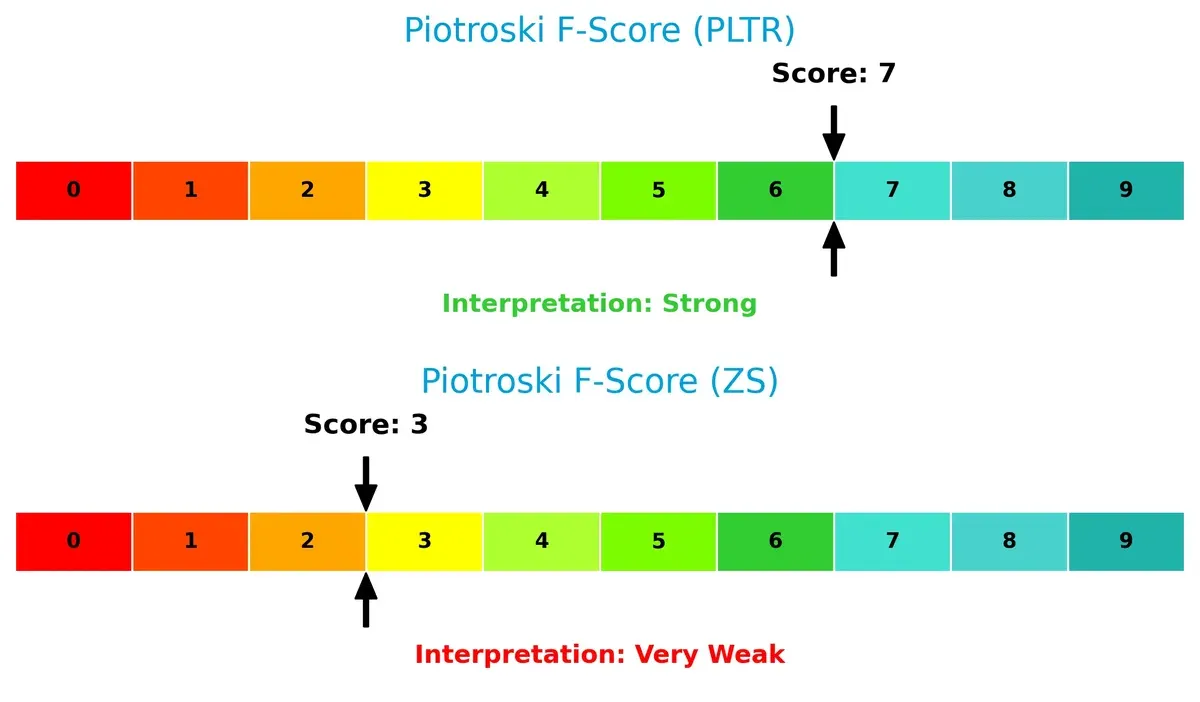
Palantir’s score of 7 indicates strong financial health with efficient profitability, liquidity, and leverage management. Zscaler’s 3 is weak, suggesting internal operational challenges and potential financial distress. Investors should view Zscaler’s low score as a caution, especially amid tightening credit conditions and sector pressures.
How are the two companies positioned?
This section dissects Palantir and Zscaler’s operational DNA by comparing their revenue distribution and internal dynamics. The goal is to confront their economic moats and identify which model offers the most resilient competitive advantage today.
Revenue Segmentation: The Strategic Mix
The following comparison dissects how Palantir and Zscaler diversify their income streams and reveals their primary sector bets:
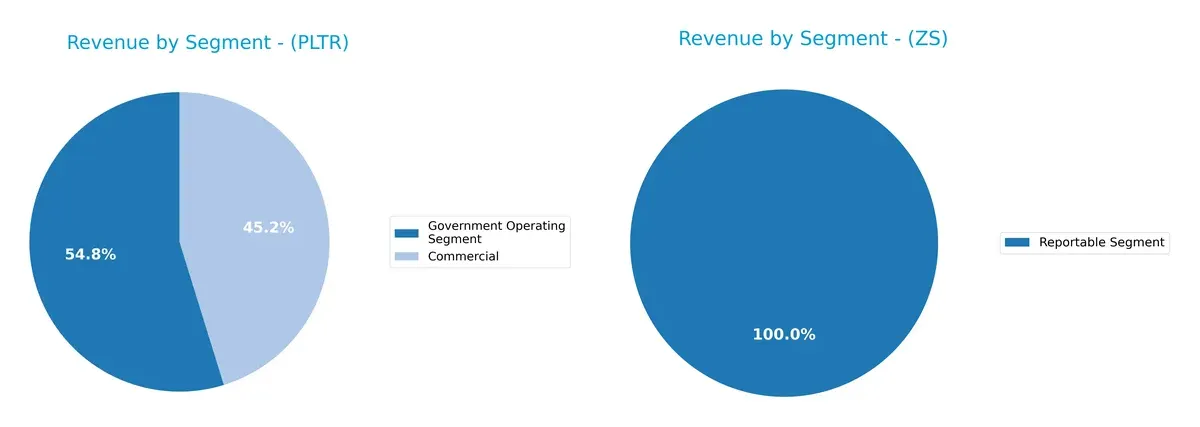
Palantir splits its FY2024 revenue between Commercial at $1.3B and Government at $1.57B, showing a balanced but slightly government-anchored mix. Zscaler, by contrast, reports a single segment at $2.67B, indicating high concentration. Palantir’s diversification reduces sector risk and leverages public-private ecosystem lock-in, while Zscaler’s reliance on one segment suggests vulnerability to market swings but potential infrastructure dominance within that niche.
Strengths and Weaknesses Comparison
This table compares the Strengths and Weaknesses of Palantir Technologies Inc. and Zscaler, Inc.:
Palantir Strengths
- High net margin of 36.31%
- ROE at 22.0% indicates strong profitability
- Low debt-to-assets ratio of 2.58%
- Robust quick ratio at 7.11
- Significant government and commercial revenue diversification
- Expanding global presence with US, UK, and Rest of World sales
Zscaler Strengths
- Favorable current and quick ratios at 2.01 show solid liquidity
- Debt-to-assets at 27.98% with neutral debt-to-equity
- Positive fixed asset turnover at 4.22
- Concentrated revenue stream of 2.67B USD in reportable segment
- Presence in multiple geographies including US, EMEA, and Asia Pacific
Palantir Weaknesses
- Unfavorable high PE of 259.19 and PB of 57.02 indicate overvaluation risk
- High current ratio of 7.11 may imply inefficient asset use
- WACC at 11.79% exceeds ROIC, reducing capital efficiency
- No dividend yield
- Moderate asset turnover of 0.5
Zscaler Weaknesses
- Negative net margin (-1.55%), ROE (-2.31%), and ROIC (-3.18%) indicate profitability challenges
- Unfavorable interest coverage at -0.92 signals financial strain
- Unfavorable asset turnover at 0.42
- Unfavorable PB of 24.51
- Negative PE due to losses
- No dividend yield
Palantir demonstrates strong profitability and low leverage with diverse revenue sources, but faces valuation and capital efficiency concerns. Zscaler shows liquidity strengths but struggles with profitability and financial leverage, highlighting challenges in capital allocation and operational efficiency.
The Moat Duel: Analyzing Competitive Defensibility
A structural moat is the only thing protecting long-term profits from the erosion of competition. Let’s dissect how Palantir and Zscaler defend their turf:
Palantir Technologies Inc.: Data Integration and AI-Driven Switching Costs
Palantir’s moat centers on high switching costs through bespoke AI platforms integrating complex datasets. Its soaring ROIC above WACC signals robust value creation and margin stability. Expansion into large language model applications deepens defensibility in 2026.
Zscaler, Inc.: Cloud Security Network Effects
Zscaler leverages network effects in cloud security, contrasting Palantir’s data-centric moat. Despite a negative ROIC spread versus WACC, its improving profitability suggests strengthening competitive positioning. Growth in workload segmentation offers fresh expansion avenues.
Moat Battle: Switching Costs vs. Network Effects in Software Infrastructure
Palantir’s wider and deeper moat stems from durable switching costs and accelerating ROIC, outpacing Zscaler’s still fragile value creation. Palantir is better equipped to defend market share against escalating competition through its integrated AI ecosystem.
Which stock offers better returns?
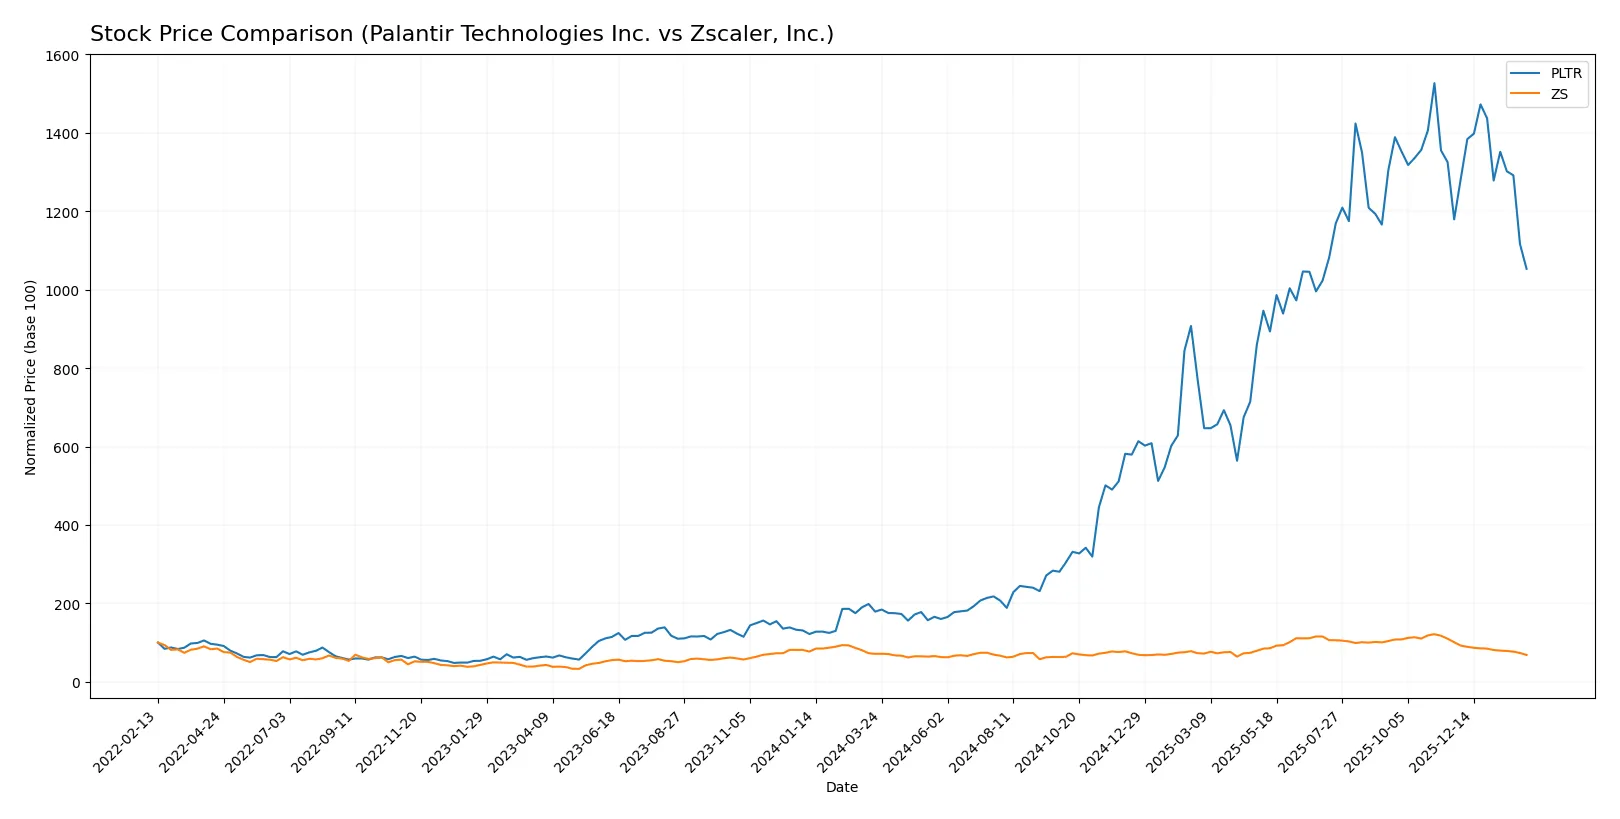
Over the past year, Palantir Technologies Inc. showed strong gains with a significant price rise, while Zscaler, Inc. exhibited a downward trajectory, reflecting contrasting trading dynamics.
Trend Comparison
Palantir’s stock gained 488.74% over the past 12 months, a clear bullish trend with decelerating momentum, hitting a high of 200.47 and a low of 20.47.
Zscaler’s stock declined 3.87% over the same period, indicating a bearish trend with deceleration, reaching a high of 331.14 and a low of 156.78.
Palantir outperformed Zscaler, delivering substantially higher returns and a bullish trajectory compared to Zscaler’s moderate bearish trend.
Target Prices
Analysts present a bullish consensus for Palantir Technologies Inc. and Zscaler, Inc., with targets well above current prices.
| Company | Target Low | Target High | Consensus |
|---|---|---|---|
| Palantir Technologies Inc. | 180 | 230 | 198.8 |
| Zscaler, Inc. | 260 | 360 | 311.41 |
Palantir’s consensus target of $198.8 suggests a 43% upside from its $138.46 stock price. Zscaler’s $311.41 target implies a strong 67% potential gain from $186.21.

Don’t Let Luck Decide Your Entry Point
Optimize your entry points with our advanced ProRealTime indicators. You’ll get efficient buy signals with precise price targets for maximum performance. Start outperforming now!
How do institutions grade them?
Institutional grades for Palantir Technologies Inc. and Zscaler, Inc. reveal varied analyst perspectives:
Palantir Technologies Inc. Grades
This table summarizes recent grades from major financial institutions for Palantir Technologies Inc.
| Grading Company | Action | New Grade | Date |
|---|---|---|---|
| Citigroup | Maintain | Buy | 2026-02-03 |
| UBS | Maintain | Neutral | 2026-02-03 |
| DA Davidson | Maintain | Neutral | 2026-02-03 |
| Citigroup | Upgrade | Buy | 2026-01-12 |
| Morgan Stanley | Maintain | Equal Weight | 2025-11-04 |
| Piper Sandler | Maintain | Overweight | 2025-11-04 |
| Goldman Sachs | Maintain | Neutral | 2025-11-04 |
| Baird | Maintain | Neutral | 2025-11-04 |
| B of A Securities | Maintain | Buy | 2025-11-04 |
| UBS | Maintain | Neutral | 2025-11-04 |
Zscaler, Inc. Grades
This table shows recent analyst grades from reputable firms for Zscaler, Inc.
| Grading Company | Action | New Grade | Date |
|---|---|---|---|
| Citigroup | Maintain | Buy | 2026-01-13 |
| Keybanc | Maintain | Overweight | 2026-01-12 |
| RBC Capital | Maintain | Outperform | 2026-01-05 |
| Piper Sandler | Maintain | Neutral | 2026-01-05 |
| Mizuho | Upgrade | Outperform | 2025-12-16 |
| Citigroup | Maintain | Buy | 2025-12-01 |
| Bernstein | Downgrade | Market Perform | 2025-12-01 |
| Stifel | Maintain | Buy | 2025-11-26 |
| Citizens | Maintain | Market Outperform | 2025-11-26 |
| Rosenblatt | Maintain | Buy | 2025-11-26 |
Which company has the best grades?
Zscaler holds a stronger consensus with multiple “Buy” and “Outperform” ratings, including recent upgrades. Palantir’s grades cluster around “Neutral” and “Buy” with fewer upgrades. Investors may interpret Zscaler’s higher ratings as greater confidence from analysts, potentially influencing portfolio positioning.
Risks specific to each company
The following categories identify the critical pressure points and systemic threats facing both firms in the 2026 market environment:
1. Market & Competition
Palantir Technologies Inc.
- Strong net margin and ROE indicate competitive strength; however, high P/E and P/B ratios suggest overvaluation risk.
Zscaler, Inc.
- Negative profitability metrics and weak ROE reflect intense competitive pressure and operational struggles.
2. Capital Structure & Debt
Palantir Technologies Inc.
- Very low debt-to-equity and debt-to-assets ratios signal a conservative balance sheet and low financial risk.
Zscaler, Inc.
- Moderate debt-to-assets and a debt-to-equity ratio of 1.0 raise concerns over leverage and financial flexibility.
3. Stock Volatility
Palantir Technologies Inc.
- Beta of 1.687 indicates above-average volatility compared to the market, increasing risk for traders.
Zscaler, Inc.
- Beta near 1.0 shows stock volatility roughly in line with the market, offering more stability.
4. Regulatory & Legal
Palantir Technologies Inc.
- Operates heavily in government and intelligence sectors, exposing it to regulatory scrutiny and geopolitical risks.
Zscaler, Inc.
- Cloud security focus entails compliance with evolving data privacy laws, which can increase operational complexity.
5. Supply Chain & Operations
Palantir Technologies Inc.
- Strong asset turnover metrics suggest efficient operations, but dependence on government contracts poses concentration risk.
Zscaler, Inc.
- Lower asset turnover indicates operational inefficiencies; global supply chain disruptions could affect service delivery.
6. ESG & Climate Transition
Palantir Technologies Inc.
- Limited direct ESG risk due to software focus; however, government contracts may attract scrutiny on data ethics.
Zscaler, Inc.
- Cloud services require significant energy use; sustainability initiatives are critical to mitigate climate transition risks.
7. Geopolitical Exposure
Palantir Technologies Inc.
- Significant exposure to U.S. intelligence and allied nations increases geopolitical risk amid global tensions.
Zscaler, Inc.
- Global client base diversifies geopolitical risk but also exposes the firm to varied international regulatory environments.
Which company shows a better risk-adjusted profile?
Palantir faces its biggest risk in market overvaluation and geopolitical exposure tied to government contracts. Zscaler struggles with profitability and financial leverage, elevating bankruptcy risk despite lower stock volatility. Palantir’s conservative capital structure and strong operational metrics give it a superior risk-adjusted profile in 2026. Notably, Palantir’s Altman Z-score of 135 confirms robust financial health versus Zscaler’s weaker Piotroski score of 3, underscoring concerns over Zscaler’s operational sustainability.
Final Verdict: Which stock to choose?
Palantir Technologies Inc. (PLTR) showcases a remarkable ability to generate value through its growing return on invested capital well above its cost of capital. Its superpower lies in operational efficiency and robust profitability that outpaces many peers. A point of vigilance remains its sky-high valuation multiples, which could temper near-term upside. It fits best in an aggressive growth portfolio willing to weather volatility for outsized returns.
Zscaler, Inc. (ZS) holds a strategic moat rooted in cloud security and recurring revenue streams, providing some predictability despite current profitability challenges. Compared to Palantir, it appears safer on liquidity but lacks strong value creation, reflecting a slightly unfavorable moat. Zscaler suits a GARP (Growth at a Reasonable Price) portfolio aiming for steady growth with moderate risk exposure.
If you prioritize dynamic growth backed by proven value creation and operational excellence, Palantir outshines as the compelling choice due to its sustainable competitive advantage and superior profitability. However, if you seek steadier revenue visibility and a more conservative play in cloud security, Zscaler offers better stability despite its ongoing value erosion. Both present distinct analytical scenarios aligned with different investor risk appetites.
Disclaimer: Investment carries a risk of loss of initial capital. The past performance is not a reliable indicator of future results. Be sure to understand risks before making an investment decision.
Go Further
I encourage you to read the complete analyses of Palantir Technologies Inc. and Zscaler, Inc. to enhance your investment decisions: