Home > Comparison > Technology > PLTR vs WIX
The strategic rivalry between Palantir Technologies Inc. and Wix.com Ltd. shapes the evolution of the technology sector’s software infrastructure segment. Palantir operates as a data-centric, enterprise software platform focused on complex analytics and intelligence solutions. Wix.com, by contrast, delivers accessible, cloud-based web development tools with a strong emphasis on user-friendly design. This analysis aims to identify which operational model offers a superior risk-adjusted return for a diversified portfolio amid shifting tech dynamics.

Table of contents
Companies Overview
Palantir Technologies Inc. and Wix.com Ltd. shape distinct niches within the global software infrastructure sector.
Palantir Technologies Inc.: Data-Driven Intelligence Leader
Palantir dominates the software infrastructure space by providing advanced data analytics platforms for intelligence and commercial clients. Its revenue stems from Palantir Gotham and Foundry, which enable deep data integration and operational insights. In 2026, Palantir emphasizes expanding its Artificial Intelligence Platform to unify large language models and accelerate client decision-making.
Wix.com Ltd.: Empowering Digital Creation
Wix.com stands as a leading cloud-based website development platform with a user-friendly drag-and-drop interface. Its core revenue derives from premium subscriptions and complementary services like Wix Payments and Ascend. The company focuses on enhancing user automation and connectivity tools to support millions of creators and small businesses globally in 2026.
Strategic Collision: Similarities & Divergences
Both companies excel in software infrastructure but target different markets—Palantir serves data-intensive enterprise and government sectors, while Wix caters to individuals and SMEs. They compete indirectly on digital transformation’s breadth, with Palantir’s closed, data-centric ecosystem contrasting Wix’s open, user-driven platform. This divergence defines their unique investment profiles—Palantir’s tech-heavy innovation versus Wix’s scalable SaaS growth.
Income Statement Comparison
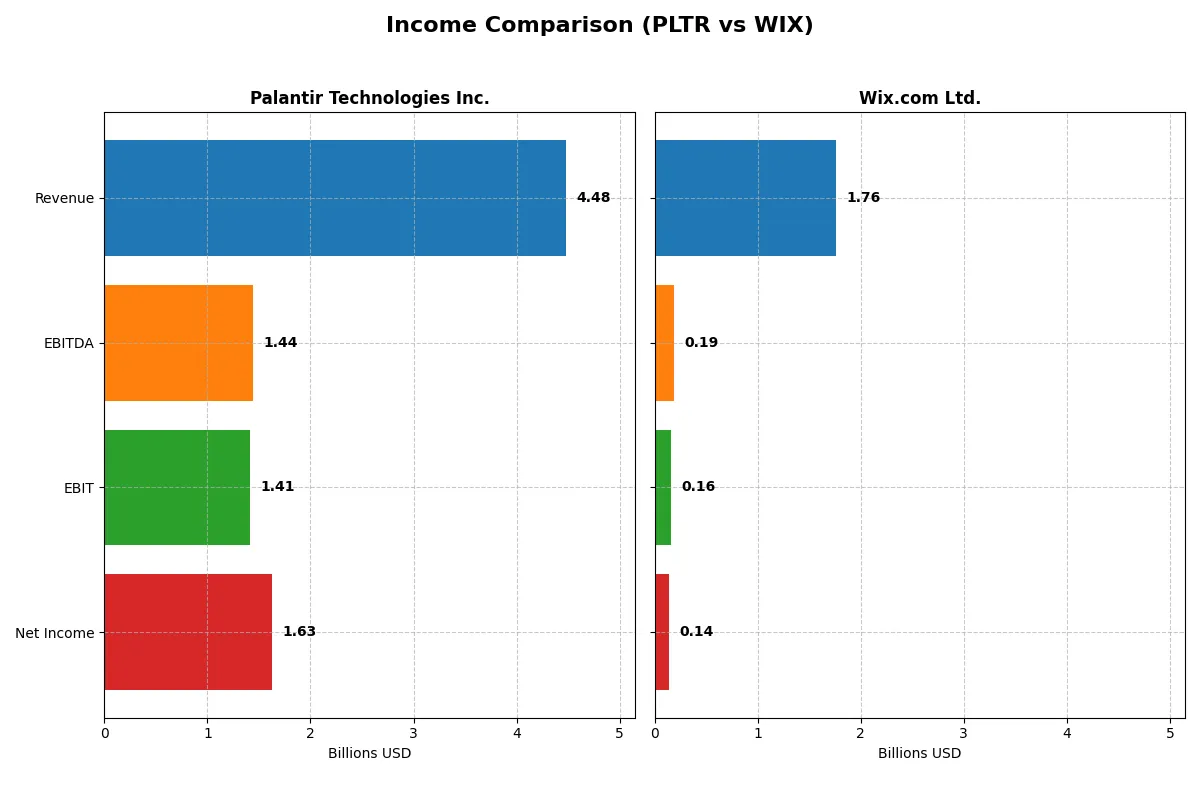
This data dissects the core profitability and scalability of both corporate engines to reveal who dominates the bottom line:
| Metric | Palantir Technologies Inc. (PLTR) | Wix.com Ltd. (WIX) |
|---|---|---|
| Revenue | 4.48B | 1.76B |
| Cost of Revenue | 789M | 565M |
| Operating Expenses | 2.27B | 1.10B |
| Gross Profit | 3.69B | 1.20B |
| EBITDA | 1.44B | 186M |
| EBIT | 1.41B | 155M |
| Interest Expense | 0 | 3.86M |
| Net Income | 1.63B | 138M |
| EPS | 0.69 | 2.49 |
| Fiscal Year | 2025 | 2024 |
Income Statement Analysis: The Bottom-Line Duel
This income statement comparison reveals which company runs the more efficient and profitable corporate engine over recent years.
Palantir Technologies Inc. Analysis
Palantir’s revenue surged from $1.54B in 2021 to $4.48B in 2025, with net income rocketing from a loss to $1.63B. Gross margins remain robust above 82%, while net margins climbed to 36.3%, signaling exceptional profitability and operational leverage. In 2025, Palantir’s EBIT margin of 31.6% reflects strong momentum and efficient cost control amid rapid growth.
Wix.com Ltd. Analysis
Wix’s revenue grew steadily from $984M in 2020 to $1.76B in 2024, with net income shifting from a $167M loss to $138M profit. Gross margin at 67.9% supports moderate profitability, but net margin lags at 7.9%, highlighting tighter bottom-line pressure. The 2024 EBIT margin of 8.8% shows improving operating efficiency, though Wix’s scale and profitability remain more modest than Palantir’s.
Verdict: High Margin Growth vs. Steady Revenue Expansion
Palantir outpaces Wix with superior margin expansion and explosive net income growth, delivering a 36% net margin against Wix’s sub-8%. While Wix offers steady top-line growth and improving efficiency, Palantir’s financial profile demonstrates a clearer fundamental winner for investors prioritizing profitability and margin strength. Palantir’s profile suits those seeking high-margin scale and rapid earnings acceleration.
Financial Ratios Comparison
These vital ratios act as a diagnostic tool to expose the underlying fiscal health, valuation premiums, and capital efficiency of the companies compared:
| Ratios | Palantir Technologies Inc. (PLTR) | Wix.com Ltd. (WIX) |
|---|---|---|
| ROE | 22.0% | -175.6% |
| ROIC | 17.9% | 9.1% |
| P/E | 259.2 | 86.2 |
| P/B | 57.0 | -151.4 |
| Current Ratio | 7.11 | 0.84 |
| Quick Ratio | 7.11 | 0.84 |
| D/E (Debt-to-Equity) | 0.03 | -12.31 |
| Debt-to-Assets | 2.58% | 50.7% |
| Interest Coverage | 0 | 25.9 |
| Asset Turnover | 0.50 | 0.92 |
| Fixed Asset Turnover | 17.76 | 3.33 |
| Payout ratio | 0 | 0 |
| Dividend yield | 0% | 0% |
| Fiscal Year | 2025 | 2024 |
Efficiency & Valuation Duel: The Vital Signs
Financial ratios serve as a company’s DNA, unveiling its hidden risks and operational strengths crucial for investment decisions.
Palantir Technologies Inc.
Palantir displays a robust 22% ROE and a strong 36.3% net margin, signaling operational efficiency. However, its valuation is stretched with a P/E of 259 and P/B of 57, reflecting high market expectations. Palantir returns value mainly through reinvestment in R&D, fueling growth rather than dividends.
Wix.com Ltd.
Wix posts a modest 7.9% net margin and negative ROE at -175.6%, indicating profitability challenges. Its P/E ratio of 86 is expensive but less extreme than Palantir’s. Wix lacks dividends, focusing shareholder returns on growth investments amid a weaker liquidity profile with a current ratio below 1.
Premium Valuation vs. Operational Safety
Palantir offers superior profitability and capital efficiency but at a highly stretched valuation and weak current ratio. Wix trades at a lower valuation but struggles with returns and liquidity. Investors seeking growth with high risk may prefer Palantir; those favoring caution might lean toward Wix’s more moderate profile.
Which one offers the Superior Shareholder Reward?
I observe that neither Palantir Technologies Inc. (PLTR) nor Wix.com Ltd. (WIX) pay dividends in 2026. Palantir deploys substantial free cash flow (0.89/share in 2025) into growth and operational cash flow efficiency, reflected in a strong operating cash flow coverage ratio of 9.3x. Wix shows positive free cash flow (8.63/share in 2024) but suffers from weaker solvency (debt/assets above 50%) and lower operating cash flow coverage (0.51x), signalling higher financial risk. Palantir’s zero payout ratio and absence of buybacks contrast with Wix’s modest buyback activity implied by its capital expenditure coverage ratio of 27.9x, suggesting some shareholder return via buybacks. However, Palantir’s pristine balance sheet and superior margins (net margin 36.3% vs. Wix’s 7.9%) offer a more sustainable distribution model and long-term capital appreciation. I conclude Palantir offers a superior total return profile in 2026, balancing growth reinvestment with financial prudence better than Wix.
Comparative Score Analysis: The Strategic Profile
The radar chart reveals the fundamental DNA and trade-offs of Palantir Technologies Inc. and Wix.com Ltd., highlighting their core financial strengths and vulnerabilities:
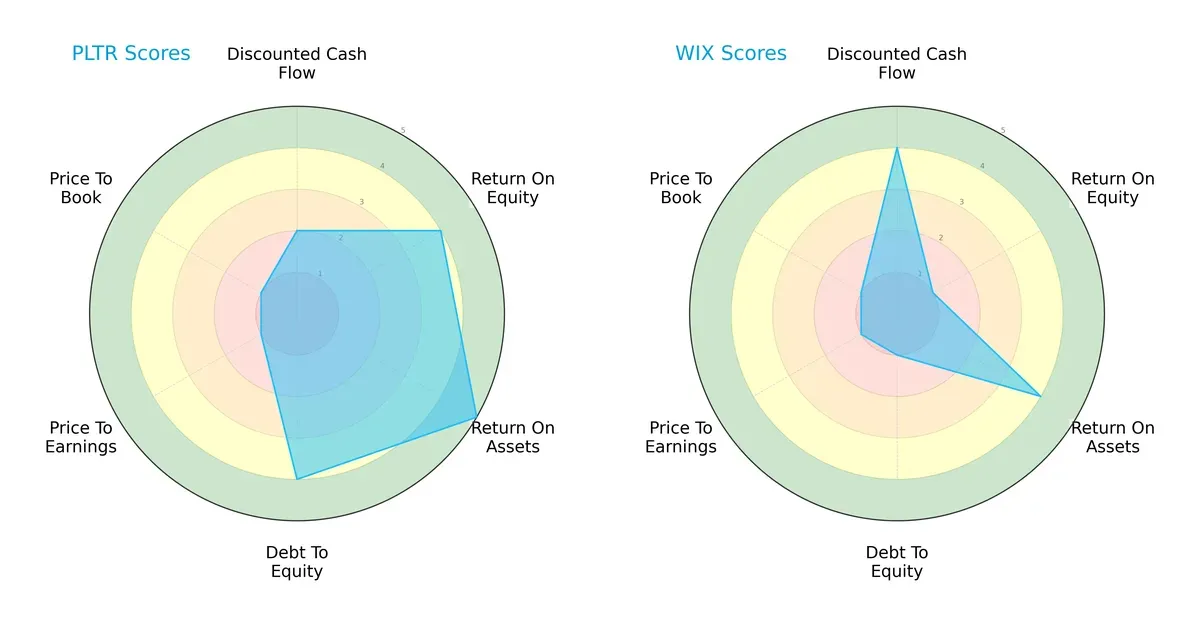
Palantir shows a balanced profile with strong ROE (4) and ROA (5) scores and solid debt management (4). Wix excels in discounted cash flow (4) but struggles with profitability (ROE 1) and leverage (debt-to-equity 1). Palantir relies on operational efficiency, while Wix depends on valuation metrics. Palantir’s overall score (3) edges out Wix’s (2), reflecting a more stable financial foundation.
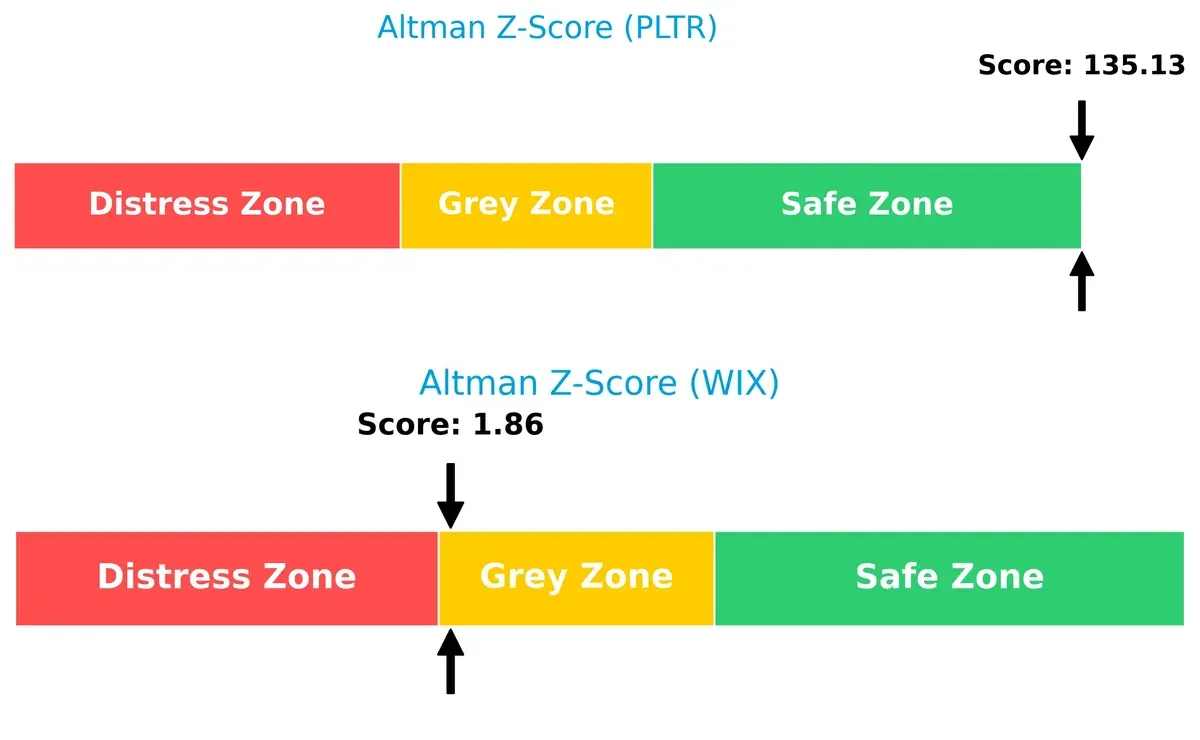
Bankruptcy Risk: Solvency Showdown
Palantir’s Altman Z-Score of 135 places it firmly in the safe zone, signaling robust long-term survival prospects. Wix’s 1.86 score situates it in the grey zone, suggesting moderate bankruptcy risk amid current market pressures:
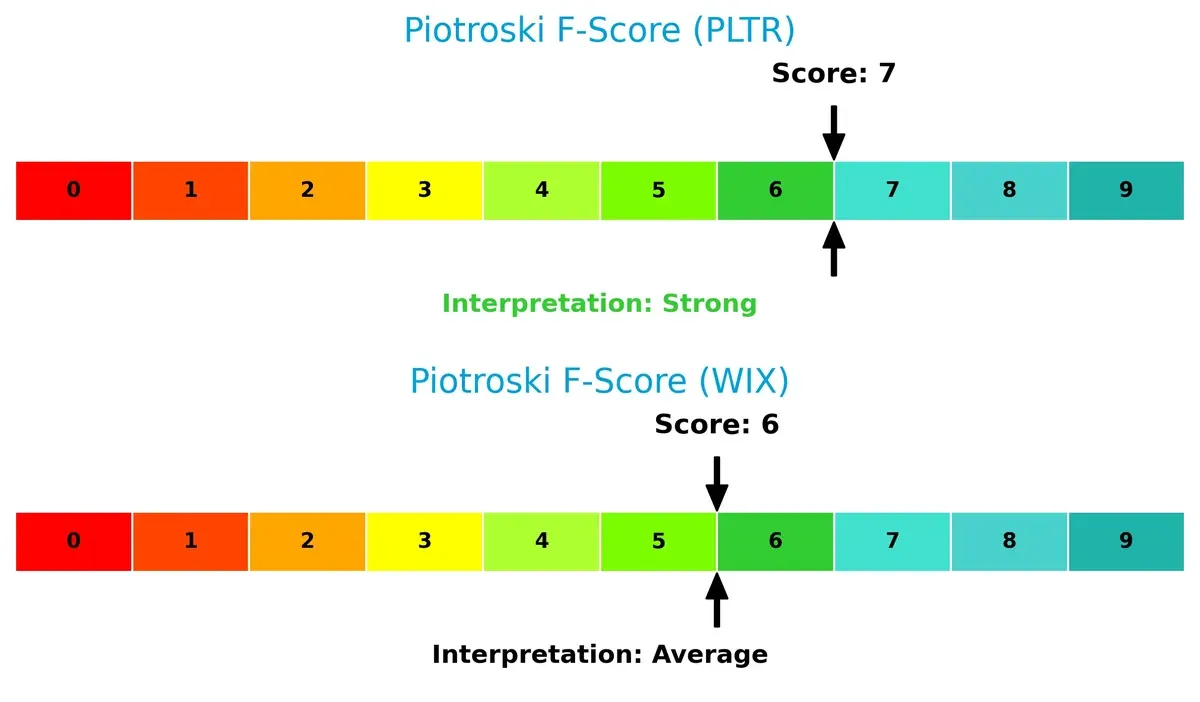
Financial Health: Quality of Operations
Palantir’s Piotroski score of 7 indicates strong financial health and operational quality. Wix’s 6, while decent, points to some red flags in internal metrics, signaling caution for risk-averse investors:
How are the two companies positioned?
This section dissects the operational DNA of Palantir and Wix by comparing their revenue distribution and internal strengths and weaknesses. The goal is to confront their economic moats to identify the most resilient and sustainable competitive advantage in today’s market.
Revenue Segmentation: The Strategic Mix
The following comparison dissects how Palantir Technologies Inc. and Wix.com Ltd. diversify their income streams and where their primary sector bets lie:
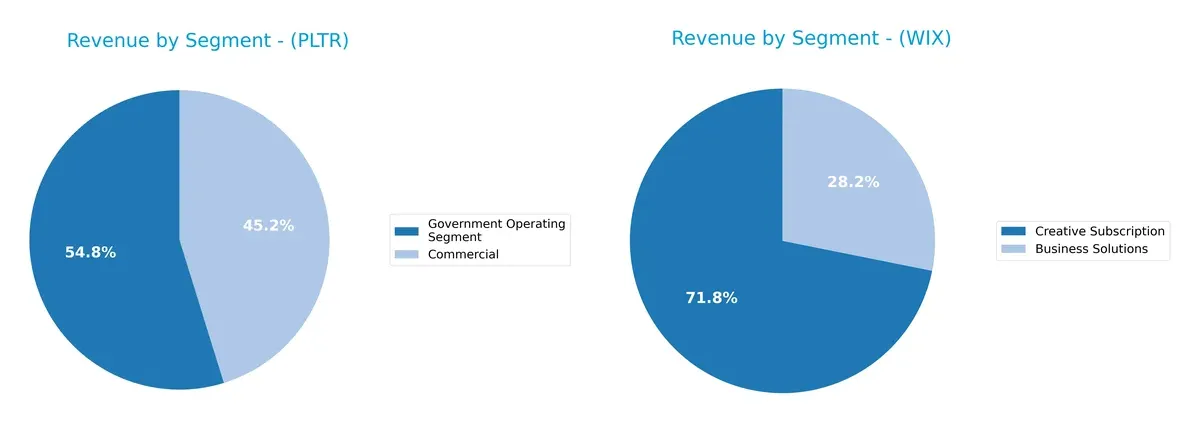
Palantir anchors revenue in government contracts, with $1.57B in 2024 dwarfing its $1.3B commercial segment. Wix leans on a more balanced mix but pivots heavily on its $1.26B creative subscription, complemented by $496M from business solutions. Palantir’s reliance on government projects signals infrastructure dominance but concentration risk. Wix’s mix suggests ecosystem lock-in through recurring subscriptions, offering steadier growth potential.
Strengths and Weaknesses Comparison
This table compares the strengths and weaknesses of Palantir Technologies Inc. and Wix.com Ltd.:
Palantir Strengths
- High net margin of 36.3%
- Strong ROE at 22%
- ROIC well above WACC at 17.95%
- Very low debt levels with D/E of 0.03
- Favorable fixed asset turnover of 17.76
- Diverse revenue from commercial and government segments
Wix Strengths
- Favorable PB despite negative ROE
- Strong interest coverage ratio of 40.14
- Positive fixed asset turnover of 3.33
- Revenue diversified between business solutions and creative subscriptions
- Global presence includes North America, Europe, Asia Pacific, and Latin America
Palantir Weaknesses
- Unfavorable high P/E of 259.19
- High current ratio at 7.11 indicating possible inefficient asset use
- WACC higher than ROE
- No dividend yield
- Slightly low asset turnover at 0.5
- Market exposure heavily weighted to U.S.
Wix Weaknesses
- Negative ROE at -175.57%
- Unfavorable high debt to assets ratio of 50.7%
- Current ratio below 1 at 0.84 signals liquidity risk
- High P/E of 86.21
- No dividend yield
- Asset turnover neutral at 0.92
Palantir exhibits robust profitability and low leverage but faces valuation and liquidity inefficiencies. Wix shows global diversification yet struggles with profitability and financial structure weaknesses. Both companies present contrasting financial profiles affecting strategic execution.
The Moat Duel: Analyzing Competitive Defensibility
A structural moat is the only reliable shield protecting long-term profits from relentless competitive erosion in dynamic markets:
Palantir Technologies Inc.: Data Network Lockdown
Palantir’s moat stems from its unique data integration and analytics platform, creating high switching costs. Its ROIC exceeds WACC by 6.2%, reflecting strong value creation and margin stability. In 2026, expanding AI-driven products could deepen this advantage.
Wix.com Ltd.: DIY Ecosystem Convenience
Wix’s moat centers on an easy-to-use, integrated website-building ecosystem that attracts millions. Unlike Palantir, Wix’s ROIC falls slightly below WACC, signaling value destruction despite improving profitability. Growth in payment and marketing tools offers upside but faces fierce competition.
Verdict: Data Integration Dominates DIY Ecosystem Lock-in
Palantir boasts a wider, more durable moat with consistent value creation and rising ROIC. Wix’s moat is narrower and financially fragile, making Palantir better positioned to defend market share amid intensifying innovation battles.
Which stock offers better returns?
The past year reveals starkly divergent price dynamics between Palantir Technologies Inc. and Wix.com Ltd., with Palantir showing strong overall gains despite recent softness, while Wix faces sustained declines.
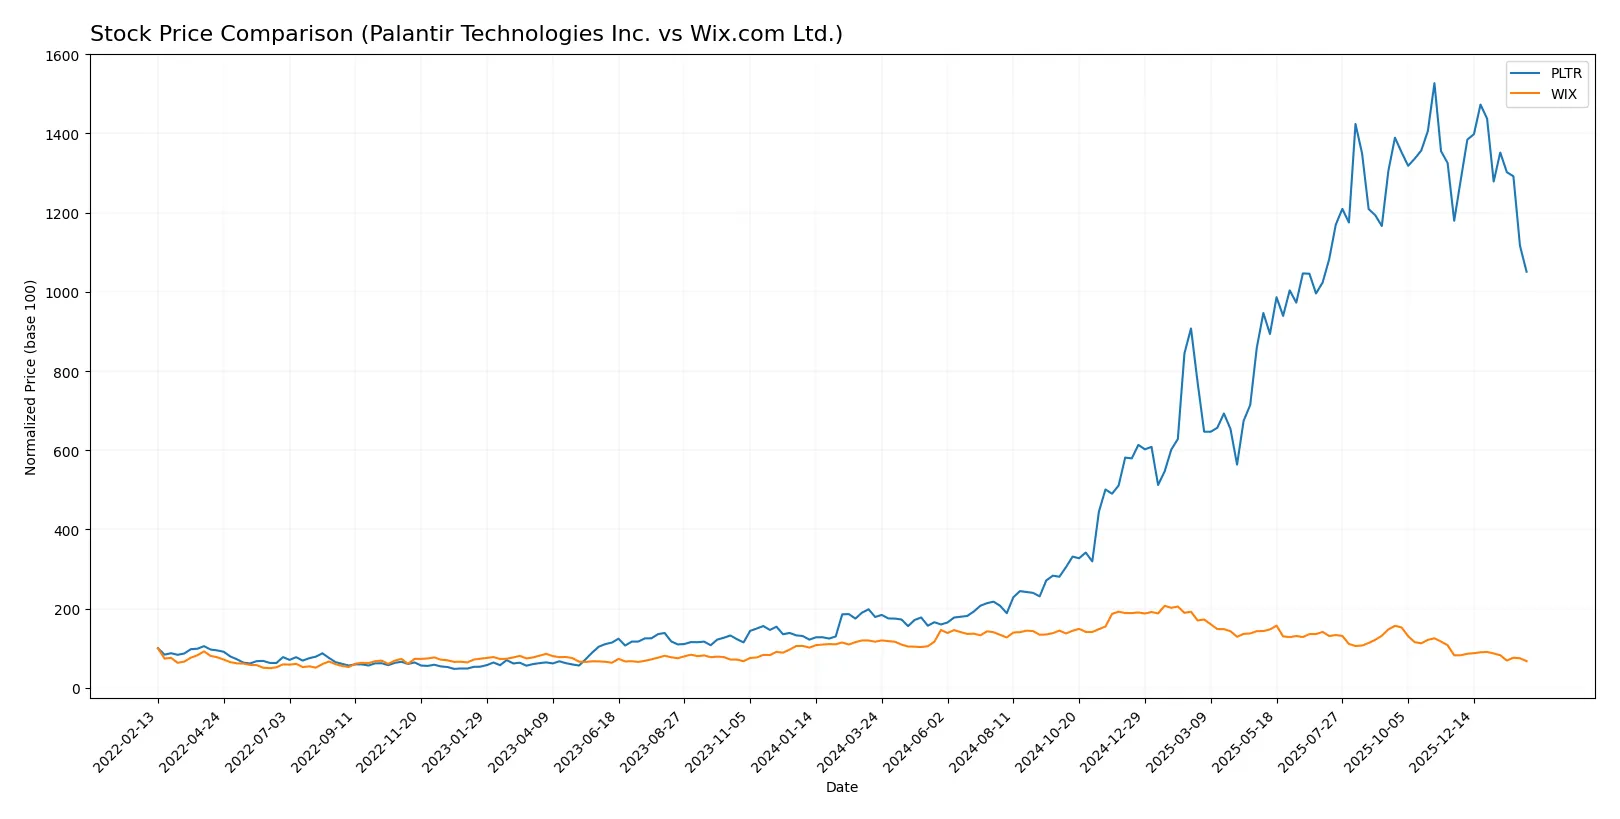
Trend Comparison
Palantir’s stock surged 487.27% over the last 12 months, marking a bullish trend with decelerating momentum and a high volatility of 59.55. It peaked at 200.47 and bottomed at 20.47.
Wix.com’s stock dropped 42.04% in the same period, reflecting a bearish trend with decelerating declines and moderate volatility at 36.49. Its price ranged between 78.57 and 240.89.
Palantir outperformed Wix significantly, delivering the highest market return despite a recent 10.91% pullback versus Wix’s steeper 17.74% loss.
Target Prices
Analysts show a broad but optimistic target range for these tech infrastructure leaders.
| Company | Target Low | Target High | Consensus |
|---|---|---|---|
| Palantir Technologies Inc. | 180 | 230 | 198.8 |
| Wix.com Ltd. | 70 | 210 | 157.33 |
Palantir’s consensus target price sits roughly 44% above its current 138 price, signaling strong growth expectations. Wix’s consensus target exceeds its 79 price by nearly 98%, reflecting high analyst optimism despite wide valuation dispersion.

Don’t Let Luck Decide Your Entry Point
Optimize your entry points with our advanced ProRealTime indicators. You’ll get efficient buy signals with precise price targets for maximum performance. Start outperforming now!
How do institutions grade them?
Palantir Technologies Inc. Grades
The following table summarizes recent institutional grades for Palantir Technologies Inc.:
| Grading Company | Action | New Grade | Date |
|---|---|---|---|
| Citigroup | Maintain | Buy | 2026-02-03 |
| UBS | Maintain | Neutral | 2026-02-03 |
| DA Davidson | Maintain | Neutral | 2026-02-03 |
| Citigroup | Upgrade | Buy | 2026-01-12 |
| Morgan Stanley | Maintain | Equal Weight | 2025-11-04 |
| Piper Sandler | Maintain | Overweight | 2025-11-04 |
| Goldman Sachs | Maintain | Neutral | 2025-11-04 |
| Baird | Maintain | Neutral | 2025-11-04 |
| B of A Securities | Maintain | Buy | 2025-11-04 |
| UBS | Maintain | Neutral | 2025-11-04 |
Wix.com Ltd. Grades
Below are the latest institutional grades issued for Wix.com Ltd.:
| Grading Company | Action | New Grade | Date |
|---|---|---|---|
| Oppenheimer | Maintain | Outperform | 2026-02-02 |
| Citizens | Maintain | Market Outperform | 2026-01-22 |
| Barclays | Maintain | Overweight | 2026-01-21 |
| Morgan Stanley | Maintain | Overweight | 2026-01-15 |
| Wells Fargo | Maintain | Overweight | 2025-12-19 |
| Cantor Fitzgerald | Maintain | Overweight | 2025-12-11 |
| Citizens | Maintain | Market Outperform | 2025-11-20 |
| RBC Capital | Maintain | Outperform | 2025-11-20 |
| Scotiabank | Maintain | Sector Outperform | 2025-11-20 |
| B. Riley Securities | Maintain | Buy | 2025-11-20 |
Which company has the best grades?
Wix.com Ltd. consistently receives higher grades such as Outperform and Overweight from multiple institutions. Palantir’s grades cluster around Neutral and Buy, with fewer strong endorsements. Wix’s stronger consensus may attract investors seeking more confident institutional support.
Risks specific to each company
In the 2026 market environment, critical pressure points and systemic threats confront both Palantir Technologies Inc. and Wix.com Ltd. These risk categories reveal their vulnerabilities and resilience:
1. Market & Competition
Palantir Technologies Inc.
- Operates in competitive software infrastructure with strong government contracts but faces tech disruption risk.
Wix.com Ltd.
- Faces intense competition in cloud-based website platforms, with pressure from larger ecosystem players.
2. Capital Structure & Debt
Palantir Technologies Inc.
- Exhibits very low debt levels (D/E 0.03), indicating strong financial stability and low leverage risk.
Wix.com Ltd.
- Displays high debt-to-assets (50.7%) and negative D/E ratio, implying reliance on debt financing and financial risk.
3. Stock Volatility
Palantir Technologies Inc.
- Beta of 1.69 signals above-market volatility, exposing shareholders to greater price swings.
Wix.com Ltd.
- Beta of 1.37 suggests moderately high volatility but less than Palantir’s, offering somewhat lower risk.
4. Regulatory & Legal
Palantir Technologies Inc.
- Operates heavily in intelligence and government data sectors, facing stringent regulations and potential compliance risks.
Wix.com Ltd.
- Subject to data privacy laws globally, especially in Europe, which could impact operational flexibility and costs.
5. Supply Chain & Operations
Palantir Technologies Inc.
- Relies on software deployment across diverse environments; operational risk from integration complexities.
Wix.com Ltd.
- Depends on cloud infrastructure and third-party services, vulnerable to disruptions in platform availability.
6. ESG & Climate Transition
Palantir Technologies Inc.
- Limited disclosure on ESG initiatives may raise investor concerns amid rising sustainability demands.
Wix.com Ltd.
- Increasing focus on ESG, yet energy intensity of cloud operations could pressure carbon footprint targets.
7. Geopolitical Exposure
Palantir Technologies Inc.
- Significant exposure to U.S. and allied intelligence agencies, risking impact from geopolitical tensions.
Wix.com Ltd.
- Headquartered in Israel with global operations; regional instability and trade policies pose risks.
Which company shows a better risk-adjusted profile?
Palantir’s most critical risk lies in regulatory and geopolitical exposure tied to government contracts and intelligence operations. Wix’s largest risk centers on its capital structure, with high leverage and financial distress signals. Palantir’s strong financial ratios, safe Altman Z-score, and low debt profile suggest a superior risk-adjusted profile. Meanwhile, Wix’s grey-zone Altman Z-score and negative equity ratios highlight vulnerability. The stark contrast in leverage and financial health justifies my heightened concern for Wix’s risk exposure.
Final Verdict: Which stock to choose?
Palantir Technologies Inc. demonstrates a remarkable ability to generate significant returns on invested capital, signaling a robust competitive edge. Its superpower lies in converting complex data into actionable insights with efficiency akin to a cash machine. A point of vigilance remains its sky-high valuation metrics, which could expose investors to volatility. It fits well in an aggressive growth portfolio seeking high reward.
Wix.com Ltd. benefits from a strategic moat centered on recurring revenue and cloud-based platform stickiness, offering a stable business model. Its safety profile appears more conservative compared to Palantir, despite a less impressive ROIC-WACC spread and some balance sheet concerns. Wix suits a GARP (Growth at a Reasonable Price) portfolio aiming for moderate growth with lower risk.
If you prioritize high growth and can tolerate valuation risks, Palantir outshines with its sustained value creation and expanding moat. However, if you seek better stability and a steadier income stream, Wix offers a more cautious investment scenario, though with less economic profit generation. Each presents distinct trade-offs aligned with different investor profiles.
Disclaimer: Investment carries a risk of loss of initial capital. The past performance is not a reliable indicator of future results. Be sure to understand risks before making an investment decision.
Go Further
I encourage you to read the complete analyses of Palantir Technologies Inc. and Wix.com Ltd. to enhance your investment decisions: