Home > Comparison > Technology > PLTR vs VERI
The strategic rivalry between Palantir Technologies Inc. and Veritone, Inc. shapes the evolving landscape of software infrastructure. Palantir operates as a capital-intensive leader, building advanced data integration platforms for intelligence and enterprise clients. Veritone, smaller and more agile, focuses on AI-driven cognitive solutions across multiple verticals. This analysis contrasts their business models to identify which offers superior risk-adjusted returns for a diversified portfolio navigating the technology sector’s dynamic growth and innovation cycles.
Table of contents
Companies Overview
Palantir Technologies and Veritone stand as pivotal players in the AI-driven software infrastructure space.
Palantir Technologies Inc.: Data-Driven Intelligence Powerhouse
Palantir dominates as a software infrastructure leader specializing in intelligence and operational analytics. Its revenue stems from Palantir Gotham and Foundry platforms, enabling governments and enterprises to unify and analyze complex datasets. In 2026, Palantir emphasizes scaling its AI Platform and Apollo deployment system to broaden customer reach and operational flexibility.
Veritone, Inc.: AI Operating System Innovator
Veritone positions itself as a niche AI computing provider with its aiWARE operating system. It monetizes through AI-based media services and analytical tools that extract insights from structured and unstructured data. Veritone’s 2026 strategy focuses on expanding AI model applications across media, government, and legal sectors to deepen vertical market penetration.
Strategic Collision: Similarities & Divergences
Both companies leverage AI to transform data into actionable intelligence but diverge in scope and scale. Palantir pursues a broad, platform-centric model targeting large institutional clients, while Veritone opts for specialized AI services with a vertical focus. Their primary battleground lies in enterprise adoption of AI-driven insights. This contrast defines distinct risk-return profiles for investors observing their innovation trajectories.
Income Statement Comparison
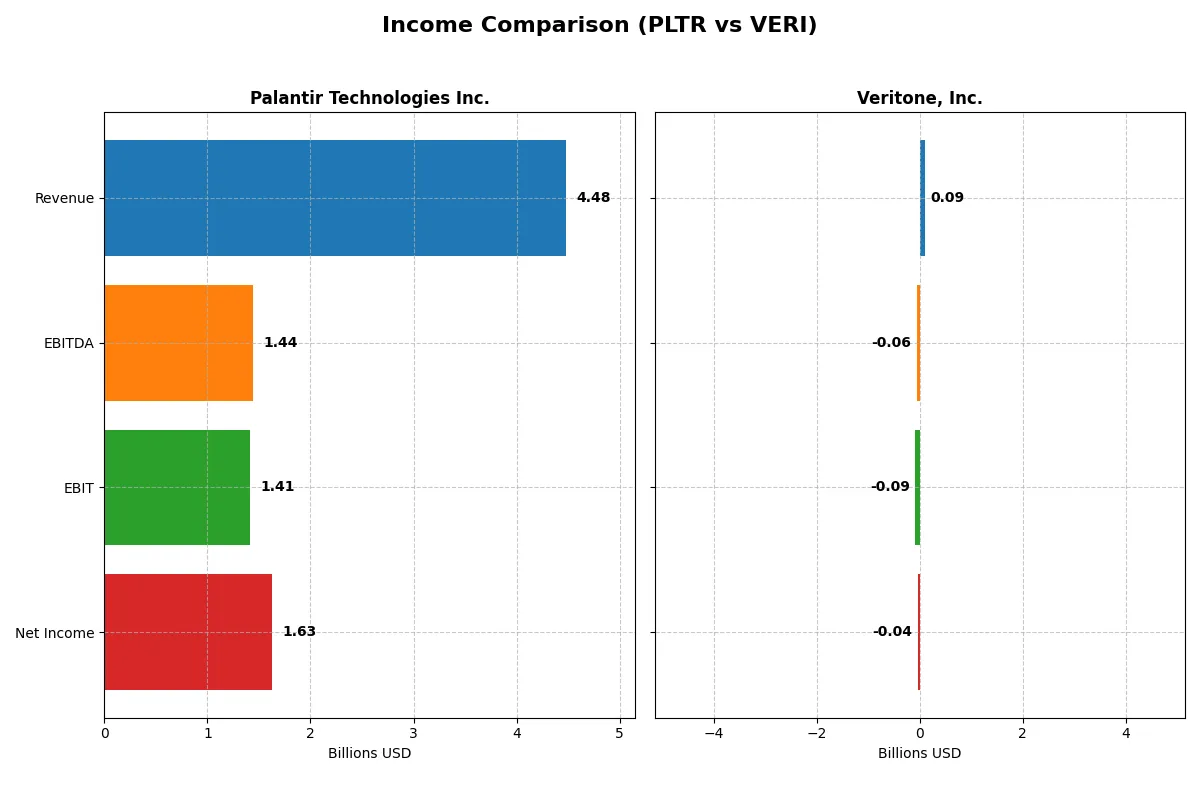
The following data dissects the core profitability and scalability of both corporate engines to reveal who dominates the bottom line:
| Metric | Palantir Technologies Inc. (PLTR) | Veritone, Inc. (VERI) |
|---|---|---|
| Revenue | 4.48B | 92.64M |
| Cost of Revenue | 789.18M | 27.25M |
| Operating Expenses | 2.27B | 153.59M |
| Gross Profit | 3.69B | 65.38M |
| EBITDA | 1.44B | -58.78M |
| EBIT | 1.41B | -88.12M |
| Interest Expense | 0 | 12.07M |
| Net Income | 1.63B | -37.38M |
| EPS | 0.69 | -0.98 |
| Fiscal Year | 2025 | 2024 |
Income Statement Analysis: The Bottom-Line Duel
This income statement comparison reveals which company runs a more efficient and profitable business engine through recent financial performance.
Palantir Technologies Inc. Analysis
Palantir’s revenue surged from 1.54B in 2021 to 4.48B in 2025, with net income soaring from a loss of 520M to a profit of 1.63B. Its gross margin stays robust above 82%, and net margin expands to 36.3%, showcasing strong operational leverage and rapid earnings momentum in 2025.
Veritone, Inc. Analysis
Veritone’s revenue peaked at 150M in 2022 but declined to 93M in 2024, with net income remaining negative at -37M most recently. Its gross margin holds at 70.6%, yet negative EBIT and net margins near -40% reflect ongoing cost and interest burdens, dragging profitability despite some margin improvement.
Verdict: High-Growth Profitability vs. Persistent Losses
Palantir outperforms Veritone decisively in revenue scale and margin quality, with a 56% one-year revenue jump and a positive 36% net margin in 2025. Veritone’s shrinking revenues and sustained losses highlight structural challenges. For investors, Palantir’s profile offers stronger earnings growth and margin durability.
Financial Ratios Comparison
These vital ratios act as a diagnostic tool to expose the underlying fiscal health, valuation premiums, and capital efficiency of the companies compared below:
| Ratios | Palantir Technologies Inc. (PLTR) | Veritone, Inc. (VERI) |
|---|---|---|
| ROE | 22.0% | -277.9% |
| ROIC | 17.9% | -58.3% |
| P/E | 259.2 | -3.34 |
| P/B | 57.0 | 9.27 |
| Current Ratio | 7.11 | 0.97 |
| Quick Ratio | 7.11 | 0.97 |
| D/E | 0.03 | 8.91 |
| Debt-to-Assets | 2.58% | 60.5% |
| Interest Coverage | 0 | -7.31 |
| Asset Turnover | 0.50 | 0.47 |
| Fixed Asset Turnover | 17.8 | 8.51 |
| Payout ratio | 0 | 0 |
| Dividend yield | 0 | 0 |
| Fiscal Year | 2025 | 2024 |
Efficiency & Valuation Duel: The Vital Signs
Financial ratios serve as a company’s DNA, unveiling hidden risks and operational strengths that raw figures often obscure.
Palantir Technologies Inc.
Palantir demonstrates strong profitability with a 22% ROE and a 36.31% net margin, signaling operational efficiency. However, its valuation is stretched, shown by a high P/E of 259 and P/B of 57. Palantir retains earnings to fuel R&D and growth, offering no dividend yield, which aligns with its innovation-driven strategy.
Veritone, Inc.
Veritone suffers weak profitability with a negative 278% ROE and a -40.36% net margin, reflecting operational challenges. The stock appears cheap on P/E but carries significant risk with high debt levels and a low current ratio. Veritone neither pays dividends nor has sustainable cash flow, relying heavily on restructuring and R&D investments.
Premium Valuation vs. Operational Struggles
Palantir balances robust profitability with a premium valuation, while Veritone faces severe profitability and liquidity issues despite a low P/E. Palantir offers a safer risk-reward profile for growth-focused investors, whereas Veritone suits those with high risk tolerance seeking turnaround potential.
Which one offers the Superior Shareholder Reward?
Palantir Technologies Inc. (PLTR) and Veritone, Inc. (VERI) both avoid dividends, focusing on reinvestment and buybacks. PLTR’s 2025 free cash flow per share stands at $0.89, fueling disciplined buybacks and robust margins near 36%. VERI suffers persistent losses and negative free cash flow, with high debt (debt-to-equity 8.9x) undermining sustainability. PLTR’s strong cash coverage and conservative leverage contrast sharply with VERI’s financial stress. I see PLTR’s distribution model—heavy on buybacks supported by sustainable cash flow—as the superior shareholder reward in 2026.
Comparative Score Analysis: The Strategic Profile
The radar chart reveals the fundamental DNA and trade-offs of Palantir Technologies Inc. and Veritone, Inc., highlighting their core financial strengths and vulnerabilities:
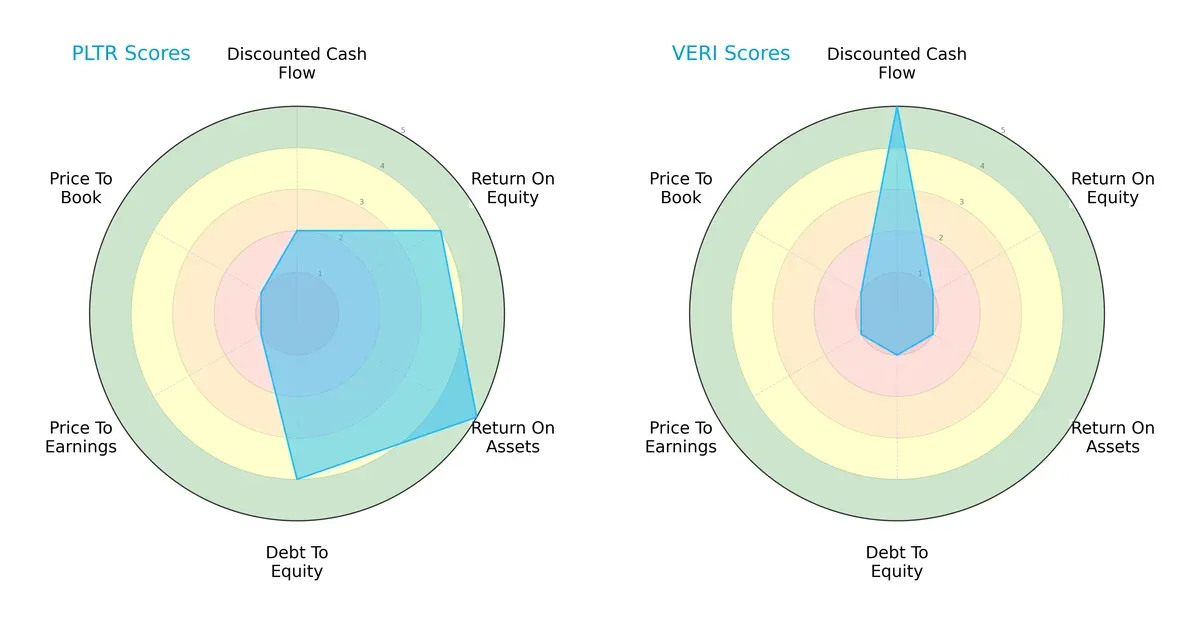
Palantir shows a balanced profile with strong ROE (4) and ROA (5) scores, indicating efficient profit and asset utilization. Its moderate DCF (2) and favorable debt-to-equity (4) scores suggest prudent capital management. Veritone relies heavily on a very favorable DCF (5) but scores very low on ROE (1), ROA (1), and debt-to-equity (1), signaling operational challenges and financial risk. Palantir’s valuation scores (PE and PB) are equally weak (1), showing potential market skepticism. Overall, Palantir displays a more stable and diversified financial foundation.
Bankruptcy Risk: Solvency Showdown
Palantir’s Altman Z-Score of 135 places it securely in the safe zone, while Veritone’s score of -0.2 signals distress risk. This wide delta implies:
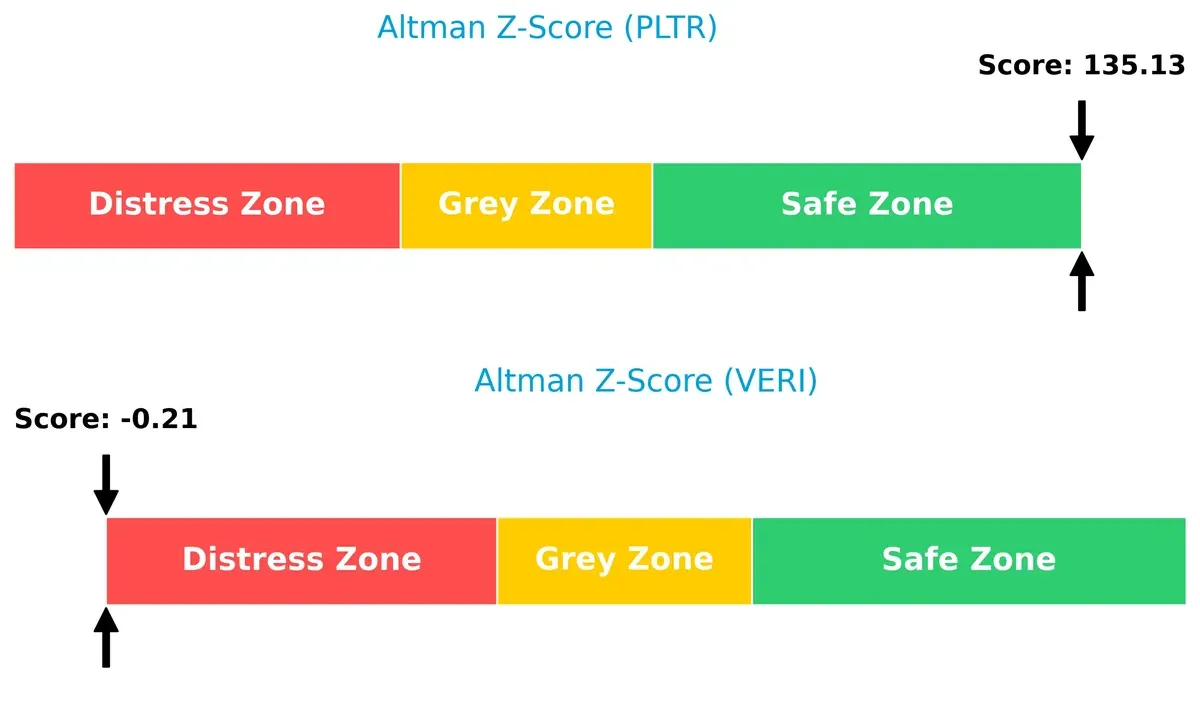
Palantir’s financial stability strongly supports long-term survival amid market cycles. Veritone faces a high bankruptcy risk without clear signs of recovery, making it a speculative choice for risk-averse investors.
Financial Health: Quality of Operations
Palantir’s Piotroski F-Score of 7 marks it as financially strong, whereas Veritone’s 3 indicates weak operational health. This contrast highlights:
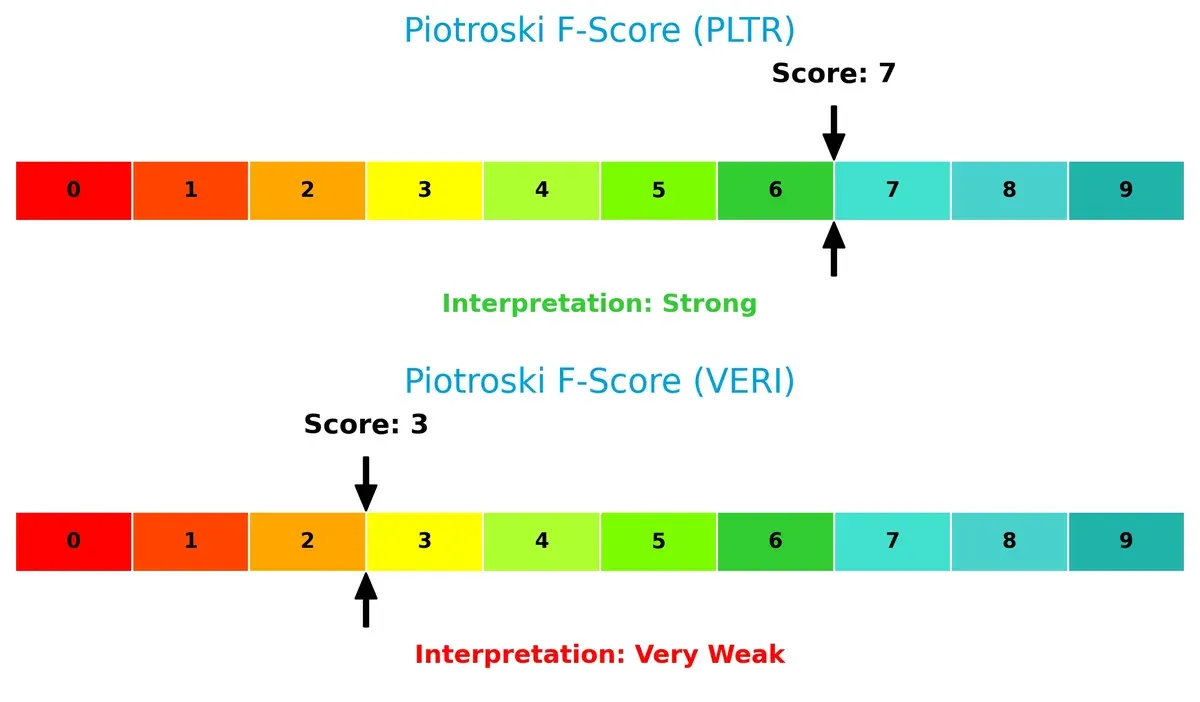
Palantir’s robust internal metrics reflect solid profitability, liquidity, and efficiency. Veritone’s low score flags red flags in its financial controls, cautioning investors about potential distress and underperformance.
How are the two companies positioned?
This section dissects Palantir and Veritone’s operational DNA by comparing revenue distribution and internal dynamics, including strengths and weaknesses. The final objective confronts their economic moats to identify which model offers the most resilient, sustainable competitive advantage today.
Revenue Segmentation: The Strategic Mix
The following visual comparison dissects how Palantir Technologies and Veritone diversify their income streams and where their primary sector bets lie:
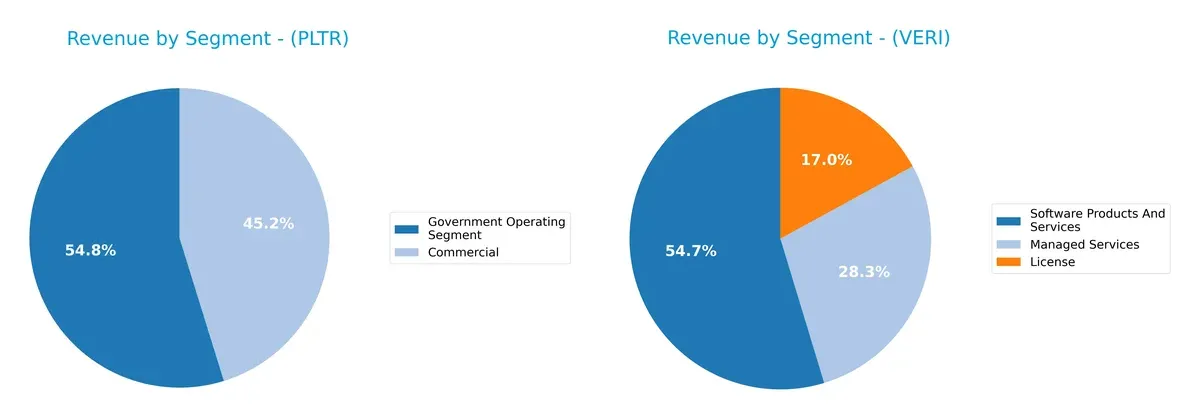
Palantir anchors its revenue in two segments: Government Operating at $1.57B and Commercial at $1.30B in 2024. This near-duopoly creates a focused yet balanced portfolio with strong government ties. Veritone, however, pivots across License ($19M), Managed Services ($32M), and Software Products ($61M), revealing a more diversified but smaller-scale mix. Palantir’s dominance in government contracts suggests infrastructure lock-in, while Veritone’s spread signals experimentation but risks dilution.
Strengths and Weaknesses Comparison
This table compares the Strengths and Weaknesses of Palantir Technologies Inc. and Veritone, Inc.:
Palantir Strengths
- High net margin at 36.31%
- Strong ROE of 22%
- ROIC at 17.95% exceeds WACC
- Very low debt levels
- Global revenue diversification, including US, UK, and Rest of World
- Diverse revenue streams from Commercial and Government sectors
Veritone Strengths
- Favorable P/E ratio despite losses
- Positive fixed asset turnover at 8.51
- Revenue diversification across License, Managed Services, and Software Products
- Presence in AI and media-related services
Palantir Weaknesses
- Unfavorable high P/E at 259.19
- Very high P/B at 57.02
- Current ratio unusually high at 7.11, may indicate inefficient asset use
- WACC at 11.79% limits capital efficiency
- No dividend yield
Veritone Weaknesses
- Negative net margin at -40.36%
- Extremely poor ROE and ROIC, both deeply negative
- High debt-to-equity ratio at 8.91 and 60.54% debt to assets
- Current ratio below 1 at 0.97
- Negative interest coverage ratio at -7.3
- Unfavorable asset turnover at 0.47
- No dividend yield
Palantir demonstrates operational profitability and capital efficiency with diversified revenue and global presence. Veritone faces significant financial strain with negative profitability and high leverage, despite some product diversification. These contrasts highlight Palantir’s strength in financial health and market reach, while Veritone’s challenges may affect strategic flexibility.
The Moat Duel: Analyzing Competitive Defensibility
A structural moat is the only reliable shield protecting long-term profits from relentless competition erosion. Let’s dissect these moats:
Palantir Technologies Inc.: Data Network Effects Powerhouse
Palantir’s moat stems from powerful network effects within its intelligence and enterprise software platforms. High ROIC above WACC confirms strong value creation. Expansion into AI-driven analytics deepens this moat in 2026.
Veritone, Inc.: Emerging AI Capability with Weak Capital Efficiency
Veritone hinges on proprietary AI algorithms but lacks Palantir’s entrenched network. Its declining ROIC and negative EBIT margins expose a fragile moat. Growth depends heavily on successful market penetration and cost control.
Moat Battle: Network Effects vs. AI Innovation Potential
Palantir’s wide and growing moat outclasses Veritone’s shrinking capital efficiency. Palantir is clearly better positioned to defend and expand its market share in 2026.
Which stock offers better returns?
The past year reveals stark contrasts in stock performance and trading activity between Palantir Technologies Inc. and Veritone, Inc., highlighting divergent market sentiment and momentum.
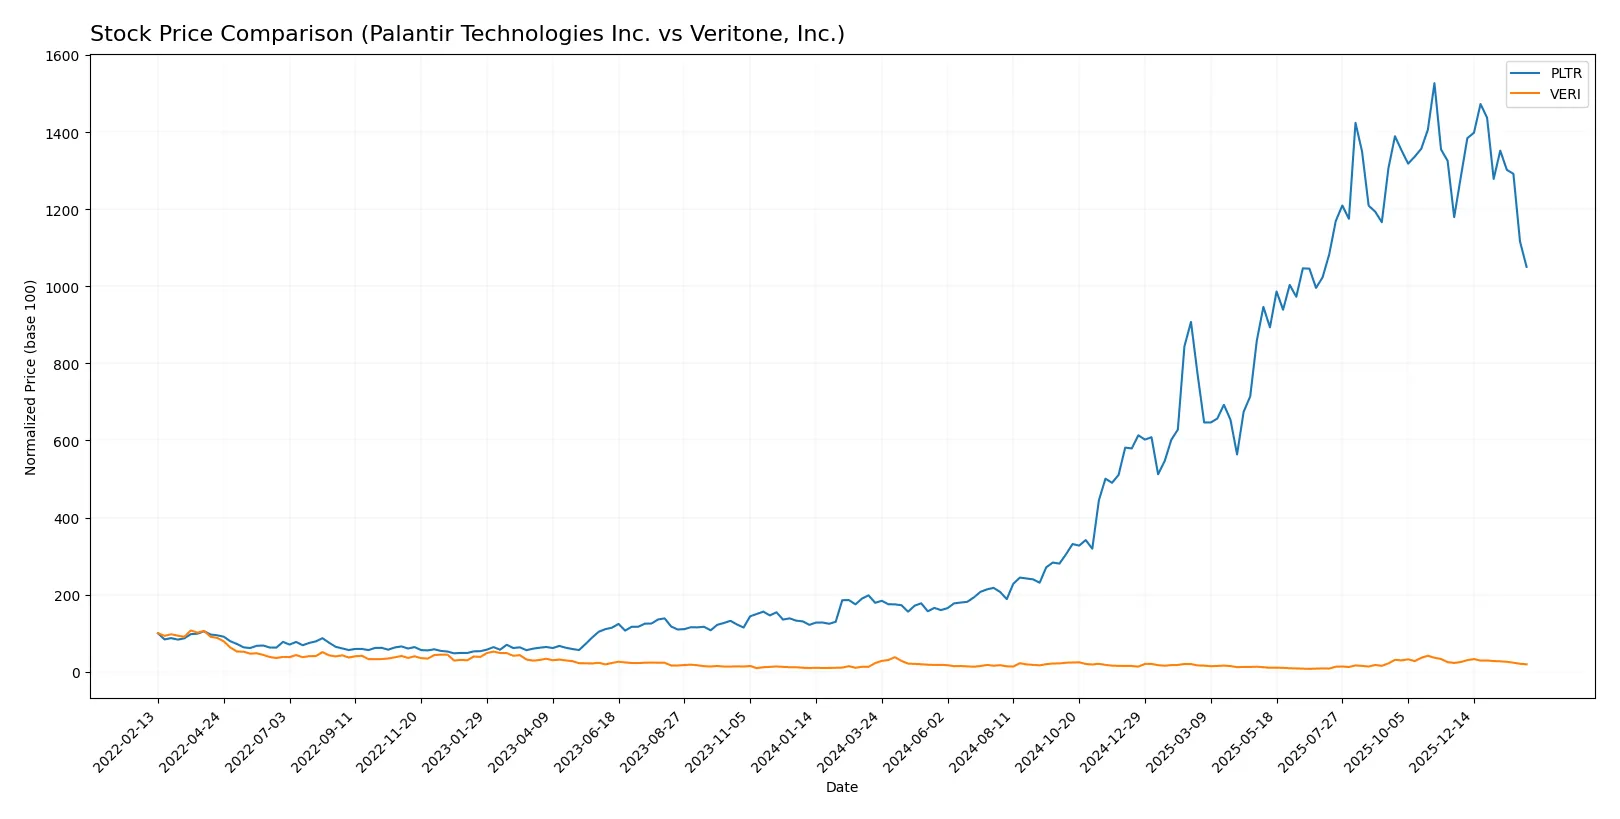
Trend Comparison
Palantir Technologies Inc. exhibits a strong bullish trend with a 487.1% price increase over the past 12 months, despite a recent 10.94% pullback and decelerating momentum. Volatility remains high with a 59.55 standard deviation.
Veritone, Inc. shows a bearish trend, declining 14.05% over the same period, with deceleration in losses. Recent declines accelerated slightly to -15.78%, accompanied by low volatility at 1.25 standard deviation.
Palantir outperforms Veritone significantly, delivering the highest market gains while Veritone struggles with sustained losses and weaker trading dynamics.
Target Prices
Analysts present a clear target consensus for Palantir Technologies Inc. and Veritone, Inc.
| Company | Target Low | Target High | Consensus |
|---|---|---|---|
| Palantir Technologies Inc. | 180 | 230 | 198.8 |
| Veritone, Inc. | 9 | 10 | 9.5 |
The consensus target for Palantir exceeds its current 138 price, signaling upside potential. Veritone’s target prices also suggest substantial appreciation from the current 3.33 level, reflecting bullish analyst expectations.

Don’t Let Luck Decide Your Entry Point
Optimize your entry points with our advanced ProRealTime indicators. You’ll get efficient buy signals with precise price targets for maximum performance. Start outperforming now!
How do institutions grade them?
The institutional grades for Palantir Technologies Inc. and Veritone, Inc. reflect recent analyst views from various firms:
Palantir Technologies Inc. Grades
The following table summarizes recent grades from recognized financial institutions for Palantir:
| Grading Company | Action | New Grade | Date |
|---|---|---|---|
| Citigroup | Maintain | Buy | 2026-02-03 |
| UBS | Maintain | Neutral | 2026-02-03 |
| DA Davidson | Maintain | Neutral | 2026-02-03 |
| Citigroup | Upgrade | Buy | 2026-01-12 |
| Morgan Stanley | Maintain | Equal Weight | 2025-11-04 |
| Piper Sandler | Maintain | Overweight | 2025-11-04 |
| Goldman Sachs | Maintain | Neutral | 2025-11-04 |
| Baird | Maintain | Neutral | 2025-11-04 |
| B of A Securities | Maintain | Buy | 2025-11-04 |
| UBS | Maintain | Neutral | 2025-11-04 |
Veritone, Inc. Grades
The following table presents consistent buy ratings from D. Boral Capital and others for Veritone:
| Grading Company | Action | New Grade | Date |
|---|---|---|---|
| D. Boral Capital | Maintain | Buy | 2026-01-30 |
| D. Boral Capital | Maintain | Buy | 2025-12-09 |
| D. Boral Capital | Maintain | Buy | 2025-12-04 |
| D. Boral Capital | Maintain | Buy | 2025-12-02 |
| Needham | Maintain | Buy | 2025-12-02 |
| D. Boral Capital | Maintain | Buy | 2025-11-07 |
| D. Boral Capital | Maintain | Buy | 2025-10-28 |
| HC Wainwright & Co. | Maintain | Buy | 2025-10-20 |
| D. Boral Capital | Maintain | Buy | 2025-10-15 |
| D. Boral Capital | Maintain | Buy | 2025-09-24 |
Which company has the best grades?
Veritone, Inc. consistently receives buy ratings from multiple firms, indicating stronger analyst conviction. Palantir’s ratings are mixed, ranging from buy to neutral. This divergence may influence investor confidence and portfolio decisions differently.
Risks specific to each company
The following categories identify critical pressure points and systemic threats facing both firms in the 2026 market environment:
1. Market & Competition
Palantir Technologies Inc.
- Dominates in government and intelligence sectors with strong software platforms, but faces intense competition from tech giants and emerging AI firms.
Veritone, Inc.
- Operates in niche AI and media services with limited market share; struggles against larger, better-funded competitors.
2. Capital Structure & Debt
Palantir Technologies Inc.
- Extremely low debt-to-equity ratio (0.03) and low debt-to-assets (2.58%), signaling a very conservative capital structure.
Veritone, Inc.
- High leverage with debt-to-equity at 8.91 and debt-to-assets 60.54%, posing significant financial risk and interest coverage concerns.
3. Stock Volatility
Palantir Technologies Inc.
- Beta of 1.687 indicates above-market volatility but backed by large market cap and liquidity.
Veritone, Inc.
- Higher beta of 2.144 signals more volatile stock, compounded by smaller market cap and lower trading volumes.
4. Regulatory & Legal
Palantir Technologies Inc.
- Faces regulatory scrutiny due to government contracts and data privacy concerns but benefits from long-term relationships.
Veritone, Inc.
- Exposed to media and advertising compliance risks and evolving AI regulations; smaller scale limits influence over regulatory environment.
5. Supply Chain & Operations
Palantir Technologies Inc.
- Operates with scalable software delivery (Palantir Apollo) and strong operational efficiency; risks from tech disruptions remain.
Veritone, Inc.
- Relies on AI model integrations and cloud infrastructure; operational scale and resource constraints increase vulnerability.
6. ESG & Climate Transition
Palantir Technologies Inc.
- Faces pressure to improve ESG disclosures and reduce environmental footprint, especially in government contracting.
Veritone, Inc.
- ESG efforts are nascent; limited resources to address climate transition and social governance risks adequately.
7. Geopolitical Exposure
Palantir Technologies Inc.
- Significant exposure to US and allied government contracts introduces risks from geopolitical tensions and policy shifts.
Veritone, Inc.
- Primarily US and UK markets; geopolitical risks less pronounced but vulnerable to international data and trade policies.
Which company shows a better risk-adjusted profile?
Palantir’s strongest risk is geopolitical exposure due to its government reliance. Veritone’s critical risk lies in its capital structure and weak financial stability. Palantir’s conservative leverage, strong Altman Z-score (135.1), and robust profitability create a far better risk-adjusted profile. Veritone’s distress-zone Altman Z-score (-0.2) and high debt levels raise red flags. Recent data show Palantir’s stable liquidity contrasts sharply with Veritone’s financial distress, justifying heightened caution for Veritone investors.
Final Verdict: Which stock to choose?
Palantir Technologies Inc. boasts a distinct superpower in its ability to generate strong and growing returns on invested capital, signaling a sustainable competitive advantage. Its high valuation multiples and elevated current ratio warrant caution. Palantir suits investors targeting aggressive growth with a tolerance for premium pricing.
Veritone, Inc. offers a strategic moat rooted in its niche AI software solutions, yet it struggles with value destruction and financial instability. Relative to Palantir, Veritone presents a riskier profile with weaker profitability and balance sheet metrics. This stock fits a speculative portfolio seeking potential turnaround upside.
If you prioritize durable value creation and proven profitability, Palantir emerges as the compelling choice due to its robust moat and scale. However, if you seek high-risk, early-stage opportunities with possible asymmetric returns, Veritone could offer that speculative play despite its financial challenges. Each scenario demands disciplined risk management aligned with your investment profile.
Disclaimer: Investment carries a risk of loss of initial capital. The past performance is not a reliable indicator of future results. Be sure to understand risks before making an investment decision.
Go Further
I encourage you to read the complete analyses of Palantir Technologies Inc. and Veritone, Inc. to enhance your investment decisions: