Home > Comparison > Technology > PLTR vs VRSK
The strategic rivalry between Palantir Technologies Inc. and Verisk Analytics, Inc. shapes the trajectory of data-driven decision-making across industries. Palantir, a technology powerhouse in software infrastructure, contrasts with Verisk’s diversified industrial model focused on consulting services and predictive analytics. This head-to-head pits cutting-edge platform innovation against established sector expertise. This analysis will reveal which company offers a superior risk-adjusted outlook for diversified portfolios navigating evolving market demands.

Table of contents
Companies Overview
Palantir Technologies and Verisk Analytics stand as pivotal players in data-driven decision-making across sectors.
Palantir Technologies Inc.: Software Infrastructure Powerhouse
Palantir dominates the software infrastructure market by building platforms like Gotham and Foundry that enable intelligence and business data integration. Its revenue stems from government and commercial contracts focused on data analytics and operational planning. In 2026, Palantir sharpens its competitive edge by advancing its AI platform and expanding virtual deployment capabilities.
Verisk Analytics, Inc.: Data Analytics Specialist
Verisk leads in predictive analytics servicing insurance, energy, and financial sectors. Its core revenue comes from providing specialized data models and consulting services that optimize risk assessment and capital allocation. In 2026, Verisk emphasizes machine learning innovations and customized analytics to deepen industry-specific insights and client decision support.
Strategic Collision: Similarities & Divergences
Both companies excel in data analytics but differ in scope—Palantir offers a broad software ecosystem, while Verisk focuses on specialized sector analytics. Their primary battleground is predictive insights for risk and operational efficiency. Palantir’s growth hinges on AI-driven platform expansion, whereas Verisk relies on deep industry expertise, defining contrasting investment profiles in technology versus consulting services.
Income Statement Comparison
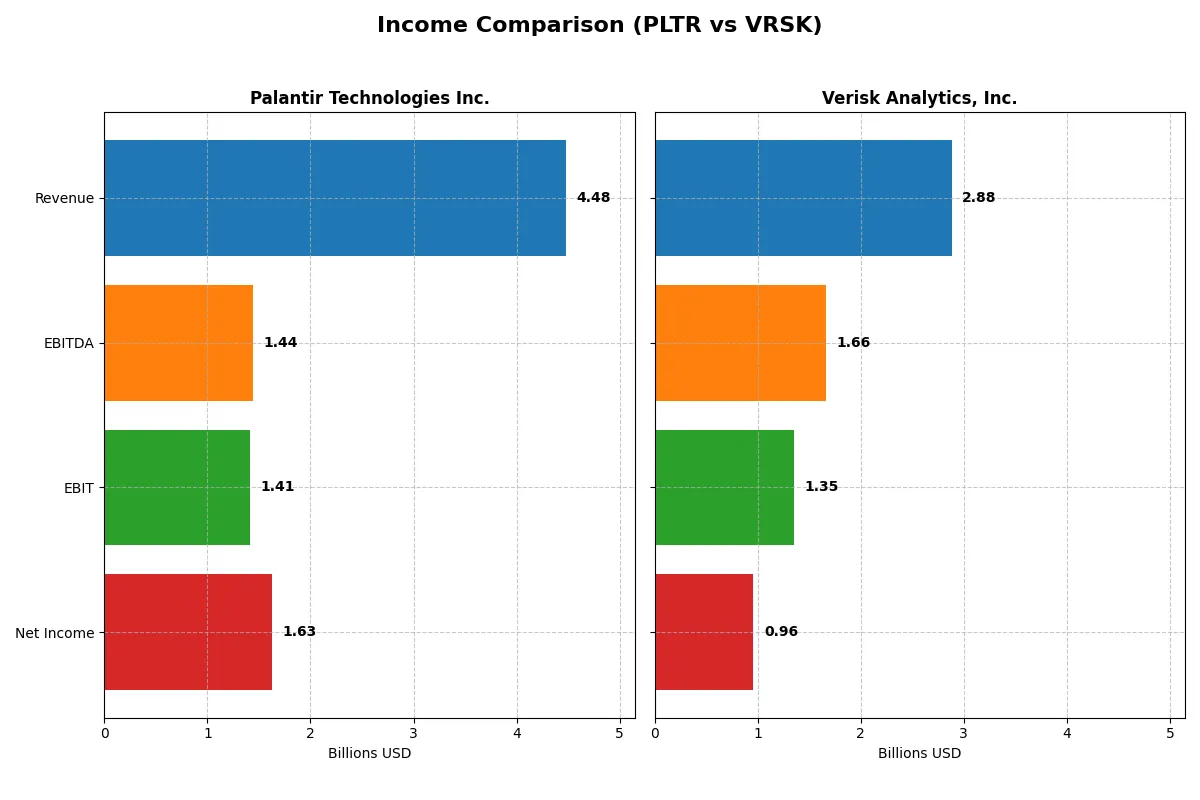
This data dissects the core profitability and scalability of both corporate engines to reveal who dominates the bottom line:
| Metric | Palantir Technologies Inc. (PLTR) | Verisk Analytics, Inc. (VRSK) |
|---|---|---|
| Revenue | 4.48B | 2.88B |
| Cost of Revenue | 789M | 901M |
| Operating Expenses | 2.27B | 727M |
| Gross Profit | 3.69B | 1.98B |
| EBITDA | 1.44B | 1.66B |
| EBIT | 1.41B | 1.35B |
| Interest Expense | 0 | 125M |
| Net Income | 1.63B | 958M |
| EPS | 0.69 | 6.74 |
| Fiscal Year | 2025 | 2024 |
Income Statement Analysis: The Bottom-Line Duel
This income statement comparison reveals which company converts revenue into profit most efficiently and sustains margin strength over time.
Palantir Technologies Inc. Analysis
Palantir grew revenue from $1.54B in 2021 to $4.48B in 2025, driving net income from a $520M loss to $1.63B profit. It sustains an impressive 82.4% gross margin and a 36.3% net margin in 2025, signaling operational efficiency. The sharp 56% revenue surge in 2025 fuels a 355% EBIT growth, highlighting strong momentum.
Verisk Analytics, Inc. Analysis
Verisk’s revenue rose steadily from $2.27B in 2020 to $2.88B in 2024, with net income climbing from $713M to $958M. It maintains a solid 68.7% gross margin and a 33.2% net margin in 2024, reflecting healthy profitability. Revenue growth slowed to 7.5% in 2024, but EBIT grew 18%, showing stable but moderate operational progress.
Verdict: High-Growth Scale vs. Steady Profitability
Palantir outpaces Verisk in revenue and net income growth, boasting superior margins and accelerating earnings momentum. Verisk delivers consistent profitability with less volatility but slower growth. Investors favoring rapid expansion and margin leverage will find Palantir’s profile more compelling, while Verisk suits those seeking steady income streams.
Financial Ratios Comparison
These vital ratios act as a diagnostic tool to expose underlying fiscal health, valuation premiums, and capital efficiency for a clear company comparison:
| Ratios | Palantir Technologies Inc. (PLTR) | Verisk Analytics, Inc. (VRSK) |
|---|---|---|
| ROE | 22.0% | 956.5% |
| ROIC | 17.9% | 27.2% |
| P/E | 259.2 | 40.9 |
| P/B | 57.0 | 391.1 |
| Current Ratio | 7.11 | 0.74 |
| Quick Ratio | 7.11 | 0.74 |
| D/E | 0.03 | 32.43 |
| Debt-to-Assets | 2.6% | 76.1% |
| Interest Coverage | 0 | 10.1 |
| Asset Turnover | 0.50 | 0.68 |
| Fixed Asset Turnover | 17.76 | 3.78 |
| Payout ratio | 0% | 23.1% |
| Dividend yield | 0% | 0.57% |
| Fiscal Year | 2025 | 2024 |
Efficiency & Valuation Duel: The Vital Signs
Ratios serve as a company’s financial DNA, exposing operational strengths and hidden risks essential for informed investing.
Palantir Technologies Inc. (PLTR)
Palantir posts a strong 22% ROE and a healthy 36.3% net margin, signaling solid profitability. However, its P/E ratio of 259 and P/B of 57 reveal a stretched valuation. The firm pays no dividends but reinvests heavily in R&D, supporting long-term growth and operational efficiency.
Verisk Analytics, Inc. (VRSK)
Verisk delivers an impressive 956.5% ROE and a robust 33.2% net margin, showcasing exceptional profitability. Its P/E of 40.9 and P/B at 391 appear expensive relative to industry norms. Despite a modest 0.57% dividend yield, its high leverage and weaker liquidity ratios highlight some financial risks.
Premium Valuation vs. Operational Safety
Palantir’s valuation is significantly stretched but backed by favorable profitability and strong reinvestment strategies. Verisk offers higher returns but carries leverage and liquidity concerns. Investors seeking growth may prefer Palantir’s profile; those favoring income and stability might consider Verisk’s risk-reward balance.
Which one offers the Superior Shareholder Reward?
Palantir (PLTR) pays no dividends and directs ample free cash flow (0.89/share) into R&D and growth, signaling a strong reinvestment strategy. Verisk (VRSK) offers a 0.56% dividend yield with a modest 23% payout ratio and consistent buybacks, enhancing total returns. Verisk’s dividend and buyback model appears more sustainable in 2026, supporting steady income plus capital appreciation. Palantir’s elevated valuation multiples (P/E > 250) and zero payout pose higher risk despite growth potential. I consider Verisk the superior choice for balanced shareholder reward and lower risk in 2026.
Comparative Score Analysis: The Strategic Profile
The radar chart reveals the core financial DNA and trade-offs of Palantir Technologies and Verisk Analytics, highlighting each firm’s strategic strengths:
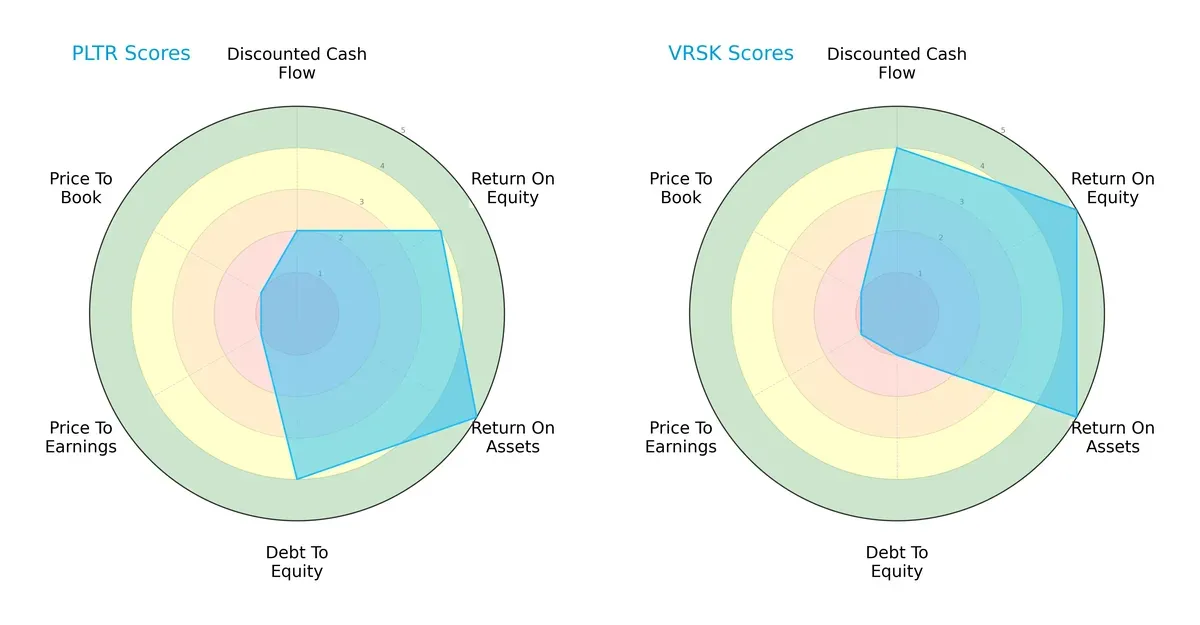
Palantir shows strength in asset efficiency (ROA 5) and manageable leverage (Debt/Equity 4). Verisk excels in cash flow valuation (DCF 4) and equity returns (ROE 5), but carries higher financial risk (Debt/Equity 1). Palantir’s profile is more balanced across capital structure, while Verisk relies heavily on operational profitability.
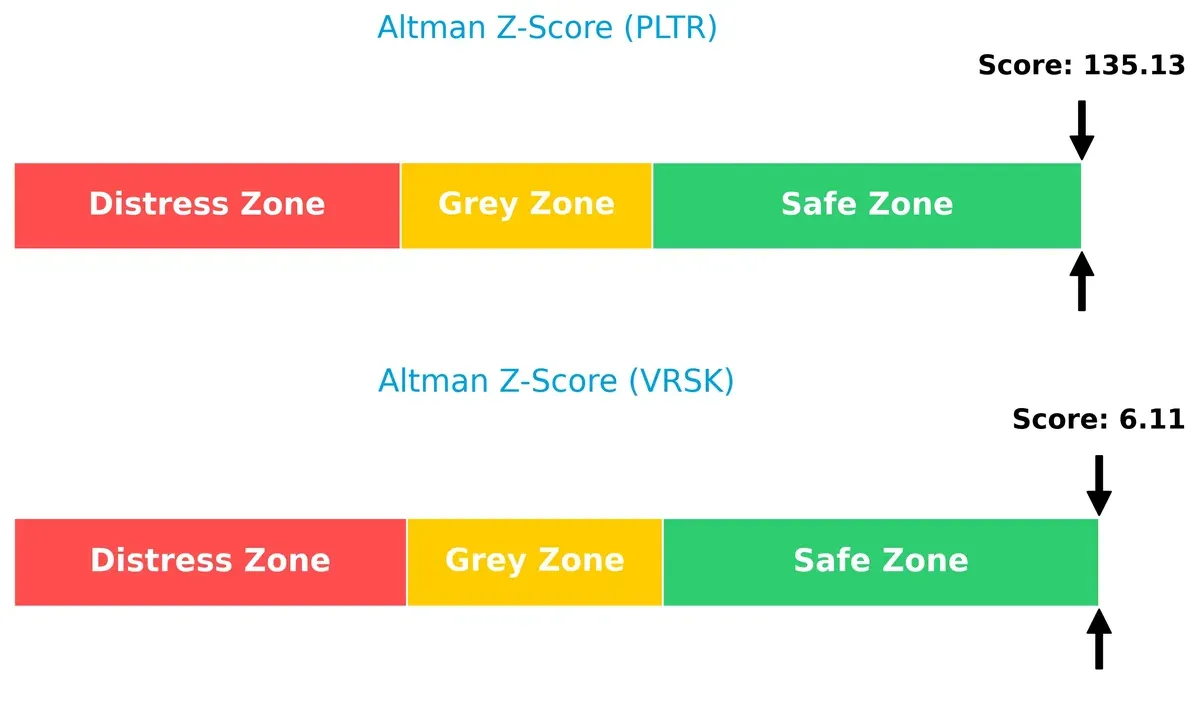
Bankruptcy Risk: Solvency Showdown
Verisk’s Altman Z-Score of 6.1 versus Palantir’s 135 places both well in the safe zone, implying robust solvency and survival odds in this cycle:
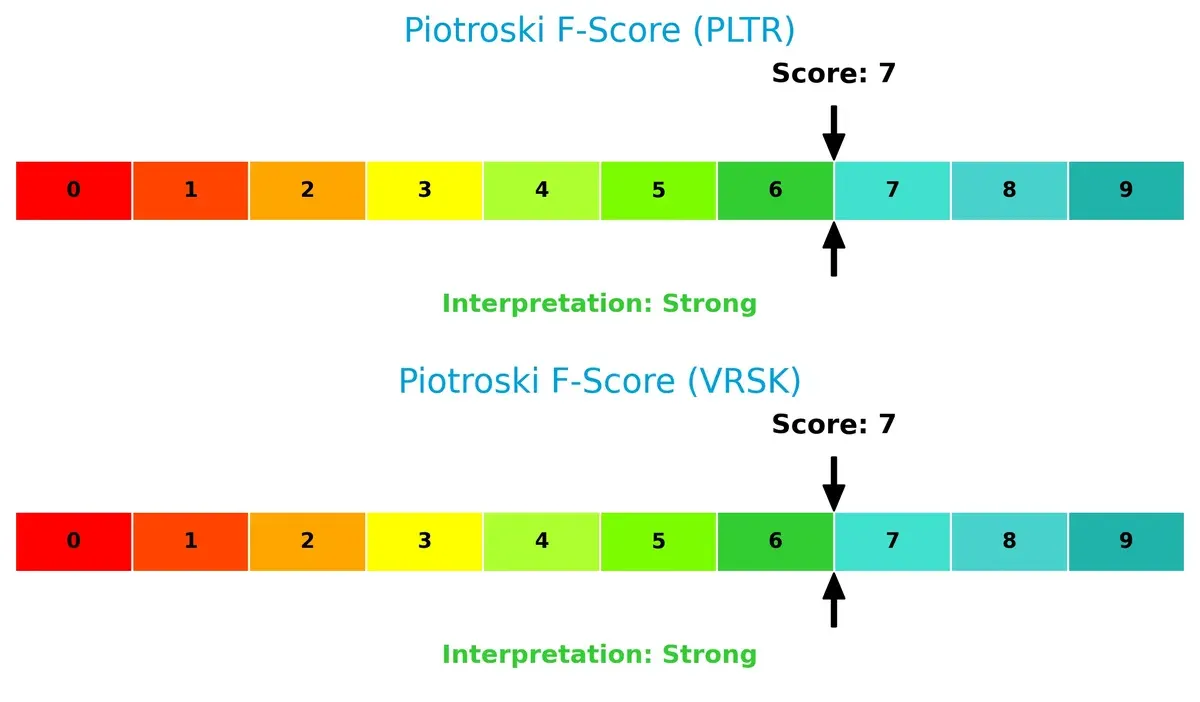
Financial Health: Quality of Operations
Both firms score a strong 7 on the Piotroski F-Score, signaling solid financial health without red flags in profitability, leverage, or efficiency metrics:
How are the two companies positioned?
This section dissects Palantir and Verisk’s operational DNA by comparing revenue distribution by segment and internal strengths and weaknesses. The goal is to confront their economic moats and pinpoint which model offers the most resilient, sustainable competitive advantage today.
Revenue Segmentation: The Strategic Mix
This visual comparison dissects how Palantir Technologies Inc. and Verisk Analytics, Inc. diversify their income streams and highlights their primary sector bets for investors to consider:
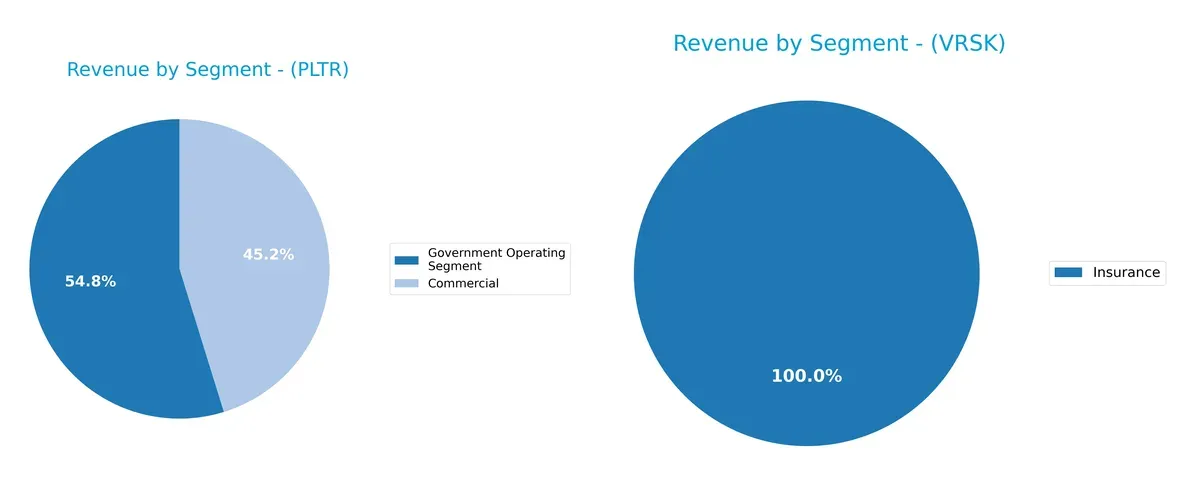
Palantir anchors revenue in two segments: Government Operating Segment at $1.57B and Commercial at $1.30B, showing a balanced mix. Verisk, however, dwarfs all with a dominant $2.88B Insurance segment, revealing concentration risk despite smaller specialized markets. Palantir’s dual-segment focus signals strategic ecosystem lock-in with government and commercial clients. Verisk leans on insurance dominance, implying infrastructure strength but vulnerability to sector-specific downturns.
Strengths and Weaknesses Comparison
This table compares the Strengths and Weaknesses of Palantir Technologies Inc. (PLTR) and Verisk Analytics, Inc. (VRSK):
PLTR Strengths
- High net margin of 36.31%
- ROE at 22.0% indicates efficient equity use
- ROIC of 17.95% exceeds WACC of 11.79%
- Very low debt-to-assets at 2.58%
- Strong quick ratio at 7.11
- Significant government and commercial revenue diversification
VRSK Strengths
- Exceptional ROE at 956.54%
- ROIC of 27.21% well above WACC of 7.13%
- Solid net margin at 33.23%
- Good interest coverage at 10.86
- Diversified revenue across insurance and specialized markets
- Large U.S. market presence with $2.39B revenue
PLTR Weaknesses
- Unfavorable high P/E of 259.19 and P/B of 57.02
- Very high current ratio of 7.11 may indicate inefficient asset use
- WACC at 11.79% is high relative to peers
- Zero dividend yield limits income appeal
- Asset turnover moderate at 0.5
VRSK Weaknesses
- High debt-to-assets at 76.11% and D/E of 32.43% pose leverage risks
- Current and quick ratios low at 0.74 indicate liquidity concerns
- Unfavorable P/B of 391.15
- Dividend yield low at 0.57%
- Asset turnover moderate at 0.68
Both companies show strong profitability and capital returns, yet PLTR leverages low debt and government contracts while VRSK relies on heavy leverage and insurance market dominance. Each has liquidity and valuation risks that may influence strategic priorities.
The Moat Duel: Analyzing Competitive Defensibility
A structural moat is the only reliable shield protecting long-term profits from relentless competitive pressure. Let’s dissect how each company defends its turf:
Palantir Technologies Inc.: Data Network Effects and Intangible Assets
Palantir’s moat hinges on powerful network effects and proprietary AI platforms, delivering high ROIC (6.16% above WACC) and margin expansion. Its 2026 outlook includes deeper integration of AI capabilities, which could strengthen this moat further.
Verisk Analytics, Inc.: Predictive Analytics and Cost Advantage
Verisk’s moat derives from entrenched predictive analytics and customer switching costs, reflected in a superior ROIC premium (20.08% above WACC) and stable margins. Its steady growth and expansion into new risk domains reinforce its competitive position versus Palantir.
Moat Strength Showdown: Network Effects vs. Predictive Analytics Dominance
Verisk commands a wider moat with a higher ROIC premium and more consistent profitability. While Palantir innovates aggressively, Verisk’s entrenched analytics and cost advantages better shield its market share in 2026.
Which stock offers better returns?
Over the past year, Palantir Technologies Inc. exhibited a strong bullish trend with notable price growth, while Verisk Analytics, Inc. experienced a bearish decline marked by decelerating momentum.
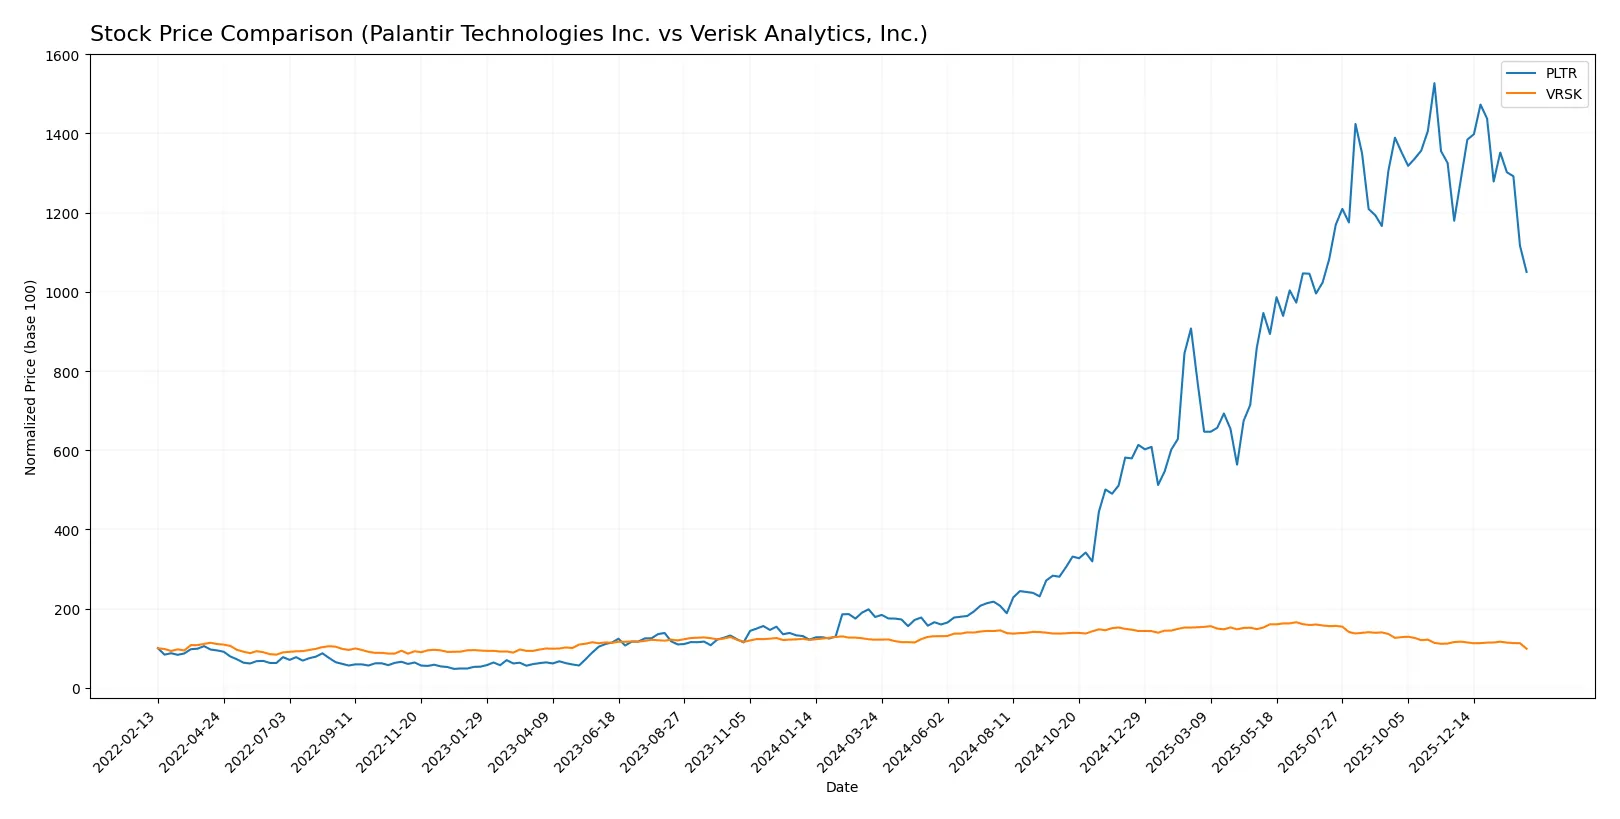
Trend Comparison
Palantir’s stock surged 487.1% over the last 12 months, showing a bullish trend with decelerating acceleration and volatility of 59.55. The price peaked at 200.47 and bottomed at 20.47.
Verisk’s stock fell 18.74% in the same period, reflecting a bearish trend with decelerating momentum and lower volatility of 29.47. Its highest price reached 319.6, lowest was 190.57.
Comparing both, Palantir delivered the strongest market performance with a substantial positive return, while Verisk’s stock declined significantly over the past year.
Target Prices
Analysts present a bullish consensus for Palantir Technologies Inc. and Verisk Analytics, Inc., signaling upside potential from current prices.
| Company | Target Low | Target High | Consensus |
|---|---|---|---|
| Palantir Technologies Inc. | 180 | 230 | 198.8 |
| Verisk Analytics, Inc. | 233 | 334 | 267.67 |
Palantir’s target consensus at 199 implies a 44% upside from its 138 current price, reflecting confidence in its data platforms. Verisk’s 268 consensus suggests a 41% gain potential, underscoring its strong analytics moat and stable cash flows.

Don’t Let Luck Decide Your Entry Point
Optimize your entry points with our advanced ProRealTime indicators. You’ll get efficient buy signals with precise price targets for maximum performance. Start outperforming now!
How do institutions grade them?
This section compares recent institutional grades for Palantir Technologies Inc. and Verisk Analytics, Inc.:
Palantir Technologies Inc. Grades
The following table summarizes Palantir’s latest grades from major grading companies:
| Grading Company | Action | New Grade | Date |
|---|---|---|---|
| Citigroup | Maintain | Buy | 2026-02-03 |
| UBS | Maintain | Neutral | 2026-02-03 |
| DA Davidson | Maintain | Neutral | 2026-02-03 |
| Citigroup | Upgrade | Buy | 2026-01-12 |
| Morgan Stanley | Maintain | Equal Weight | 2025-11-04 |
| Piper Sandler | Maintain | Overweight | 2025-11-04 |
| Goldman Sachs | Maintain | Neutral | 2025-11-04 |
| Baird | Maintain | Neutral | 2025-11-04 |
| B of A Securities | Maintain | Buy | 2025-11-04 |
| UBS | Maintain | Neutral | 2025-11-04 |
Verisk Analytics, Inc. Grades
Below is a summary of Verisk Analytics’ recent institutional grades:
| Grading Company | Action | New Grade | Date |
|---|---|---|---|
| Morgan Stanley | Maintain | Equal Weight | 2025-12-17 |
| Wells Fargo | Maintain | Overweight | 2025-10-30 |
| Barclays | Upgrade | Overweight | 2025-10-30 |
| RBC Capital | Maintain | Outperform | 2025-10-30 |
| Goldman Sachs | Maintain | Neutral | 2025-10-30 |
| JP Morgan | Maintain | Overweight | 2025-10-30 |
| Evercore ISI Group | Maintain | In Line | 2025-10-30 |
| Rothschild & Co | Downgrade | Sell | 2025-10-16 |
| Evercore ISI Group | Maintain | In Line | 2025-10-14 |
| Wells Fargo | Maintain | Overweight | 2025-09-17 |
Which company has the best grades?
Palantir holds a mix of Buy and Neutral grades, with several Buy ratings from Citigroup and B of A Securities. Verisk shows more Overweight and Outperform ratings but also includes a Sell downgrade. Overall, Verisk’s grades display broader institutional confidence, potentially attracting investors seeking steadier outlooks.
Risks specific to each company
The following categories identify the critical pressure points and systemic threats facing both firms in the 2026 market environment:
1. Market & Competition
Palantir Technologies Inc.
- Operates in highly competitive software infrastructure sector with rapid innovation cycles.
Verisk Analytics, Inc.
- Faces strong competition in consulting and data analytics, with pressure from tech advances and new entrants.
2. Capital Structure & Debt
Palantir Technologies Inc.
- Very low debt-to-equity (0.03) signals strong balance sheet and limited financial risk.
Verisk Analytics, Inc.
- High debt-to-equity (32.43) and debt-to-assets (76.11%) increase leverage risk and interest burden.
3. Stock Volatility
Palantir Technologies Inc.
- High beta of 1.687 indicates significant stock price volatility relative to the market.
Verisk Analytics, Inc.
- Lower beta of 0.804 suggests more stable stock price with less market sensitivity.
4. Regulatory & Legal
Palantir Technologies Inc.
- Heavy reliance on government contracts exposes it to regulatory scrutiny and contract risks.
Verisk Analytics, Inc.
- Operates in regulated insurance and financial services sectors, facing compliance and legal risks.
5. Supply Chain & Operations
Palantir Technologies Inc.
- Software delivery model limits traditional supply chain risks but depends on technology infrastructure.
Verisk Analytics, Inc.
- Operational complexity across insurance, energy, and financial segments increases operational risk.
6. ESG & Climate Transition
Palantir Technologies Inc.
- Limited direct exposure but must manage data privacy and ethical AI concerns in ESG frameworks.
Verisk Analytics, Inc.
- Faces pressure to provide analytics supporting climate risk and transition amid evolving ESG standards.
7. Geopolitical Exposure
Palantir Technologies Inc.
- Global intelligence contracts expose it to geopolitical tensions and export control risks.
Verisk Analytics, Inc.
- International operations subject to geopolitical shifts impacting data regulation and market access.
Which company shows a better risk-adjusted profile?
Palantir’s main risk is its high stock volatility and dependence on government contracts. Verisk is most challenged by its elevated financial leverage and operational complexity. Palantir’s strong balance sheet and safer debt profile give it a better risk-adjusted profile despite volatility. Recent data show Verisk’s high debt levels and weak liquidity ratios justify caution.
Final Verdict: Which stock to choose?
Palantir Technologies Inc. shines as a cash-generating powerhouse with rapidly improving profitability and a very favorable moat. Its exceptional efficiency and rising returns suggest strong value creation. A point of vigilance remains its sky-high valuation multiples, which could challenge patient investors. It fits well in an Aggressive Growth portfolio.
Verisk Analytics, Inc. commands a durable strategic moat grounded in consistent, high returns on invested capital and steady profitability. Despite a heavier debt load and a slightly unfavorable liquidity position, its reliable cash flows offer better stability than Palantir. It appeals to investors seeking GARP—Growth at a Reasonable Price.
If you prioritize high-growth potential and can tolerate valuation risk, Palantir outshines with its accelerating earnings and expanding moat. However, if you seek better financial stability and a more conservative risk profile, Verisk offers superior capital efficiency and steadier returns. Each suits distinct investor appetites within the tech and analytics space.
Disclaimer: Investment carries a risk of loss of initial capital. The past performance is not a reliable indicator of future results. Be sure to understand risks before making an investment decision.
Go Further
I encourage you to read the complete analyses of Palantir Technologies Inc. and Verisk Analytics, Inc. to enhance your investment decisions: