Home > Comparison > Technology > PLTR vs VRSN
The strategic rivalry between Palantir Technologies Inc. and VeriSign, Inc. shapes the evolution of the software infrastructure sector. Palantir operates as a data analytics powerhouse, focusing on complex, AI-driven platforms, while VeriSign specializes in domain registry and internet security services with a stable, recurring revenue base. This analysis explores their divergent operational models to determine which company offers a superior risk-adjusted return for a diversified portfolio in today’s technology landscape.
Table of contents
Companies Overview
Palantir Technologies Inc. and VeriSign, Inc. both play pivotal roles in the technology infrastructure sector with distinct market footprints.
Palantir Technologies Inc.: Data-Driven Intelligence Powerhouse
Palantir dominates the software infrastructure space by providing advanced data analytics platforms primarily for intelligence and government agencies. Its core revenue engine revolves around Palantir Gotham and Foundry, which integrate and analyze complex datasets for actionable insights. In 2026, Palantir focuses on expanding its AI capabilities through the Palantir Artificial Intelligence Platform to transform data into decision-making tools.
VeriSign, Inc.: Guardian of Internet Stability
VeriSign secures the backbone of internet navigation by managing critical domain name registries like .com and .net. Its competitive advantage lies in operating root zone maintainer services and authoritative domain resolutions that enable global e-commerce reliability. In 2026, VeriSign emphasizes maintaining internet infrastructure security and resiliency, ensuring uninterrupted domain services worldwide.
Strategic Collision: Similarities & Divergences
Both companies anchor the technology infrastructure sector but diverge sharply in approach. Palantir embraces a data-centric, AI-driven platform model, while VeriSign operates a closed, security-focused domain registry system. They battle indirectly by competing for trust and dominance in digital ecosystems—Palantir in data intelligence, VeriSign in internet stability. Their distinct investment profiles reflect Palantir’s growth-oriented innovation versus VeriSign’s defensive, cash-generative moat.
Income Statement Comparison
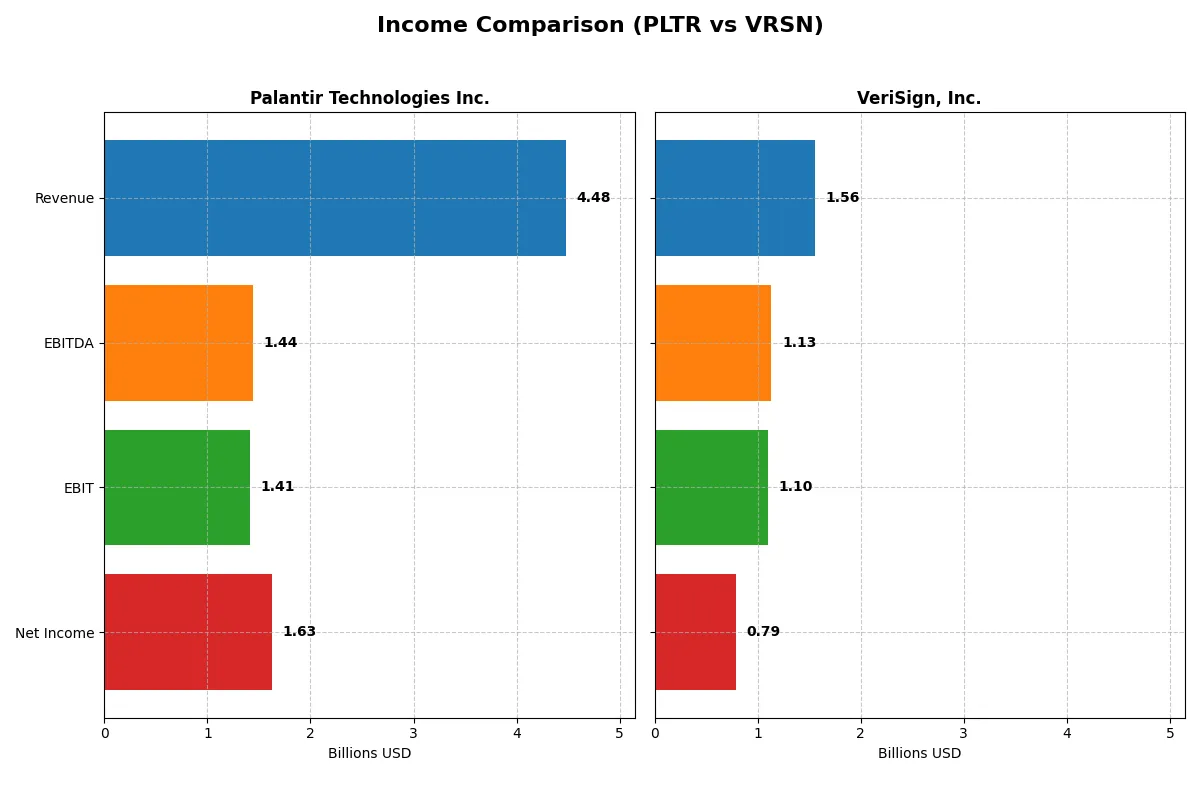
This data dissects the core profitability and scalability of both corporate engines to reveal who dominates the bottom line:
| Metric | Palantir Technologies Inc. (PLTR) | VeriSign, Inc. (VRSN) |
|---|---|---|
| Revenue | 4.48B | 1.56B |
| Cost of Revenue | 789M | 191M |
| Operating Expenses | 2.27B | 308M |
| Gross Profit | 3.69B | 1.37B |
| EBITDA | 1.44B | 1.13B |
| EBIT | 1.41B | 1.10B |
| Interest Expense | 0 | 75M |
| Net Income | 1.63B | 786M |
| EPS | 0.69 | 8.01 |
| Fiscal Year | 2025 | 2024 |
Income Statement Analysis: The Bottom-Line Duel
The upcoming income statement comparison reveals which company operates with superior efficiency and profitability in their core business engines.
Palantir Technologies Inc. Analysis
Palantir demonstrates rapid revenue growth from 1.54B in 2021 to 4.48B in 2025, with net income surging from a loss of 520M to a robust 1.63B. Its gross margin consistently exceeds 82%, and the net margin climbs to 36.3%, reflecting expanding profitability and operational leverage in 2025. Palantir’s momentum is clear with a 56% one-year revenue growth and a 231% EPS increase, signaling accelerating efficiency.
VeriSign, Inc. Analysis
VeriSign posts steady revenue growth, rising modestly from 1.27B in 2020 to 1.56B in 2024, while net income slightly declined overall, closing at 786M in 2024 from 815M in 2020. It maintains a pristine gross margin near 88% and an impressive 50.4% net margin in 2024. However, its one-year net margin dropped by nearly 8%, highlighting some pressure on profitability despite stable top-line growth.
Margin Dominance vs. Growth Surge
Palantir leads with explosive revenue and net income growth, paired with strong margin expansion. VeriSign excels in margin dominance but shows restrained revenue acceleration and some net margin contraction. For investors, Palantir’s high-growth, improving margin profile offers a dynamic opportunity, while VeriSign presents a stable, margin-rich but slower-growth profile.
Financial Ratios Comparison
These vital ratios act as a diagnostic tool to expose the underlying fiscal health, valuation premiums, and capital efficiency of the companies compared below:
| Ratios | Palantir Technologies Inc. (PLTR) | VeriSign, Inc. (VRSN) |
|---|---|---|
| ROE | 22.0% | -40.1% |
| ROIC | 17.9% | 451.0% |
| P/E | 259.2 | 25.8 |
| P/B | 57.0 | -10.4 |
| Current Ratio | 7.11 | 0.43 |
| Quick Ratio | 7.11 | 0.43 |
| D/E | 0.031 | -0.92 |
| Debt-to-Assets | 2.6% | 128.1% |
| Interest Coverage | 0 | 14.1 |
| Asset Turnover | 0.50 | 1.11 |
| Fixed Asset Turnover | 17.8 | 6.66 |
| Payout ratio | 0 | 0 |
| Dividend yield | 0 | 0 |
| Fiscal Year | 2025 | 2024 |
Efficiency & Valuation Duel: The Vital Signs
Financial ratios act as a company’s DNA, unveiling hidden risks and operational strengths essential for investment decisions.
Palantir Technologies Inc.
Palantir displays strong profitability with a 22% ROE and 36.3% net margin, signaling operational excellence. However, its valuation metrics—P/E at 259 and P/B at 57—indicate a highly stretched stock price. The absence of dividends suggests Palantir reinvests aggressively in R&D, fueling growth and innovation.
VeriSign, Inc.
VeriSign reports a robust 50.45% net margin and an exceptional 451% ROIC, underscoring efficient capital use. Its P/E of 25.8 appears reasonable compared to Palantir’s, but a negative P/B and weak current ratio reveal balance sheet concerns. VeriSign returns no dividends, focusing instead on steady free cash flow generation.
Premium Valuation vs. Operational Safety
Palantir’s superior profitability comes at a steep valuation premium, exposing investors to elevated risk. VeriSign offers a more balanced risk-reward profile with strong cash flow and operational efficiency despite some liquidity red flags. Growth-focused investors may prefer Palantir’s innovation, while risk-averse profiles might lean toward VeriSign’s steadier fundamentals.
Which one offers the Superior Shareholder Reward?
Palantir Technologies (PLTR) opts for zero dividends, reinvesting nearly all free cash flow into R&D and growth. VeriSign (VRSN) also pays no dividends but maintains a modest buyback program with free cash flow yield near 4%. PLTR’s buybacks are minimal, reflecting a growth-first distribution philosophy. VRSN’s strong margins and steady free cash flow enable sustainable, albeit conservative, shareholder returns through buybacks. PLTR’s huge price multiples signal high growth expectations but raise valuation risk. I find VRSN’s balanced buyback strategy and robust cash flow a more reliable path to shareholder reward in 2026.
Comparative Score Analysis: The Strategic Profile
The radar chart reveals the fundamental DNA and trade-offs of Palantir Technologies Inc. and VeriSign, Inc., highlighting their financial strengths and vulnerabilities:
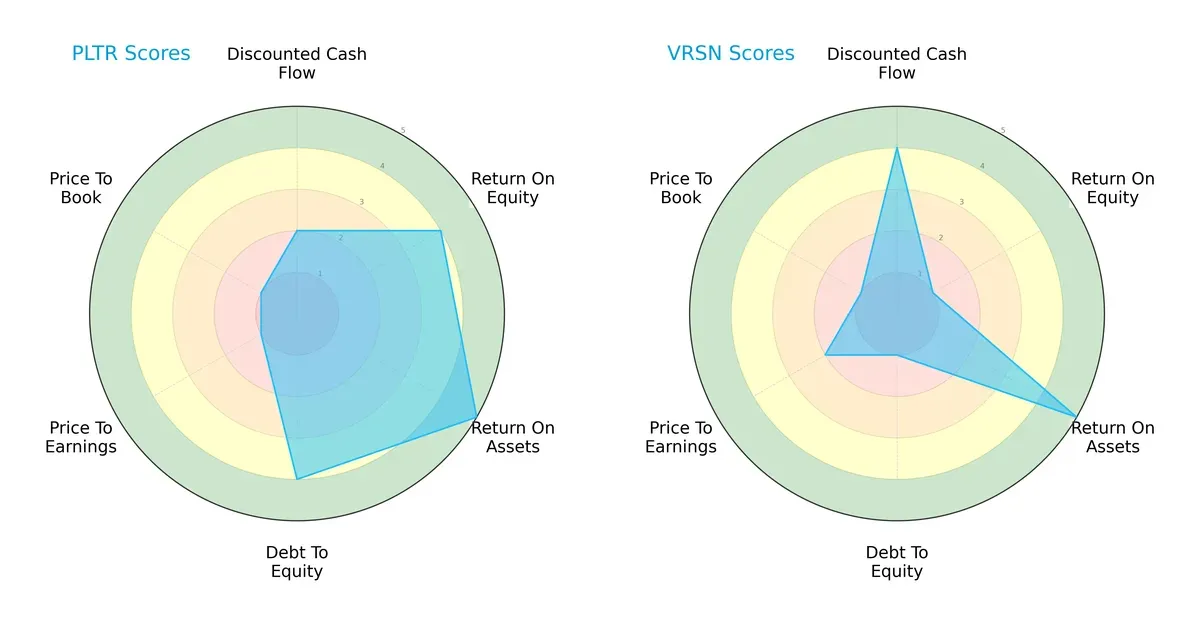
Palantir shows a balanced profile with solid ROE (4) and ROA (5) scores, and a strong debt-to-equity position (4). VeriSign excels in discounted cash flow (4) and ROA (5) but suffers from weak ROE (1) and high leverage (debt-to-equity score 1). Palantir relies on operational efficiency, while VeriSign depends on cash flow strength despite financial risk.
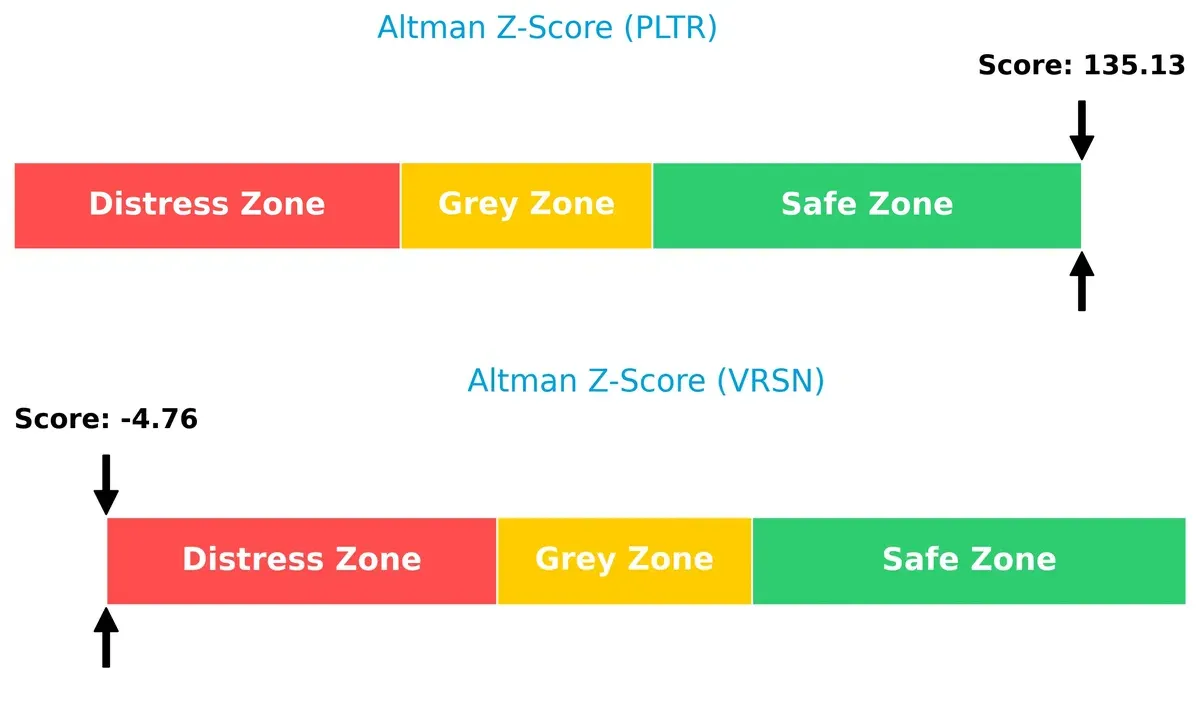
Bankruptcy Risk: Solvency Showdown
Palantir’s Altman Z-Score of 135 places it comfortably in the safe zone, signaling robust financial stability. VeriSign’s negative score of -4.76 flags serious distress and elevated bankruptcy risk in this cycle:
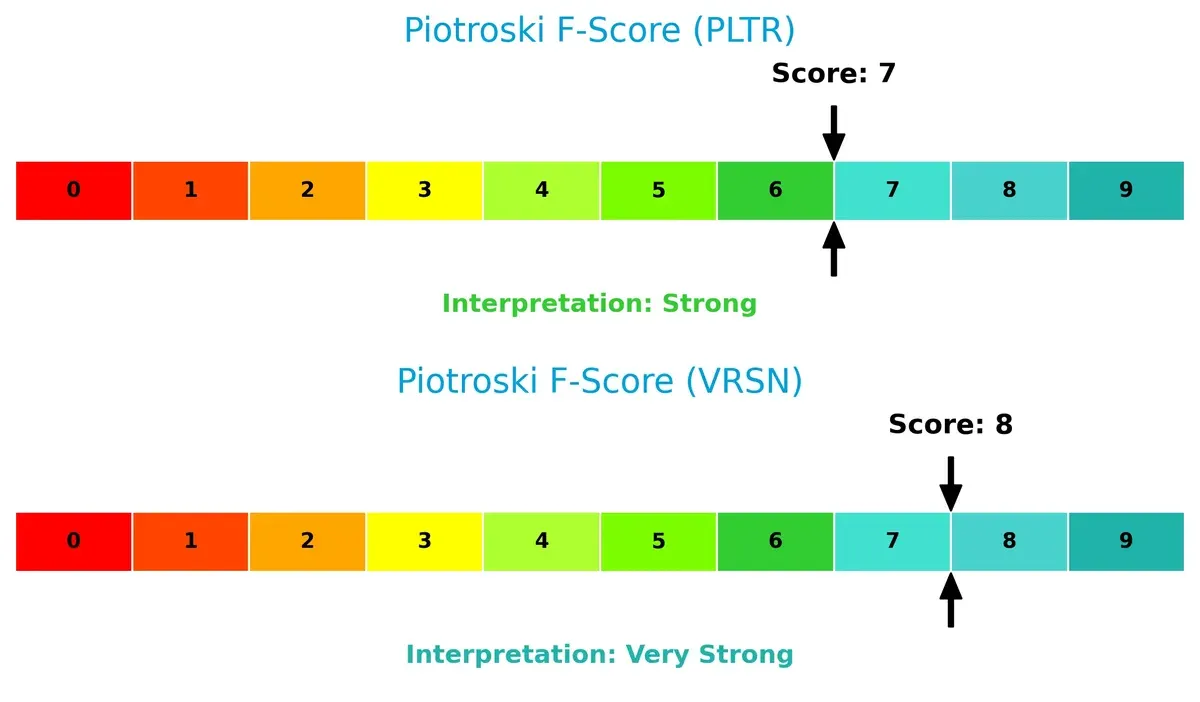
Financial Health: Quality of Operations
VeriSign’s Piotroski F-Score of 8 indicates very strong financial health, marginally outperforming Palantir’s strong 7. Both companies display solid internal metrics, but VeriSign edges ahead in operational quality:
How are the two companies positioned?
This section dissects Palantir and VeriSign’s operational DNA by comparing their revenue distribution and internal strengths and weaknesses. The goal is to confront their economic moats to reveal which business model delivers the most resilient, sustainable competitive advantage today.
Revenue Segmentation: The Strategic Mix
This visual comparison dissects how Palantir Technologies and VeriSign diversify their income streams and highlights where their primary sector bets lie:
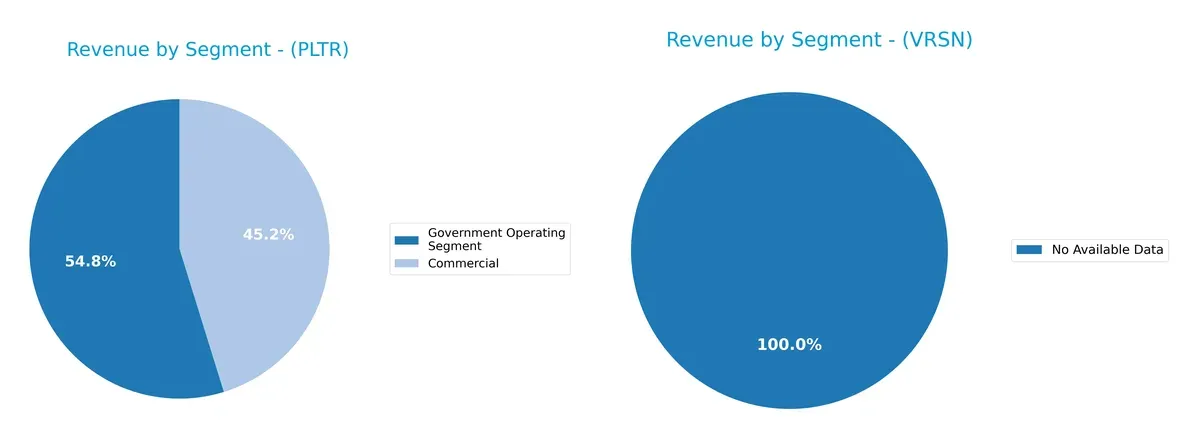
Palantir relies heavily on two segments: Government and Commercial. Government revenue anchors at $1.57B in 2024, dwarfing Commercial’s $1.30B but showing balanced growth. VeriSign’s segmentation data is unavailable, preventing direct comparison. Palantir’s split suggests a strategic pivot balancing government contracts—offering stability—and commercial expansion, reducing concentration risk while leveraging ecosystem lock-in in public sector infrastructure.
Strengths and Weaknesses Comparison
This table compares the strengths and weaknesses of Palantir Technologies Inc. and VeriSign, Inc.:
Palantir Strengths
- Strong profitability with 36.3% net margin
- Favorable ROE at 22%
- Low debt levels with 2.58% debt-to-assets
- High fixed asset turnover of 17.76
- Diverse revenue from commercial and government segments
- Expanding global presence with $1.9B US and $660M international revenue
VeriSign Strengths
- Exceptional ROIC at 451% far above WACC
- Highest net margin at 50.45%
- Strong interest coverage at 14.57
- Efficient asset turnover at 1.11
- Significant global revenue beyond US with $425M overseas
- Favorable price-to-book ratio compared to Peers
Palantir Weaknesses
- High valuation multiples: PE 259 and PB 57
- Unfavorable current ratio of 7.11 suggests liquidity concerns
- WACC at 11.79% exceeds ROIC cautioning cost of capital
- No dividend yield limits income appeal
VeriSign Weaknesses
- Negative ROE at -40.13 signals equity profitability issues
- Unfavorable current and quick ratios at 0.43 raise liquidity red flags
- High debt-to-assets at 128% implies leverage risk
- PE of 25.84 considered high for growth expectations
- Zero dividend yield
Palantir demonstrates strengths in profitability and diversified revenue streams but faces valuation and liquidity concerns. VeriSign excels in capital efficiency and global reach yet struggles with equity returns and balance sheet leverage. These contrasts highlight differing strategic challenges and risk profiles.
The Moat Duel: Analyzing Competitive Defensibility
A structural moat is the only true shield guarding long-term profits from relentless competitive pressure and market disruption:
Palantir Technologies Inc.: Data Integration Switching Costs
Palantir’s moat stems from high switching costs embedded in its data integration and analytics platforms. Its 36% net margin reflects deep customer entrenchment. Expanding AI capabilities in 2026 could deepen this advantage.
VeriSign, Inc.: Domain Registry Network Effects
VeriSign’s moat arises from network effects controlling .com and .net domains. With an 87% gross margin and 50% net margin, it wields pricing power unlike Palantir. Growth in new domain services offers moderate expansion potential.
Moat Battle: Switching Costs vs. Network Effects
VeriSign’s dominant network effects create a wider moat through entrenched internet infrastructure. Palantir’s switching costs form a growing, but narrower, moat. VeriSign is better positioned to defend its core market share long term.
Which stock offers better returns?
Over the past year, Palantir Technologies and VeriSign exhibited strong price gains with differing momentum and volume dynamics, highlighting distinct market interest and trading behavior.
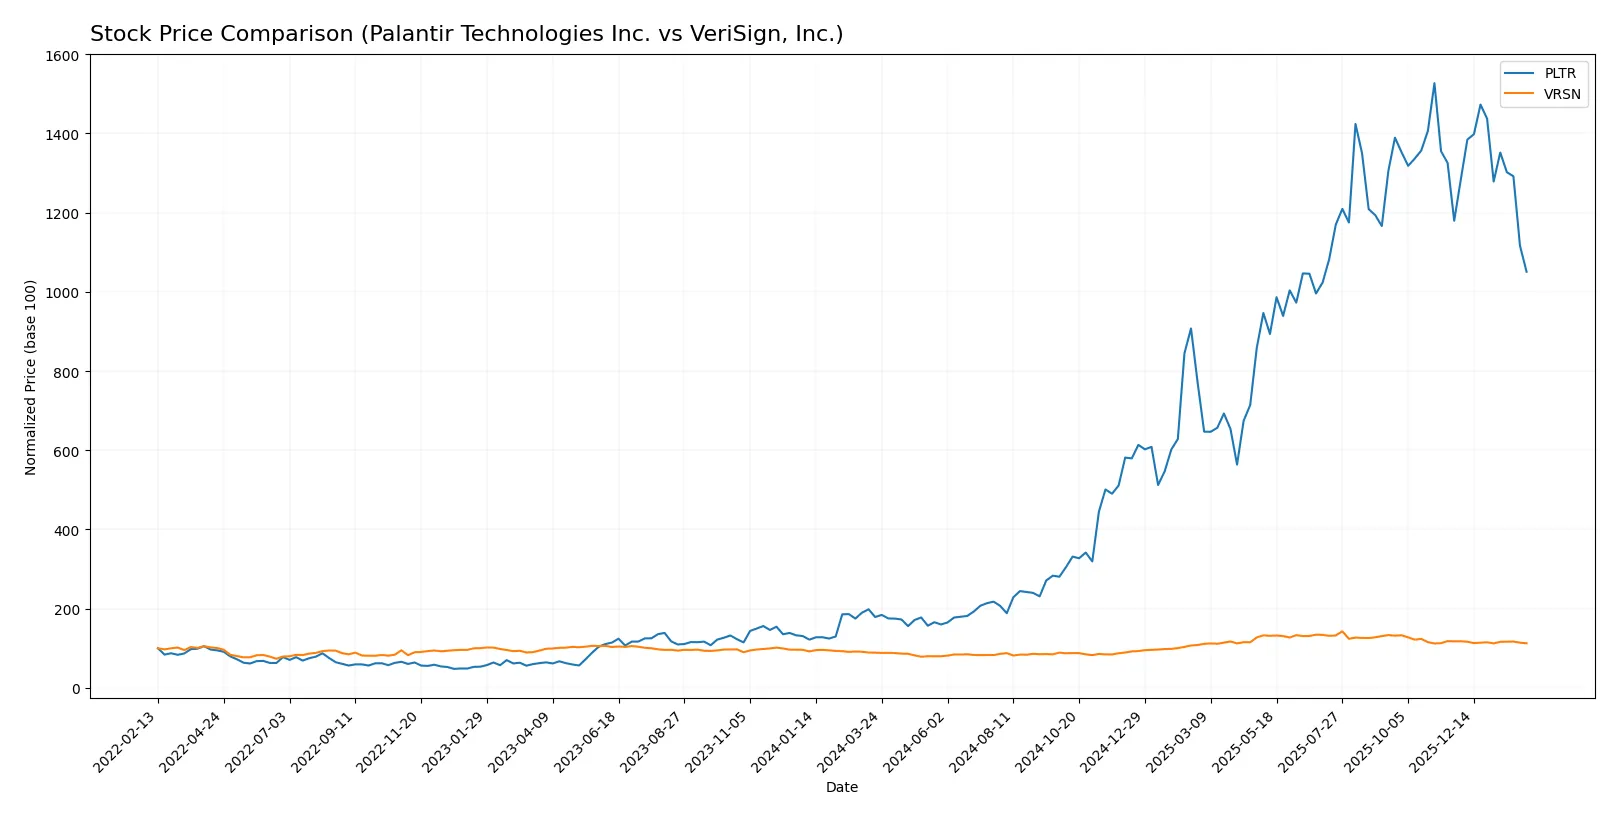
Trend Comparison
Palantir Technologies saw a 487.27% price increase over the last 12 months, marking a bullish trend with decelerating momentum and high volatility. Its price ranged from 20.47 to 200.47 during this period.
VeriSign posted a 26.75% gain over the same period, also bullish but with slowing acceleration and moderate volatility. Its price fluctuated between 168.32 and 305.79.
Palantir’s extraordinary 487% rise outpaced VeriSign’s 27%, delivering substantially higher market performance despite recent short-term declines.
Target Prices
Analysts present a confident target consensus for Palantir Technologies Inc. and VeriSign, Inc.
| Company | Target Low | Target High | Consensus |
|---|---|---|---|
| Palantir Technologies Inc. | 180 | 230 | 198.8 |
| VeriSign, Inc. | 325 | 325 | 325 |
Palantir’s consensus target of 198.8 implies a 43% upside from the current 138.5 price, showing strong growth expectations. VeriSign’s firm target at 325 reflects a 35% premium over its 241.2 price, signaling robust confidence in its market position.

Don’t Let Luck Decide Your Entry Point
Optimize your entry points with our advanced ProRealTime indicators. You’ll get efficient buy signals with precise price targets for maximum performance. Start outperforming now!
How do institutions grade them?
Palantir Technologies Inc. Grades
The following table summarizes recent grades assigned to Palantir by major financial institutions.
| Grading Company | Action | New Grade | Date |
|---|---|---|---|
| Citigroup | Maintain | Buy | 2026-02-03 |
| UBS | Maintain | Neutral | 2026-02-03 |
| DA Davidson | Maintain | Neutral | 2026-02-03 |
| Citigroup | Upgrade | Buy | 2026-01-12 |
| Morgan Stanley | Maintain | Equal Weight | 2025-11-04 |
| Piper Sandler | Maintain | Overweight | 2025-11-04 |
| Goldman Sachs | Maintain | Neutral | 2025-11-04 |
| Baird | Maintain | Neutral | 2025-11-04 |
| B of A Securities | Maintain | Buy | 2025-11-04 |
| UBS | Maintain | Neutral | 2025-11-04 |
VeriSign, Inc. Grades
The following table presents recent grade updates for VeriSign from respected grading firms.
| Grading Company | Action | New Grade | Date |
|---|---|---|---|
| JP Morgan | Maintain | Neutral | 2026-01-06 |
| Baird | Maintain | Outperform | 2025-07-01 |
| Baird | Maintain | Outperform | 2025-04-25 |
| Baird | Maintain | Outperform | 2025-04-01 |
| Citigroup | Maintain | Buy | 2025-02-04 |
| Citigroup | Maintain | Buy | 2025-01-03 |
| Baird | Upgrade | Outperform | 2024-12-09 |
| Baird | Maintain | Neutral | 2024-06-27 |
| Baird | Maintain | Neutral | 2024-04-26 |
| Citigroup | Maintain | Buy | 2024-04-02 |
Which company has the best grades?
VeriSign consistently receives “Outperform” and “Buy” ratings, while Palantir’s grades mostly hover between “Buy” and “Neutral.” VeriSign’s stronger consensus grades may signal greater institutional confidence, potentially influencing investor sentiment more positively.
Risks specific to each company
The following categories identify the critical pressure points and systemic threats facing both firms in the 2026 market environment:
1. Market & Competition
Palantir Technologies Inc.
- Faces intense competition in AI-driven software and data analytics. Rapid innovation cycles pressure its market share.
VeriSign, Inc.
- Dominates domain registry but faces limited direct competitors; threat from disruptive internet infrastructure changes exists.
2. Capital Structure & Debt
Palantir Technologies Inc.
- Maintains very low debt levels (D/E 0.03), providing strong financial flexibility.
VeriSign, Inc.
- High debt-to-assets ratio (128%) signals financial leverage risk and potential solvency concerns.
3. Stock Volatility
Palantir Technologies Inc.
- Beta at 1.687 indicates above-market volatility, increasing investment risk amid market downturns.
VeriSign, Inc.
- Beta at 0.753 suggests lower volatility, offering more stability in turbulent markets.
4. Regulatory & Legal
Palantir Technologies Inc.
- Operates in sensitive government and defense sectors, exposing it to regulatory scrutiny and contract risks.
VeriSign, Inc.
- Subject to internet governance and cybersecurity regulations; relatively stable regulatory environment.
5. Supply Chain & Operations
Palantir Technologies Inc.
- Software deployment depends on cloud infrastructure resilience and customer integration complexity.
VeriSign, Inc.
- Relies on stable global internet infrastructure; operational risks from technology disruptions are moderate.
6. ESG & Climate Transition
Palantir Technologies Inc.
- Faces pressure to improve data privacy, security, and ethical AI use amid rising ESG investor demands.
VeriSign, Inc.
- ESG risks focus on data security and internet stability; climate transition impacts are limited.
7. Geopolitical Exposure
Palantir Technologies Inc.
- Significant exposure to U.S. and allied government contracts; geopolitical tensions may disrupt revenue streams.
VeriSign, Inc.
- Less exposed geopolitically but subject to global internet policy shifts and international domain management challenges.
Which company shows a better risk-adjusted profile?
Palantir’s biggest risk lies in market volatility and regulatory scrutiny tied to its government contracts. VeriSign’s critical risk is its precarious capital structure, with excessive leverage threatening financial stability. Despite Palantir’s stock volatility, its robust balance sheet and strong profitability position it better on a risk-adjusted basis. VeriSign’s distress-level Altman Z-score and high debt ratios justify caution.
Final Verdict: Which stock to choose?
Palantir’s superpower lies in its rapidly growing profitability and exceptional capital efficiency, signaling a strong economic moat in a competitive tech landscape. Its high valuation multiples and stretched current ratio serve as points of vigilance. It fits well in aggressive growth portfolios willing to tolerate elevated risk for outsized returns.
VeriSign offers a fortress-like moat with its subscription-based domain name services and robust free cash flow generation. It presents a safer profile compared to Palantir’s volatility, despite some balance sheet concerns. VeriSign suits investors seeking GARP (Growth at a Reasonable Price) with a preference for stability and steady income streams.
If you prioritize rapid expansion and capitalizing on innovation momentum, Palantir is the compelling choice due to its superior ROIC growth and profit acceleration. However, if you seek consistent cash flow and downside protection, VeriSign offers better stability with its entrenched market position and reliable revenue model. Both have merits, but your risk tolerance and investment horizon should guide the analytical scenario.
Disclaimer: Investment carries a risk of loss of initial capital. The past performance is not a reliable indicator of future results. Be sure to understand risks before making an investment decision.
Go Further
I encourage you to read the complete analyses of Palantir Technologies Inc. and VeriSign, Inc. to enhance your investment decisions: