Home > Comparison > Technology > PLTR vs PATH
The strategic rivalry between Palantir Technologies Inc. and UiPath Inc. shapes the evolving landscape of the technology sector. Palantir operates as a data analytics powerhouse, delivering sophisticated software platforms to government and enterprise clients. UiPath, by contrast, leads in robotic process automation with a focus on workflow efficiency across industries. This analysis pits Palantir’s data-driven intelligence against UiPath’s automation scale to identify the superior risk-adjusted opportunity for diversified portfolios.
Table of contents
Companies Overview
Palantir Technologies and UiPath command significant influence in the software infrastructure sector. They shape how enterprises harness data and automation.
Palantir Technologies Inc.: Data-Driven Intelligence Platform
Palantir dominates software infrastructure by enabling intelligence and operational data integration. Its core revenue comes from platforms like Palantir Gotham and Foundry, serving government and commercial clients. In 2026, Palantir focuses on enhancing AI-driven analytics and expanding deployment flexibility across industries, reinforcing its competitive edge in complex data environments.
UiPath Inc.: Automation Pioneer
UiPath leads in robotic process automation (RPA), monetizing through a comprehensive platform that automates enterprise workflows. Its revenue stems from software licenses, professional services, and ongoing support. The 2026 strategy centers on refining AI integration, low-code development, and scaling attended and unattended automation to boost operational efficiency across sectors like banking and healthcare.
Strategic Collision: Similarities & Divergences
Both firms emphasize AI-powered software, but Palantir prioritizes data intelligence and security, while UiPath focuses on workflow automation and user accessibility. They compete primarily in enterprise digital transformation, targeting overlapping but distinct customer needs. Palantir offers a high-complexity, data-centric investment profile; UiPath appeals to those favoring scalable automation solutions.
Income Statement Comparison
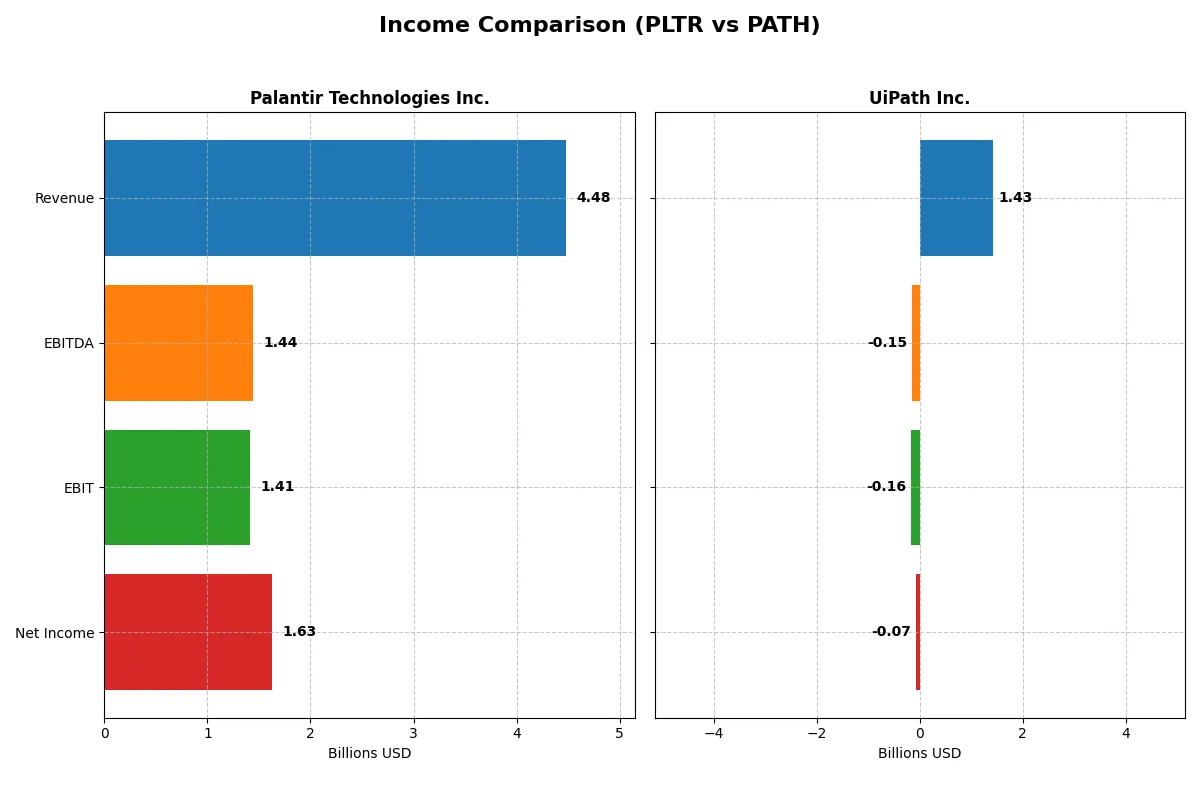
This data dissects the core profitability and scalability of both corporate engines to reveal who dominates the bottom line:
| Metric | Palantir Technologies Inc. (PLTR) | UiPath Inc. (PATH) |
|---|---|---|
| Revenue | 4.48B | 1.43B |
| Cost of Revenue | 789M | 247M |
| Operating Expenses | 2.27B | 1.35B |
| Gross Profit | 3.69B | 1.18B |
| EBITDA | 1.44B | -145M |
| EBIT | 1.41B | -163M |
| Interest Expense | 0 | 0 |
| Net Income | 1.63B | -74M |
| EPS | 0.69 | -0.13 |
| Fiscal Year | 2025 | 2025 |
Income Statement Analysis: The Bottom-Line Duel
This income statement comparison reveals the true efficiency and profitability of each company’s core business engine over recent years.
Palantir Technologies Inc. Analysis
Palantir exhibits a strong revenue surge from $1.54B in 2021 to $4.48B in 2025. Net income follows suit, turning sharply positive at $1.63B in 2025 after years of losses. Gross margin remains robust above 82%, and net margin expands to 36.3%, signaling improving operational leverage and impressive momentum in 2025.
UiPath Inc. Analysis
UiPath grows revenues steadily from $608M in 2021 to $1.43B in 2025, but net losses persist at $74M in 2025 despite narrowing. Gross margin stays high near 83%, yet negative EBIT and net margins indicate ongoing profitability challenges. Modest margin improvements suggest gradual progress but limited operational efficiency.
Margin Dominance vs. Revenue Expansion
Palantir leads with superior margin expansion and a dramatic net income turnaround, outpacing UiPath’s slower top-line growth and lingering losses. For investors prioritizing profitability and margin health, Palantir’s profile offers a clearer fundamental winner. UiPath’s profile suits those focused on steady revenue growth despite ongoing profitability risks.
Financial Ratios Comparison
These vital ratios act as a diagnostic tool to expose the underlying fiscal health, valuation premiums, and capital efficiency of these companies:
| Ratios | Palantir Technologies Inc. (PLTR) | UiPath Inc. (PATH) |
|---|---|---|
| ROE | 22.0% | -4.0% |
| ROIC | 17.9% | -7.4% |
| P/E | 259.2x | -108.0x |
| P/B | 57.0x | 4.3x |
| Current Ratio | 7.11 | 2.93 |
| Quick Ratio | 7.11 | 2.93 |
| D/E | 0.03 | 0.04 |
| Debt-to-Assets | 2.6% | 2.7% |
| Interest Coverage | 0 (not available) | 0 (not available) |
| Asset Turnover | 0.50 | 0.50 |
| Fixed Asset Turnover | 17.8 | 14.4 |
| Payout ratio | 0% | 0% |
| Dividend yield | 0% | 0% |
| Fiscal Year | 2025 | 2025 |
Efficiency & Valuation Duel: The Vital Signs
Financial ratios act as a company’s DNA, exposing operational strengths and hidden risks that influence investment decisions.
Palantir Technologies Inc.
Palantir displays robust profitability with a 22% ROE and a strong 36.3% net margin, signaling operational excellence. However, its valuation is stretched, marked by a P/E of 259.19 and a high P/B of 57.02. The company retains earnings to fuel growth, offering no dividends, reflecting a reinvestment strategy focused on innovation and expansion.
UiPath Inc.
UiPath struggles with negative profitability metrics, including a -3.99% ROE and -5.15% net margin, reflecting ongoing losses. Its valuation appears attractive on P/E (-108.04), but the P/B at 4.31 indicates moderate market expectations. The firm pays no dividends, prioritizing reinvestment in R&D and operational scaling instead of shareholder payouts.
Premium Valuation vs. Operational Safety
Palantir’s ratios reveal superior profitability but a highly stretched valuation, increasing investment risk despite operational strength. UiPath presents weaker profitability and higher losses but trades at more reasonable multiples, reflecting market caution. Investors seeking growth with proven returns may lean toward Palantir, while those favoring value turnaround might consider UiPath’s profile.
Which one offers the Superior Shareholder Reward?
Palantir Technologies (PLTR) and UiPath (PATH) both forgo dividends, focusing on reinvestment and buybacks for shareholder reward. PLTR’s free cash flow per share surged to 0.89 in 2025, enabling modest buybacks amid no payout. PATH’s buyback activity is less intense, with slower free cash flow growth of 0.55 per share. PLTR’s robust operating margins (32% EBIT) and strong cash coverage ratios support sustainable capital returns. PATH’s negative margins and weaker cash flow coverage raise sustainability concerns. I conclude PLTR offers a superior total shareholder return profile in 2026, balancing disciplined reinvestment and share repurchases effectively.
Comparative Score Analysis: The Strategic Profile
The radar chart reveals the fundamental DNA and trade-offs of both Palantir Technologies Inc. and UiPath Inc., highlighting their financial strengths and valuation challenges:
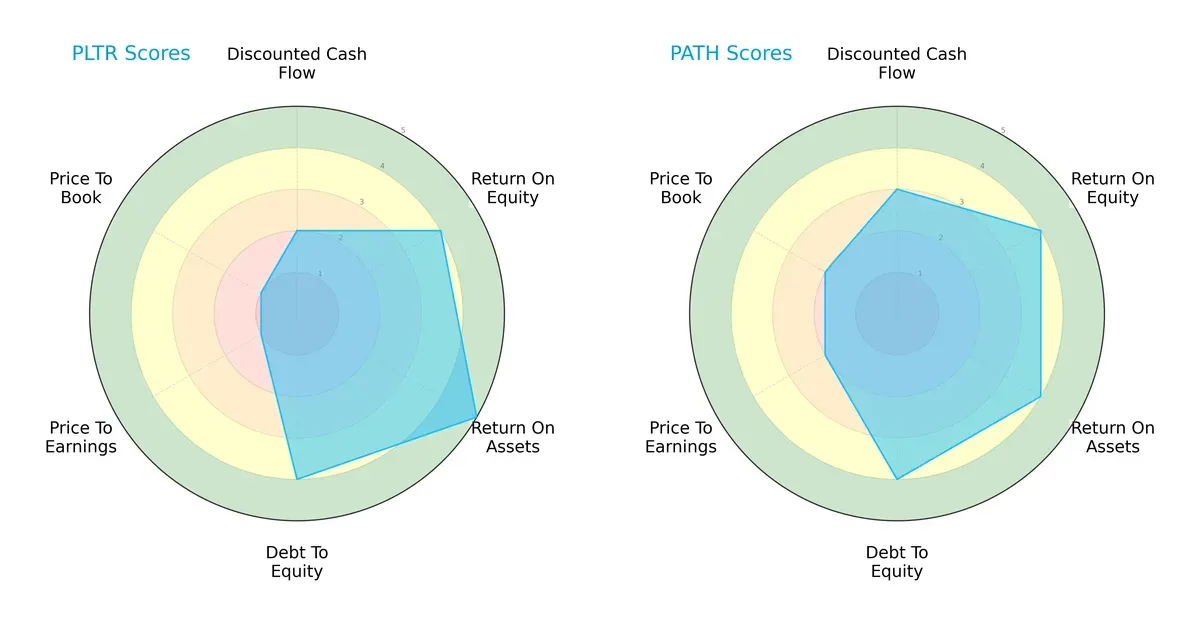
Palantir excels in asset utilization with a top ROA score (5) and strong debt management (4). UiPath offers a more balanced profile, leading slightly in discounted cash flow (3 vs. 2) and valuation metrics (P/E and P/B scores of 2 each vs. Palantir’s 1). Palantir relies heavily on operational efficiency, while UiPath presents a steadier valuation and cash flow outlook.
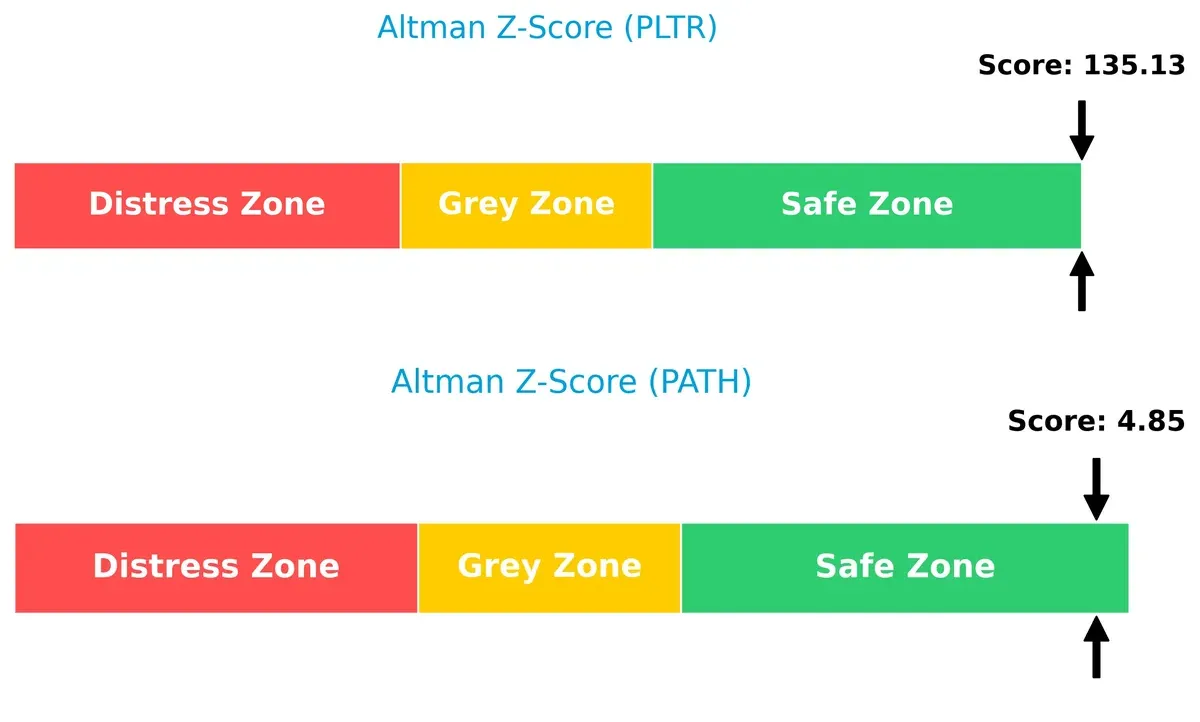
Bankruptcy Risk: Solvency Showdown
The Altman Z-Scores of 135.1 for Palantir and 4.85 for UiPath place both firms firmly in the safe zone, indicating robust long-term survival prospects in this cycle:
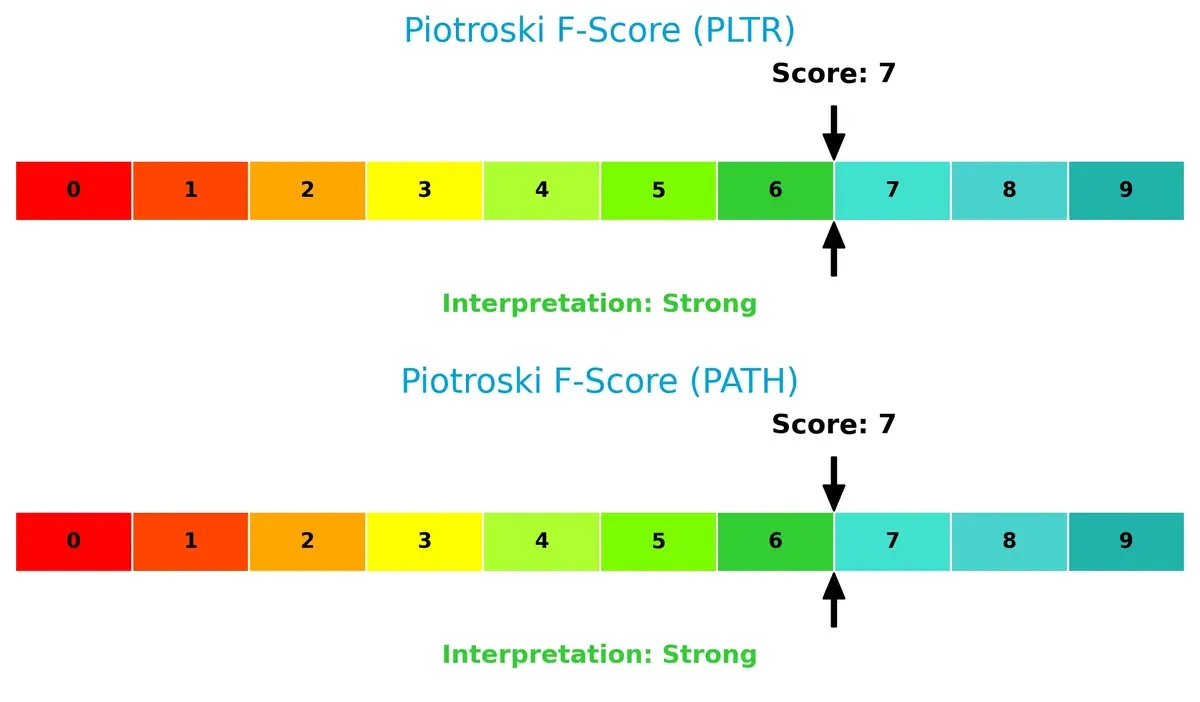
Financial Health: Quality of Operations
Both companies score a strong 7 on the Piotroski F-Score, reflecting solid financial health and operational quality. Neither shows red flags, suggesting well-managed internal metrics and resilience:
How are the two companies positioned?
This section dissects the operational DNA of Palantir and UiPath by comparing their revenue distribution and internal dynamics. The objective is to confront their economic moats to identify the more resilient and sustainable competitive advantage today.
Revenue Segmentation: The Strategic Mix
This visual comparison dissects how Palantir Technologies and UiPath diversify their income streams and where their primary sector bets lie:
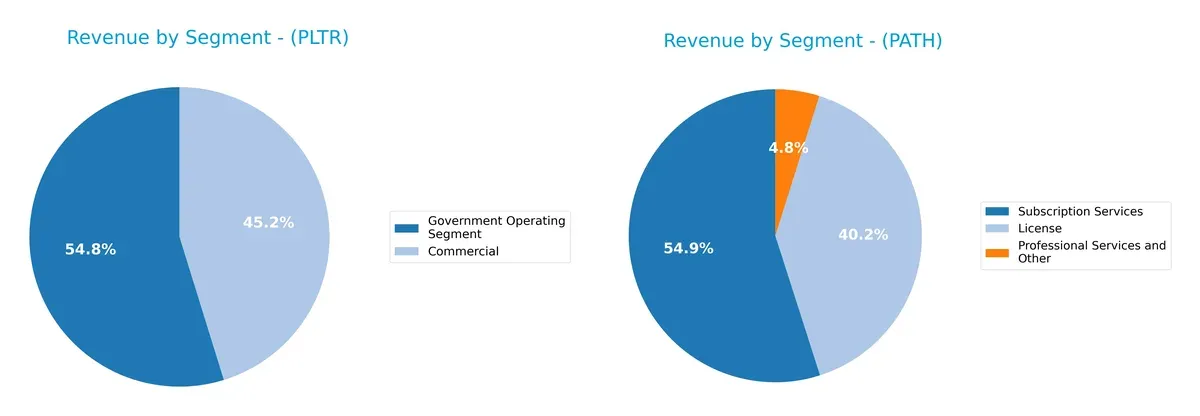
Palantir anchors its revenue in two major segments: Government Operating ($1.57B in 2024) and Commercial ($1.30B). UiPath diversifies more evenly across Subscription Services ($802M), License ($587M), and Professional Services ($71M) in 2025. Palantir’s government focus signals infrastructure dominance and steady contracts but concentration risk. UiPath’s balanced mix reflects flexible market exposure and ecosystem lock-in through subscriptions.
Strengths and Weaknesses Comparison
This table compares the Strengths and Weaknesses of Palantir Technologies Inc. and UiPath Inc.:
Palantir Technologies Inc. Strengths
- Strong profitability with 36.31% net margin
- High ROE at 22% and ROIC at 17.95%
- Very low debt levels and excellent interest coverage
- Broad geographic reach including US, UK, and Rest of World
- Balanced commercial and government revenue streams
UiPath Inc. Strengths
- Favorable price-to-earnings ratio despite losses
- Solid liquidity ratios around 2.93
- Low debt and manageable debt-to-assets ratio
- Global presence across Americas, Asia Pacific, and EMEA
- Diverse revenue from licenses, subscriptions, and services
Palantir Technologies Inc. Weaknesses
- Unfavorable high valuation multiples (PE 259, PB 57)
- Very high current ratio (7.11), possibly inefficient asset use
- WACC at 11.79% exceeds ROIC, suggesting capital cost issues
- No dividend yield
- Moderate asset turnover at 0.5
UiPath Inc. Weaknesses
- Negative profitability metrics with net margin of -5.15% and ROE -3.99%
- Negative ROIC at -7.41% below WACC at 8.83%
- Interest coverage at zero indicates vulnerability
- Asset turnover at 0.5 is low
- No dividend yield
Palantir shows strong profitability and financial stability but faces challenges with valuation and capital efficiency. UiPath’s strengths lie in liquidity and geographic diversification, yet the company struggles with profitability and capital returns, which may pressure its strategic priorities.
The Moat Duel: Analyzing Competitive Defensibility
A structural moat is the only true shield protecting long-term profits from relentless competition erosion. Let’s dissect the competitive moats of two software infrastructure leaders:
Palantir Technologies Inc.: Data Integration & Network Effects Fortress
Palantir’s moat stems from deep network effects and intangible assets in data integration. Its 36% net margin and 6%+ ROIC over WACC confirm strong value creation. Expansion into AI-driven analytics deepens this moat in 2026.
UiPath Inc.: Automation Platform with Cost Advantage Challenges
UiPath relies on cost advantages through automation software but trails Palantir’s scale. Negative net margin and ROIC below WACC signal value destruction despite growth. Expanding AI automation may improve margins but remains a disruption risk.
The Verdict: Network Effects vs. Cost Advantage in Software Infrastructure
Palantir’s growing, wide moat built on network effects surpasses UiPath’s narrower, cost-driven moat. Palantir’s superior profitability and value creation position it better to defend market share in 2026 and beyond.
Which stock offers better returns?
The past year showed a stark contrast in price movements and trading dynamics between Palantir Technologies Inc. and UiPath Inc., highlighting divergent investor sentiment and market performance.
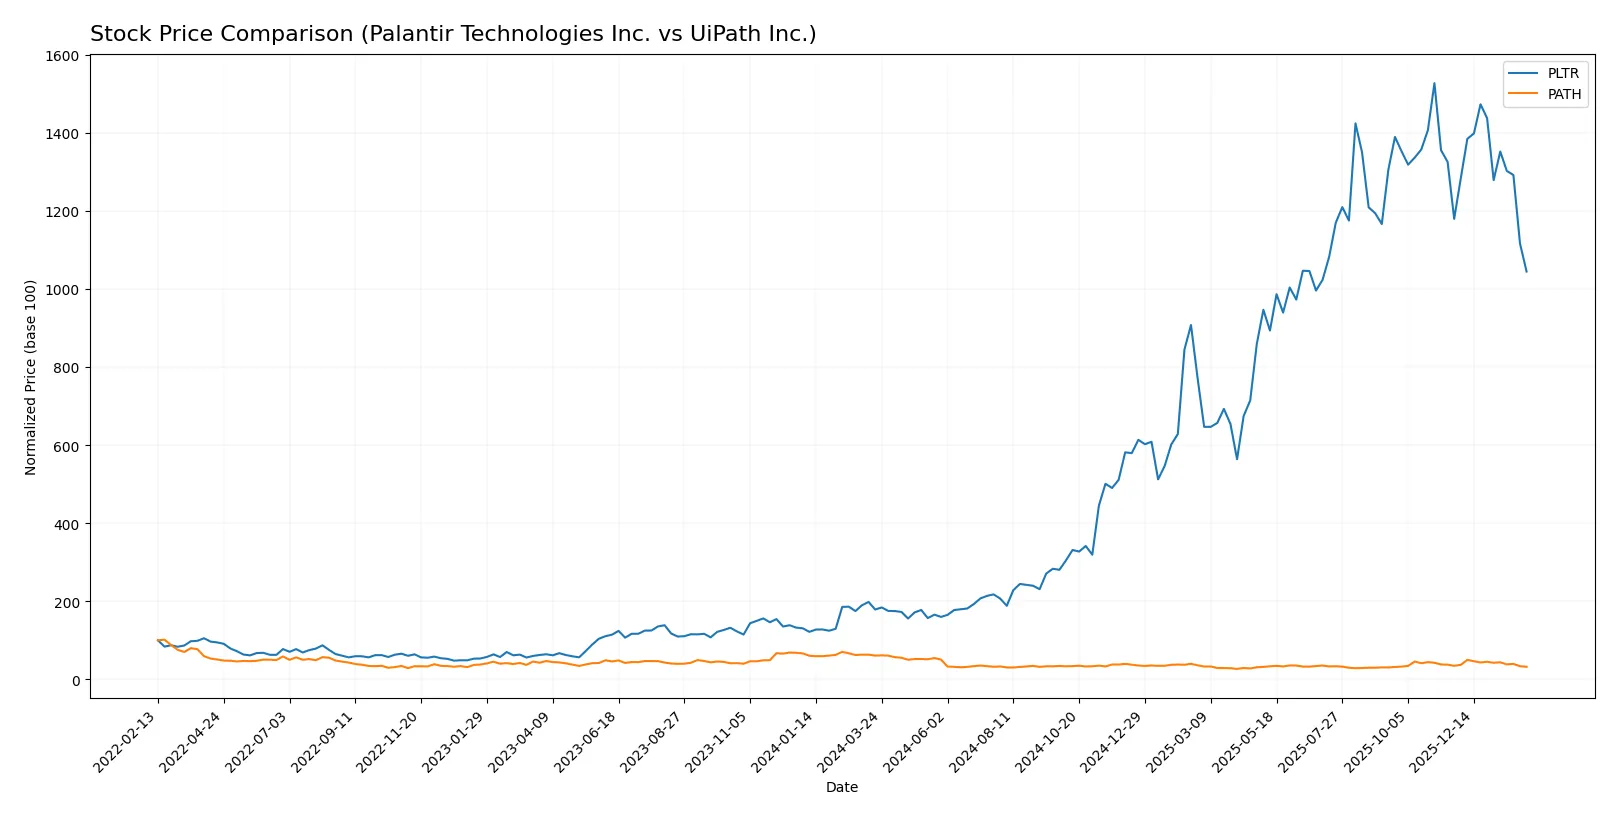
Trend Comparison
Palantir Technologies Inc. experienced a strong bullish trend over the past 12 months, with a 484% price increase, despite recent deceleration and a short-term 11.44% decline since November 2025.
UiPath Inc. faced a bearish trend over the same period, with a 47% price drop and continuing deceleration, including a recent 7.26% decline and low volatility compared to Palantir.
Palantir’s stock delivered significantly higher market returns than UiPath, reflecting robust longer-term growth despite recent pullbacks, while UiPath’s trend remains negative with weaker price momentum.
Target Prices
Analysts present a cautiously optimistic consensus for Palantir Technologies Inc. and UiPath Inc.
| Company | Target Low | Target High | Consensus |
|---|---|---|---|
| Palantir Technologies Inc. | 180 | 230 | 198.8 |
| UiPath Inc. | 14 | 19 | 16.6 |
The consensus target prices for both stocks exceed current prices, suggesting upside potential. Palantir’s target consensus sits 45% above its $136.7 price, while UiPath’s target is about 38% higher than its $12.04 price.

Don’t Let Luck Decide Your Entry Point
Optimize your entry points with our advanced ProRealTime indicators. You’ll get efficient buy signals with precise price targets for maximum performance. Start outperforming now!
How do institutions grade them?
Palantir Technologies Inc. Grades
The following table summarizes recent institutional grades for Palantir Technologies Inc.:
| Grading Company | Action | New Grade | Date |
|---|---|---|---|
| Citigroup | Maintain | Buy | 2026-02-03 |
| UBS | Maintain | Neutral | 2026-02-03 |
| DA Davidson | Maintain | Neutral | 2026-02-03 |
| Citigroup | Upgrade | Buy | 2026-01-12 |
| Morgan Stanley | Maintain | Equal Weight | 2025-11-04 |
| Piper Sandler | Maintain | Overweight | 2025-11-04 |
| Goldman Sachs | Maintain | Neutral | 2025-11-04 |
| Baird | Maintain | Neutral | 2025-11-04 |
| B of A Securities | Maintain | Buy | 2025-11-04 |
| UBS | Maintain | Neutral | 2025-11-04 |
UiPath Inc. Grades
The following table summarizes recent institutional grades for UiPath Inc.:
| Grading Company | Action | New Grade | Date |
|---|---|---|---|
| Barclays | Maintain | Equal Weight | 2026-01-12 |
| RBC Capital | Maintain | Sector Perform | 2026-01-05 |
| RBC Capital | Maintain | Sector Perform | 2025-12-10 |
| Morgan Stanley | Maintain | Equal Weight | 2025-12-09 |
| DA Davidson | Maintain | Neutral | 2025-12-05 |
| Mizuho | Maintain | Neutral | 2025-12-04 |
| Evercore ISI Group | Maintain | In Line | 2025-12-04 |
| RBC Capital | Maintain | Sector Perform | 2025-12-04 |
| Barclays | Maintain | Equal Weight | 2025-12-04 |
| Wells Fargo | Maintain | Equal Weight | 2025-12-04 |
Which company has the best grades?
Palantir consistently earns Buy and Overweight ratings from major firms, while UiPath mainly receives Neutral and Equal Weight grades. This suggests Palantir holds stronger institutional confidence, potentially influencing investor sentiment more positively.
Risks specific to each company
The following categories identify the critical pressure points and systemic threats facing both firms in the 2026 market environment:
1. Market & Competition
Palantir Technologies Inc.
- Dominates the intelligence software niche with strong government contracts but faces intensifying competition in commercial sectors.
UiPath Inc.
- Leads RPA innovation but contends with commoditization risks and rising competition from larger tech firms expanding automation offerings.
2. Capital Structure & Debt
Palantir Technologies Inc.
- Maintains an ultra-low debt-to-equity ratio (0.03), signaling minimal financial risk and strong balance sheet discipline.
UiPath Inc.
- Also exhibits low leverage (0.04 debt-to-equity), but its interest coverage ratio of zero raises red flags on debt servicing capacity.
3. Stock Volatility
Palantir Technologies Inc.
- Beta of 1.69 indicates higher stock volatility than the tech sector average, reflecting sensitivity to market swings.
UiPath Inc.
- Lower beta at 1.07 suggests comparatively moderate volatility and potentially steadier investor sentiment.
4. Regulatory & Legal
Palantir Technologies Inc.
- Faces heightened regulatory scrutiny due to government contracts and data privacy concerns internationally.
UiPath Inc.
- Encounters regulatory risks related to AI ethics and data compliance, especially in healthcare and financial sectors.
5. Supply Chain & Operations
Palantir Technologies Inc.
- Relies on robust software deployment and cloud infrastructure; operational resilience is strong but dependent on tech partners.
UiPath Inc.
- Depends on diverse global operational footprint, with potential supply chain disruptions impacting service delivery and software updates.
6. ESG & Climate Transition
Palantir Technologies Inc.
- ESG initiatives are emerging but lack full integration; climate transition risks remain secondary given software focus.
UiPath Inc.
- Shows growing commitment to ESG principles; however, energy consumption from data centers and automation tools poses transitional challenges.
7. Geopolitical Exposure
Palantir Technologies Inc.
- Significant exposure due to sensitive contracts with U.S., U.K., and international governments amid geopolitical tensions.
UiPath Inc.
- Operations spread across U.S., Romania, and Japan expose it to diverse geopolitical risks but less sensitive than defense-related contracts.
Which company shows a better risk-adjusted profile?
Palantir’s most impactful risk stems from intense regulatory and geopolitical scrutiny due to its government ties. UiPath’s biggest risk is its weak profitability and debt servicing capacity, reflected in negative margins and zero interest coverage. Overall, UiPath shows a more balanced risk-adjusted profile with lower stock volatility and stronger liquidity ratios. However, Palantir’s commanding market position and fortress-like balance sheet give it resilience despite higher market and regulatory risks. Recent data confirm Palantir’s superior profitability but caution investors on its elevated valuation multiples and market sensitivity.
Final Verdict: Which stock to choose?
Palantir Technologies Inc. excels as a cash-generating powerhouse with a very favorable moat supported by rising ROIC well above its cost of capital. Its unmatched operational efficiency and rapid income growth stand out. A point of vigilance remains its lofty valuation metrics, which could pressure returns. This stock suits aggressive growth portfolios willing to absorb volatility for outsized gains.
UiPath Inc. offers a strategic moat in automation software with recurring revenue potential that underpins steady cash flow. Compared to Palantir, it presents a more conservative financial profile, though it currently destroys value and faces margin challenges. UiPath fits portfolios seeking growth at a reasonable price with better downside protection amid evolving profitability.
If you prioritize aggressive growth and can tolerate premium valuations, Palantir outshines with superior profitability and value creation. However, if you seek steadier growth with a more balanced risk profile, UiPath offers better stability despite current profitability headwinds. Both require careful monitoring of execution risks and market cycles.
Disclaimer: Investment carries a risk of loss of initial capital. The past performance is not a reliable indicator of future results. Be sure to understand risks before making an investment decision.
Go Further
I encourage you to read the complete analyses of Palantir Technologies Inc. and UiPath Inc. to enhance your investment decisions: