Home > Comparison > Technology > PLTR vs TDC
The strategic rivalry between Palantir Technologies Inc. and Teradata Corporation shapes the competitive landscape of the software infrastructure sector. Palantir, a high-growth software innovator, focuses on advanced data integration and AI platforms. Teradata operates as a more established multi-cloud data platform provider with consulting services. This analysis evaluates which company’s operational model offers a superior risk-adjusted return for diversified portfolios amid evolving enterprise data demands.
Table of contents
Companies Overview
Palantir Technologies Inc. and Teradata Corporation stand as key innovators in the software infrastructure sector.
Palantir Technologies Inc.: Data Intelligence Pioneer
Palantir dominates the intelligence software niche by delivering platforms like Gotham and Foundry. Its core revenue springs from sophisticated data integration and analysis tools tailored for government and enterprise clients. In 2026, Palantir sharpens its strategic focus on expanding AI-driven capabilities and versatile deployment across environments.
Teradata Corporation: Multi-Cloud Analytics Specialist
Teradata leads with its connected multi-cloud data platform, Teradata Vantage, designed to unify and analyze enterprise data. The company’s competitive advantage lies in ecosystem simplification and consulting services that help clients migrate to cloud architectures. In 2026, Teradata prioritizes enhancing cloud integration and operationalizing analytics for diverse industries globally.
Strategic Collision: Similarities & Divergences
Both companies embrace the software infrastructure space but diverge philosophically: Palantir emphasizes proprietary intelligence platforms with a strong AI push, while Teradata bets on open multi-cloud ecosystems and consulting. Their primary battleground is enterprise data analytics and cloud adoption. Palantir projects a high-growth, innovation-driven profile, whereas Teradata offers steady, consulting-backed cloud integration exposure.
Income Statement Comparison
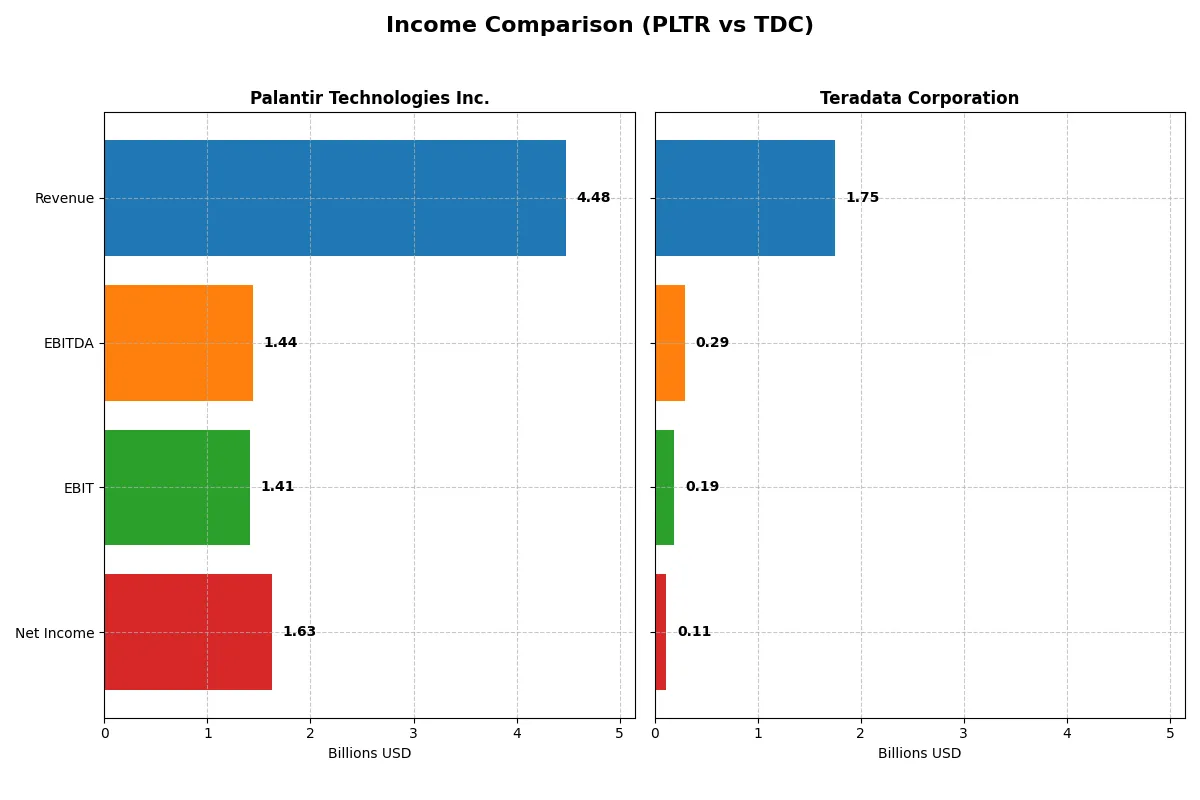
This data dissects the core profitability and scalability of both corporate engines to reveal who dominates the bottom line:
| Metric | Palantir Technologies Inc. (PLTR) | Teradata Corporation (TDC) |
|---|---|---|
| Revenue | 4.48B | 1.75B |
| Cost of Revenue | 789M | 692M |
| Operating Expenses | 2.27B | 849M |
| Gross Profit | 3.69B | 1.06B |
| EBITDA | 1.44B | 293M |
| EBIT | 1.41B | 193M |
| Interest Expense | 0 | 29M |
| Net Income | 1.63B | 114M |
| EPS | 0.69 | 1.18 |
| Fiscal Year | 2025 | 2024 |
Income Statement Analysis: The Bottom-Line Duel
This income statement comparison reveals which company converts revenue into profits most efficiently, exposing the strength of each corporate engine.
Palantir Technologies Inc. Analysis
Palantir’s revenue surged from 1.54B in 2021 to 4.48B in 2025, with net income swinging from a 520M loss to 1.63B profit. The company sustains a robust gross margin above 80%, while net margin expanded to 36.3% in 2025. This reflects remarkable operational leverage and accelerating profitability momentum.
Teradata Corporation Analysis
Teradata’s revenue slightly declined from 1.92B in 2021 to 1.75B in 2024, with net income falling from 147M to 114M. Its gross margin remains healthy at 60.5%, but net margin is modest at 6.5%. Despite recent EBIT growth, overall revenue and net income trends indicate limited expansion and margin compression risks.
Rapid Growth vs. Steady Legacy
Palantir dominates with explosive revenue and profit growth, supported by superior margins and margin expansion. Teradata delivers steadier, more modest profitability with slower top-line growth. Investors seeking dynamic growth and improving efficiency should note Palantir’s profile, while Teradata suits those prioritizing stable but constrained cash flows.
Financial Ratios Comparison
These vital ratios act as a diagnostic tool to expose the underlying fiscal health, valuation premiums, and capital efficiency of the companies compared:
| Ratios | Palantir Technologies Inc. (PLTR) | Teradata Corporation (TDC) |
|---|---|---|
| ROE | 22.0% | 85.7% |
| ROIC | 17.9% | 16.9% |
| P/E | 259.2x | 26.3x |
| P/B | 57.0x | 22.6x |
| Current Ratio | 7.11 | 0.81 |
| Quick Ratio | 7.11 | 0.79 |
| D/E | 0.03 | 4.33 |
| Debt-to-Assets | 2.6% | 33.8% |
| Interest Coverage | 0 (not available) | 7.21 |
| Asset Turnover | 0.50 | 1.03 |
| Fixed Asset Turnover | 17.76 | 9.07 |
| Payout ratio | 0% | 0% |
| Dividend yield | 0% | 0% |
| Fiscal Year | 2025 | 2024 |
Efficiency & Valuation Duel: The Vital Signs
Financial ratios act as the company’s DNA, uncovering hidden risks and operational excellence behind headline numbers.
Palantir Technologies Inc.
Palantir demonstrates strong profitability with a 22% ROE and a robust 36.3% net margin, signaling operational efficiency. However, its valuation metrics are stretched, with a P/E ratio soaring at 259x and a P/B of 57x, indicating an expensive stock. Palantir reinvests heavily in R&D, foregoing dividends to fuel growth.
Teradata Corporation
Teradata posts an extraordinary 85.7% ROE but a modest 6.5% net margin, showing mixed profitability signals. Its valuation appears reasonable compared to Palantir, with a P/E of 26.3 and P/B of 22.6, though still somewhat elevated. Teradata does not pay dividends, focusing capital allocation on operational improvements and growth initiatives.
Premium Valuation vs. Operational Safety
Palantir commands a premium valuation justified by high margins and solid returns but carries risks from its sky-high multiples. Teradata offers more conservative valuation metrics with strong ROE but lower margins, reflecting operational challenges. Investors seeking growth may prefer Palantir’s profile, while those valuing stability might lean toward Teradata’s balance sheet.
Which one offers the Superior Shareholder Reward?
Palantir (PLTR) pays no dividend but aggressively reinvests its robust free cash flow (~0.89/share in 2025) into growth, maintaining a pristine balance sheet with negligible debt. Teradata (TDC) also pays no dividends but shows modest free cash flow (~2.87/share in 2024) and carries substantial debt (D/E over 4.3), which pressures its financial flexibility. Both lack buybacks, but Palantir’s zero payout ratio signals full reinvestment in high-margin tech expansion, while Teradata’s leverage raises risk. I conclude Palantir offers a superior total return profile based on sustainable capital allocation and growth potential in 2026.
Comparative Score Analysis: The Strategic Profile
The radar chart reveals the fundamental DNA and trade-offs of Palantir Technologies and Teradata Corporation, highlighting their core financial strengths and weaknesses:
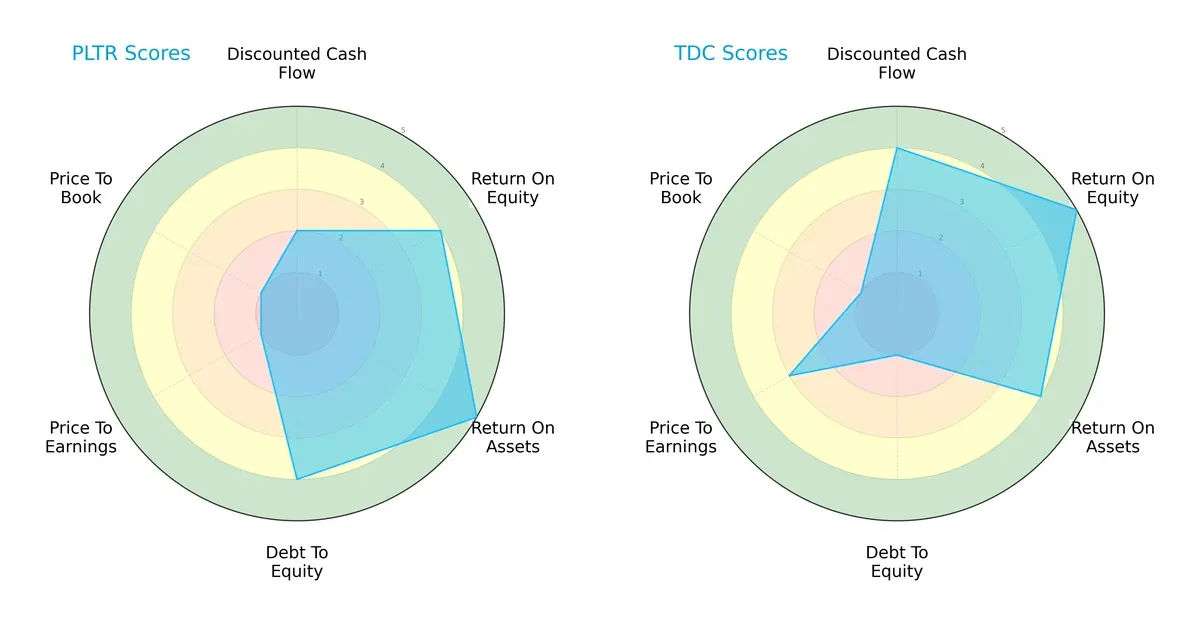
Palantir shows strength in asset utilization (ROA 5) and moderate leverage management (Debt/Equity 4), but suffers from very unfavorable valuation metrics (PE and PB scores of 1). Teradata excels in profitability metrics (ROE 5) and discounted cash flow (DCF 4) but carries high financial risk with a weak debt position (Debt/Equity 1). Teradata’s profile is more polarized, relying on profitability, while Palantir presents a more balanced operational efficiency but poor valuation appeal.
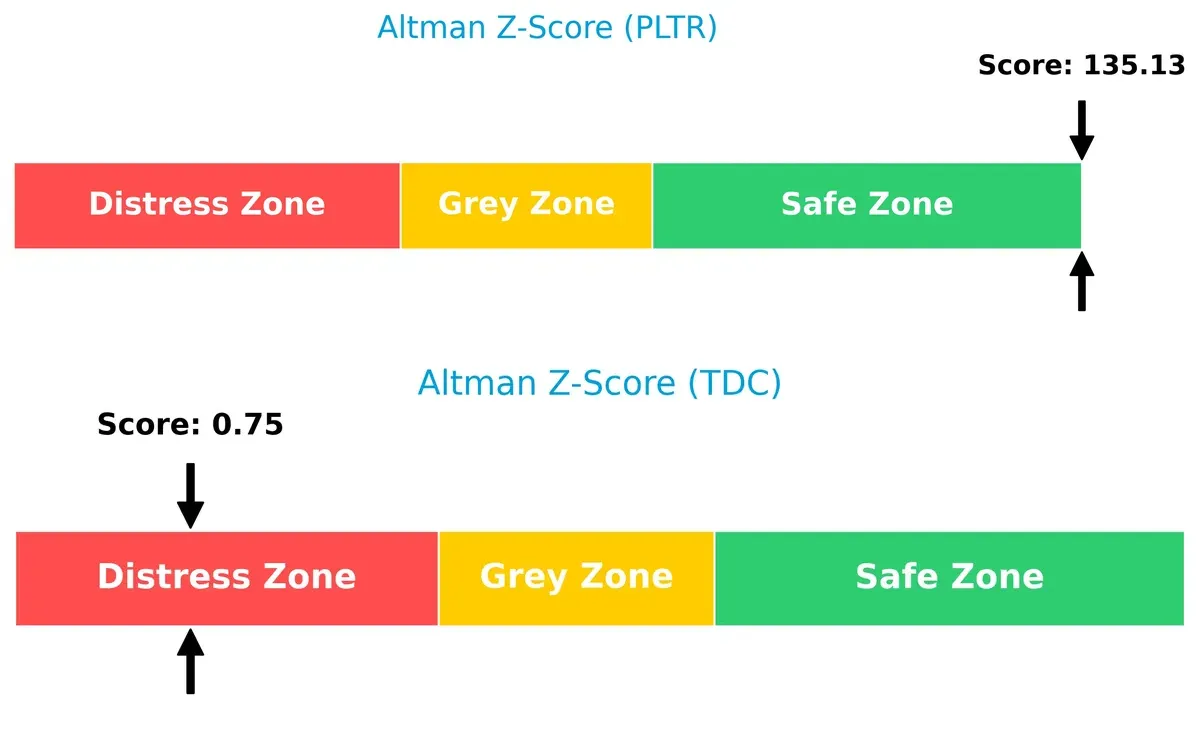
Bankruptcy Risk: Solvency Showdown
Palantir’s Altman Z-Score at 135 places it firmly in the safe zone, signaling robust solvency. Teradata’s score of 0.75 lands in the distress zone, implying significant bankruptcy risk in the current market cycle:
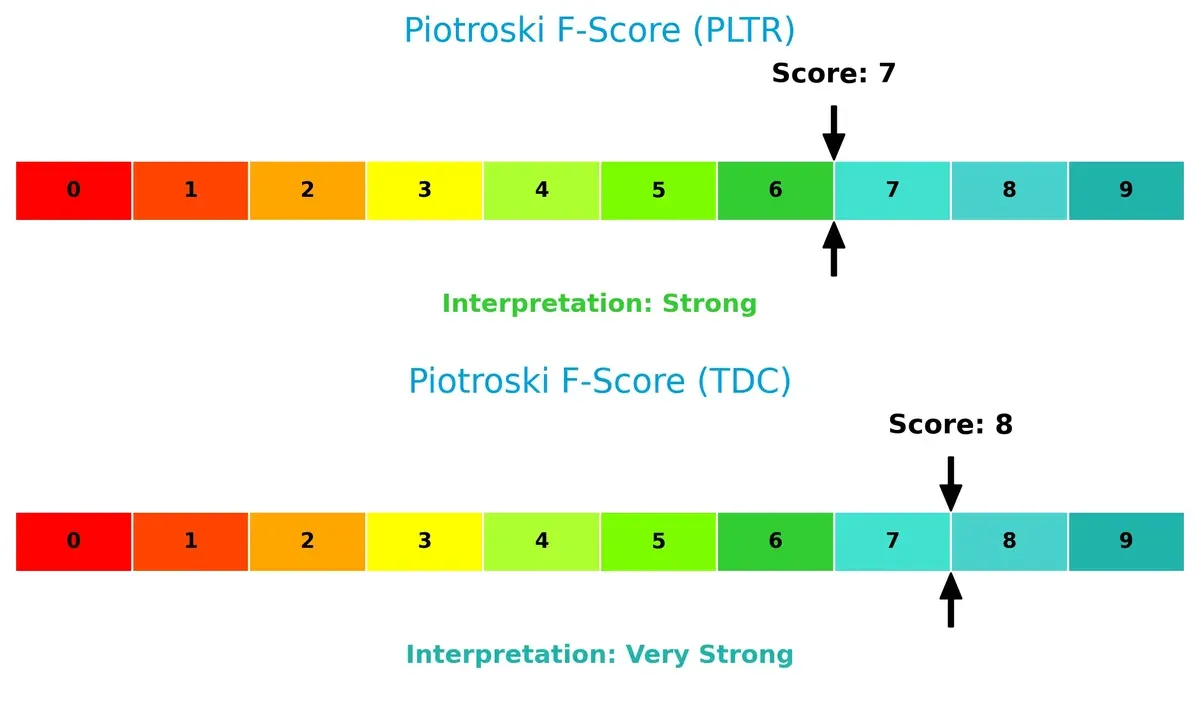
Financial Health: Quality of Operations
Teradata’s Piotroski F-Score of 8 indicates very strong financial health, surpassing Palantir’s strong but lower score of 7. Teradata’s internal metrics reflect fewer red flags, suggesting superior operational quality and risk management:
How are the two companies positioned?
This section dissects the operational DNA of Palantir and Teradata by comparing their revenue distribution and internal dynamics. The goal is to confront their economic moats and identify which model offers the most resilient advantage today.
Revenue Segmentation: The Strategic Mix
This comparison dissects how Palantir Technologies and Teradata Corporation diversify their income streams and where their primary sector bets lie:
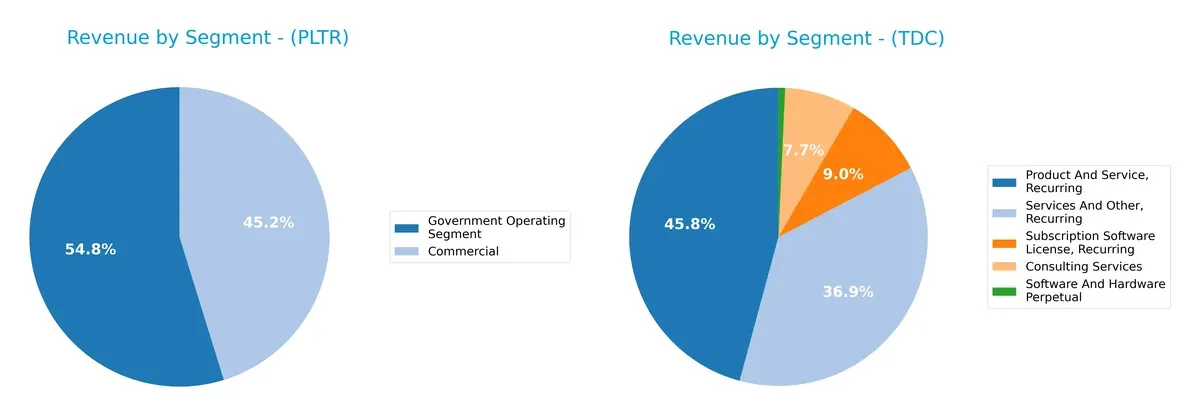
Palantir anchors its revenue heavily in government contracts with $1.57B in 2024, while commercial sales lag at $1.30B. Teradata shows a far more diversified mix, spreading $1.48B across Product and Service Recurring, $1.19B in Services, and $248M from Consulting. Palantir’s government focus signals concentration risk but strong ecosystem lock-in. Teradata pivots on diversified recurring revenues, mitigating reliance on any single segment.
Strengths and Weaknesses Comparison
This table compares the Strengths and Weaknesses of Palantir Technologies Inc. (PLTR) and Teradata Corporation (TDC):
PLTR Strengths
- Strong profitability with 36.31% net margin
- High ROE at 22%
- ROIC exceeds WACC, indicating value creation
- Low debt levels with 2.58% debt to assets
- Large and growing US revenue base at $1.9B
- Diverse revenue from commercial and government segments
TDC Strengths
- Exceptionally high ROE at 85.71%, signaling efficient capital use
- Favorable WACC at 5.71% supports lower capital costs
- Strong asset turnover at 1.03, indicating operational efficiency
- Recurring revenue streams over $2.8B enhance stability
- Broad geographic presence across Americas, EMEA, Asia Pacific
- Balanced product and service revenue mix
PLTR Weaknesses
- Very high P/E of 259.19 suggests overvaluation risk
- Elevated PB ratio at 57.02 indicates expensive equity
- Unfavorable current ratio of 7.11 may signal liquidity concerns
- Zero dividend yield limits income appeal
- Moderate asset turnover at 0.5 may reduce capital efficiency
- WACC higher than ROE, increasing capital cost pressure
TDC Weaknesses
- Low net margin at 6.51% limits profitability
- Unfavorable P/E of 26.34 and PB of 22.58 hint at valuation pressures
- Current and quick ratios below 1 indicate liquidity risks
- High debt-to-equity ratio of 4.33 raises financial risk
- Zero dividend yield restricts shareholder returns
- Neutral debt-to-assets ratio at 33.8% requires monitoring
Palantir demonstrates strong profitability and capital efficiency but faces valuation and liquidity red flags. Teradata excels in capital returns and operational efficiency yet struggles with profitability and liquidity challenges. Each company’s financial profile suggests distinct strategic priorities around valuation management and financial stability.
The Moat Duel: Analyzing Competitive Defensibility
A structural moat is the only barrier safeguarding long-term profits from relentless competitive erosion. Here’s how Palantir and Teradata stack up:
Palantir Technologies Inc.: Data Integration & AI-Driven Switching Costs
Palantir’s moat stems from its AI-powered data platforms that embed deep switching costs. It boasts a high ROIC above WACC and margin stability. Expansion into AI services in 2026 should reinforce this advantage.
Teradata Corporation: Cloud Ecosystem Cost Advantage
Teradata leverages its multi-cloud data platform to deliver cost efficiencies, contrasting Palantir’s switching cost focus. Its ROIC also exceeds WACC, with strong profitability growth. Continued cloud migration offers growth potential in 2026.
Competitive Moats in Data Infrastructure: Switching Costs vs. Cost Leadership
Both firms show very favorable moats with growing ROICs. Teradata’s cost advantage offers a wider moat, while Palantir’s AI-driven switching costs create a deeper, more resilient moat. Palantir is better positioned to defend market share through innovation and customer lock-in.
Which stock offers better returns?
The past year reveals stark contrasts in price movements and trading dynamics between Palantir Technologies and Teradata Corporation, highlighting divergent investor sentiment and market performance.
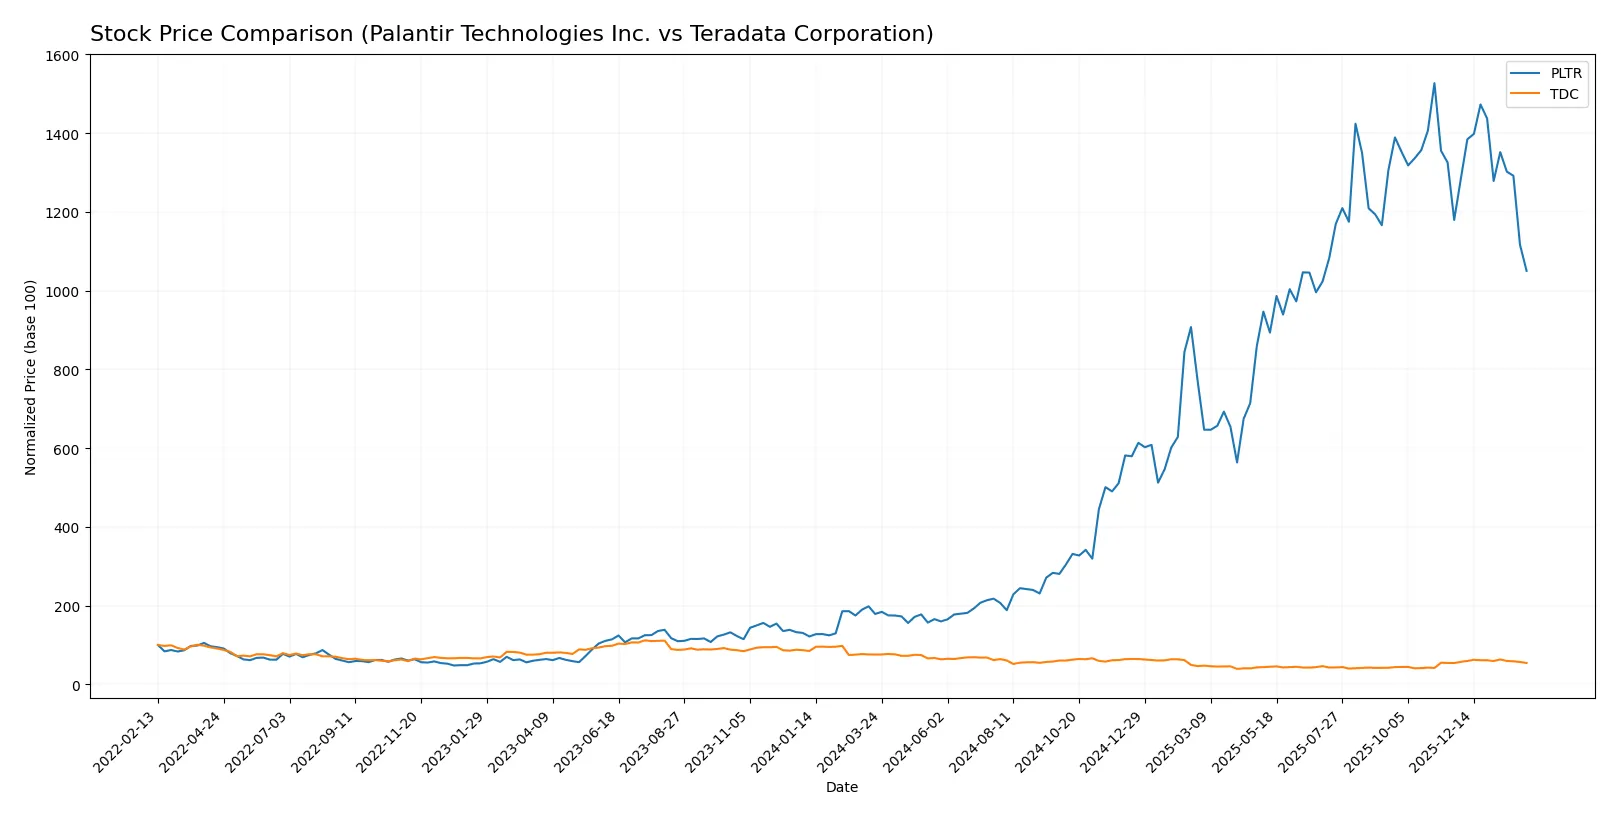
Trend Comparison
Palantir Technologies (PLTR) shows a strong bullish trend over the past 12 months with a 487.1% price increase, despite decelerating momentum and high volatility (std dev 59.55). The stock peaked at 200.47 and bottomed at 20.47.
Teradata Corporation (TDC) displays a bearish trend with a 28.44% price decline over the same period. The decline accelerates modestly. Price ranged between 19.73 and 38.67, with low volatility (std dev 5.35).
PLTR’s substantial gains outperform TDC’s losses clearly. Palantir delivers superior market performance despite recent short-term weakness, while Teradata struggles with persistent downtrend.
Target Prices
Analysts show a clear upside consensus for both Palantir Technologies and Teradata Corporation.
| Company | Target Low | Target High | Consensus |
|---|---|---|---|
| Palantir Technologies Inc. | 180 | 230 | 198.8 |
| Teradata Corporation | 27 | 35 | 31 |
Palantir’s 198.8 consensus target exceeds its current 138.17 price, signaling strong growth expectations. Teradata’s 31 target also suggests moderate upside above the present 27.22 share price.

Don’t Let Luck Decide Your Entry Point
Optimize your entry points with our advanced ProRealTime indicators. You’ll get efficient buy signals with precise price targets for maximum performance. Start outperforming now!
How do institutions grade them?
Palantir Technologies Inc. Grades
The following table summarizes recent institutional grades for Palantir Technologies Inc.:
| Grading Company | Action | New Grade | Date |
|---|---|---|---|
| Citigroup | Maintain | Buy | 2026-02-03 |
| UBS | Maintain | Neutral | 2026-02-03 |
| DA Davidson | Maintain | Neutral | 2026-02-03 |
| Citigroup | Upgrade | Buy | 2026-01-12 |
| Morgan Stanley | Maintain | Equal Weight | 2025-11-04 |
| Piper Sandler | Maintain | Overweight | 2025-11-04 |
| Goldman Sachs | Maintain | Neutral | 2025-11-04 |
| Baird | Maintain | Neutral | 2025-11-04 |
| B of A Securities | Maintain | Buy | 2025-11-04 |
| UBS | Maintain | Neutral | 2025-11-04 |
Teradata Corporation Grades
The following table summarizes recent institutional grades for Teradata Corporation:
| Grading Company | Action | New Grade | Date |
|---|---|---|---|
| Barclays | Maintain | Underweight | 2026-01-12 |
| RBC Capital | Maintain | Sector Perform | 2026-01-05 |
| Morgan Stanley | Maintain | Overweight | 2025-12-17 |
| Citizens | Upgrade | Market Outperform | 2025-11-10 |
| Barclays | Maintain | Underweight | 2025-11-05 |
| Evercore ISI Group | Maintain | Outperform | 2025-11-05 |
| TD Cowen | Maintain | Hold | 2025-11-05 |
| UBS | Maintain | Neutral | 2025-08-06 |
| Guggenheim | Maintain | Buy | 2025-05-07 |
| Barclays | Maintain | Underweight | 2025-04-21 |
Which company has the best grades?
Palantir holds consistently positive grades with multiple Buy and Overweight ratings. Teradata shows a mixed profile with several Underweight ratings but some strong Outperform and Buy opinions. Palantir’s more frequent Buy recommendations potentially signal higher institutional confidence, which may influence investor sentiment favorably.
Risks specific to each company
The following categories identify the critical pressure points and systemic threats facing both firms in the 2026 market environment:
1. Market & Competition
Palantir Technologies Inc.
- Operates in advanced software platforms with high innovation demands and strong competition from tech giants.
Teradata Corporation
- Faces intense competition in enterprise analytics and cloud data platforms, with slower growth compared to AI-driven peers.
2. Capital Structure & Debt
Palantir Technologies Inc.
- Extremely low debt (D/E 0.03) supports financial stability and low risk of distress.
Teradata Corporation
- High debt load (D/E 4.33) presents significant financial risk and vulnerability to interest rate hikes.
3. Stock Volatility
Palantir Technologies Inc.
- High beta at 1.687 indicates significant price swings and market sensitivity.
Teradata Corporation
- Low beta at 0.544 shows more stable stock price with lower volatility.
4. Regulatory & Legal
Palantir Technologies Inc.
- Subject to strict government and international regulations due to intelligence community ties.
Teradata Corporation
- Faces standard regulatory environment for software and data services without major legal complexities.
5. Supply Chain & Operations
Palantir Technologies Inc.
- Operates primarily software-based, minimizing supply chain risks but dependent on tech talent retention.
Teradata Corporation
- Multi-cloud platform depends on complex ecosystem integrations, increasing operational risks.
6. ESG & Climate Transition
Palantir Technologies Inc.
- Faces pressure to enhance ESG disclosures and address data privacy and ethical AI concerns.
Teradata Corporation
- Needs to align cloud data operations with sustainability goals amid rising investor ESG demands.
7. Geopolitical Exposure
Palantir Technologies Inc.
- High geopolitical risk due to contracts with US and allied intelligence agencies.
Teradata Corporation
- Moderate exposure through global client base but less sensitive to geopolitical tensions.
Which company shows a better risk-adjusted profile?
Palantir’s greatest risk lies in geopolitical exposure and high stock volatility amid regulatory scrutiny. Teradata faces critical financial risk from its heavy debt burden and operational complexity. Despite Palantir’s premium valuation, its strong balance sheet and low leverage provide a superior risk-adjusted profile. Teradata’s distress zone Altman Z-Score and high debt-to-equity raise alarms about financial stability. Palantir’s 7.11 current ratio signals ample liquidity, contrasting sharply with Teradata’s precarious 0.81 ratio. This liquidity advantage justifies my cautious preference for Palantir despite market volatility.
Final Verdict: Which stock to choose?
Palantir Technologies Inc. stands out for its unmatched ability to generate rapid revenue and profit growth, driven by a strong moat of advanced data analytics. Its high liquidity signals operational flexibility but warrants vigilance due to its stretched valuation multiples. It suits an aggressive growth portfolio seeking exposure to cutting-edge tech.
Teradata Corporation offers a durable moat anchored in enterprise data management with steady cash flow and robust returns on capital. While it lacks Palantir’s explosive growth, Teradata provides relative safety with a more moderate valuation profile. It fits well in a GARP (Growth at a Reasonable Price) portfolio emphasizing stability.
If you prioritize exponential growth and innovation, Palantir is the compelling choice due to its accelerating profitability and market dominance. However, if you seek better capital efficiency and a steadier earnings base, Teradata offers superior downside protection and sustainable returns despite slower growth. Both present analytical scenarios depending on investor risk tolerance and strategic focus.
Disclaimer: Investment carries a risk of loss of initial capital. The past performance is not a reliable indicator of future results. Be sure to understand risks before making an investment decision.
Go Further
I encourage you to read the complete analyses of Palantir Technologies Inc. and Teradata Corporation to enhance your investment decisions: