Home > Comparison > Technology > PLTR vs SNPS
The strategic rivalry between Palantir Technologies Inc. and Synopsys, Inc. shapes the evolution of the software infrastructure sector. Palantir focuses on data integration and AI-driven analytics, targeting intelligence and operational efficiency. Synopsys excels in electronic design automation, serving semiconductor and broader technology markets with complex software solutions. This analysis will assess which company’s operational model offers a superior risk-adjusted return for diversified portfolios in today’s dynamic tech landscape.
Table of contents
Companies Overview
Palantir Technologies and Synopsys stand as titans in the software infrastructure sector, shaping critical technological frontiers globally.
Palantir Technologies Inc.: Data Analytics Powerhouse
Palantir dominates the intelligence software market with platforms like Gotham and Foundry, which enable deep data pattern identification and operational planning. Its 2026 strategy focuses on expanding AI-driven solutions through its Artificial Intelligence Platform (AIP), integrating large language models to transform complex data into actionable insights. Palantir’s edge lies in its specialization in defense and government sectors worldwide.
Synopsys, Inc.: Semiconductor Design Leader
Synopsys leads in electronic design automation (EDA) software, powering integrated circuit design and testing with its Fusion Design and Verification Continuum platforms. The company’s 2026 strategy emphasizes broadening its IP portfolio and security solutions to address growing chip complexity and software vulnerabilities. Synopsys supports diverse industries, including automotive and medicine, leveraging its scale with 20K employees and comprehensive design tools.
Strategic Collision: Similarities & Divergences
Both firms excel in software infrastructure but diverge sharply in focus: Palantir centers on data analytics for intelligence and operational use, while Synopsys targets semiconductor design automation and IP solutions. Their primary battleground is the broader technology ecosystem, where AI-driven analytics and chip design increasingly intersect. Investors face distinct profiles—Palantir offers high-growth AI ambitions; Synopsys delivers steady dominance in critical semiconductor tools.
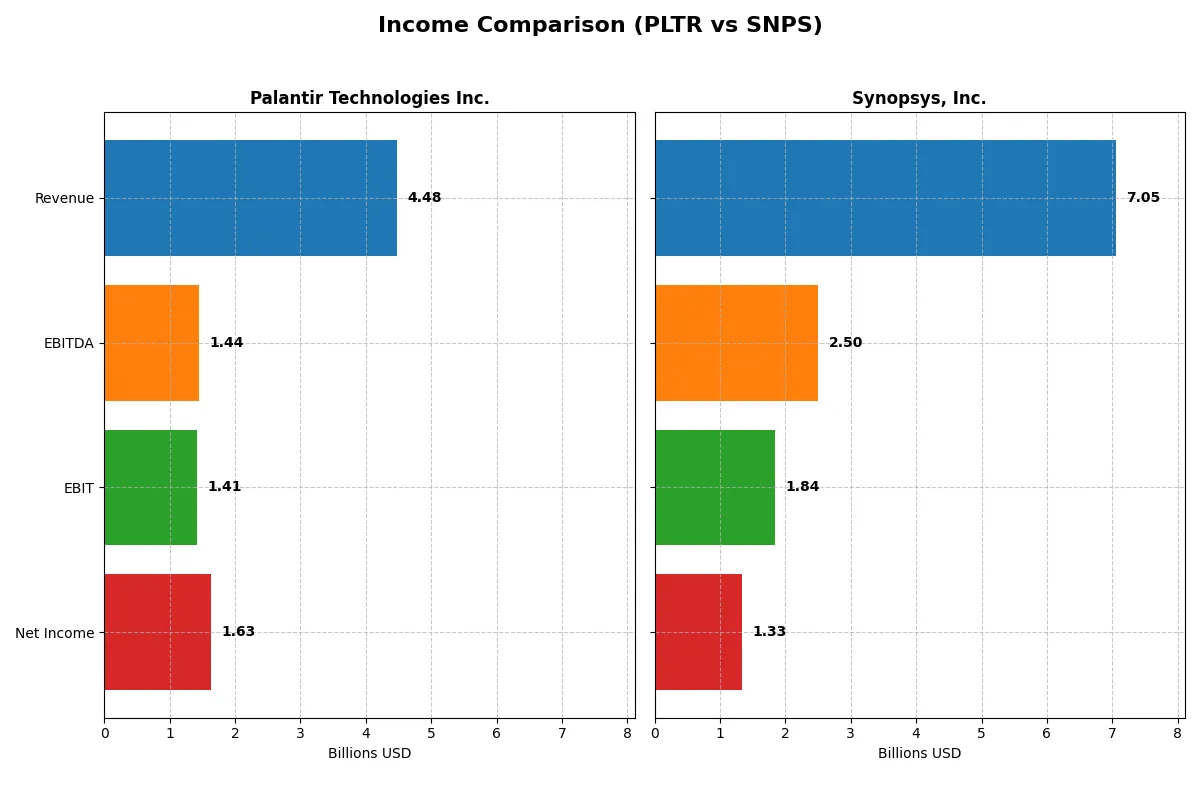
Income Statement Comparison
This data dissects the core profitability and scalability of both corporate engines to reveal who dominates the bottom line:
| Metric | Palantir Technologies Inc. (PLTR) | Synopsys, Inc. (SNPS) |
|---|---|---|
| Revenue | 4.48B | 7.05B |
| Cost of Revenue | 789M | 1.62B |
| Operating Expenses | 2.27B | 4.52B |
| Gross Profit | 3.69B | 5.43B |
| EBITDA | 1.44B | 2.50B |
| EBIT | 1.41B | 1.84B |
| Interest Expense | 0 | 447M |
| Net Income | 1.63B | 1.33B |
| EPS | 0.69 | 8.13 |
| Fiscal Year | 2025 | 2025 |
Income Statement Analysis: The Bottom-Line Duel
This income statement comparison reveals which company converts revenue into profit more efficiently, spotlighting operational strength and growth momentum.
Palantir Technologies Inc. Analysis
Palantir’s revenue soared from 1.54B in 2021 to 4.48B in 2025, reflecting a 190% rise. Net income jumped over fourfold to 1.63B, driven by an impressive 82% gross margin and a robust 36% net margin in 2025. The rapid EBIT growth and expanding margins highlight strong operational leverage and accelerating profitability.
Synopsys, Inc. Analysis
Synopsys grew revenue steadily from 4.20B in 2021 to 7.05B in 2025, a 68% gain. Net income rose 76% to 1.33B, supported by a solid 77% gross margin but a slimmer 19% net margin. Despite healthy top-line growth, a modest net margin contraction and higher interest expense temper its bottom-line momentum.
Margin Excellence vs. Steady Scale
Palantir outperforms Synopsys in margin expansion and net income growth, showcasing superior efficiency and profit acceleration. Synopsys offers larger revenue scale but with less margin improvement and lower net profitability. For investors prioritizing rapid earnings growth and operational leverage, Palantir presents a more compelling profile.
Financial Ratios Comparison
These vital ratios act as a diagnostic tool to expose the underlying fiscal health, valuation premiums, and capital efficiency of the companies compared below:
| Ratios | Palantir Technologies Inc. (PLTR) | Synopsys, Inc. (SNPS) |
|---|---|---|
| ROE | 22.0% | 4.7% |
| ROIC | 17.9% | 2.0% |
| P/E | 259.2x | 54.6x |
| P/B | 57.0x | 2.6x |
| Current Ratio | 7.11 | 1.62 |
| Quick Ratio | 7.11 | 1.52 |
| D/E | 0.03 | 0.50 |
| Debt-to-Assets | 2.6% | 29.6% |
| Interest Coverage | 0 (not reported/zero) | 2.0x |
| Asset Turnover | 0.50 | 0.15 |
| Fixed Asset Turnover | 17.8 | 5.0 |
| Payout Ratio | 0% | 0% |
| Dividend Yield | 0% | 0% |
| Fiscal Year | 2025 | 2025 |
Efficiency & Valuation Duel: The Vital Signs
Financial ratios serve as a company’s DNA, unveiling hidden risks and operational strengths that often elude surface-level analysis.
Palantir Technologies Inc.
Palantir displays strong profitability with a 22% ROE and a robust 36.31% net margin, signaling operational efficiency. However, its valuation appears stretched, reflected in a sky-high P/E of 259 and a P/B of 57. The company does not pay dividends, instead channeling resources into R&D and growth, supporting long-term value creation despite elevated valuation risks.
Synopsys, Inc.
Synopsys posts a modest 4.7% ROE and an 18.89% net margin, indicating moderate profitability but less operational efficiency than Palantir. Its P/E of 54.6 remains high, though more reasonable than Palantir’s. Synopsys offers no dividend, focusing on reinvestment in research and development to fuel growth, balancing shareholder returns with ongoing innovation efforts.
Premium Valuation vs. Operational Safety
Palantir commands a premium valuation fueled by exceptional profitability but carries valuation risk. Synopsys presents a more balanced valuation but lower returns. Investors prioritizing growth at a valuation premium may favor Palantir’s profile. Those seeking operational steadiness with moderate risk might lean toward Synopsys.
Which one offers the Superior Shareholder Reward?
Palantir Technologies Inc. (PLTR) and Synopsys, Inc. (SNPS) both forgo dividends, focusing on reinvestment and buybacks for shareholder value. PLTR shows zero dividend yield and payout, relying heavily on reinvestment with a strong free cash flow per share of 0.89 and a near 1.0 free cash flow to operating cash flow ratio. PLTR’s buyback intensity is less visible but implied by high cash reserves and low debt. SNPS also pays no dividends but sustains a robust free cash flow of 8.42 per share and a consistent buyback program, supported by steady operating margins near 20%. SNPS’s moderate debt and capital expenditure coverage ratios suggest a balanced approach to capital allocation. I find SNPS’s distribution model more sustainable and attractive for total shareholder return in 2026, combining strong margins, disciplined buybacks, and prudent leverage, unlike PLTR’s premium valuation and reinvestment-heavy stance.
Comparative Score Analysis: The Strategic Profile
The radar chart reveals the fundamental DNA and trade-offs of Palantir Technologies and Synopsys, Inc., highlighting their financial strengths and valuation nuances:
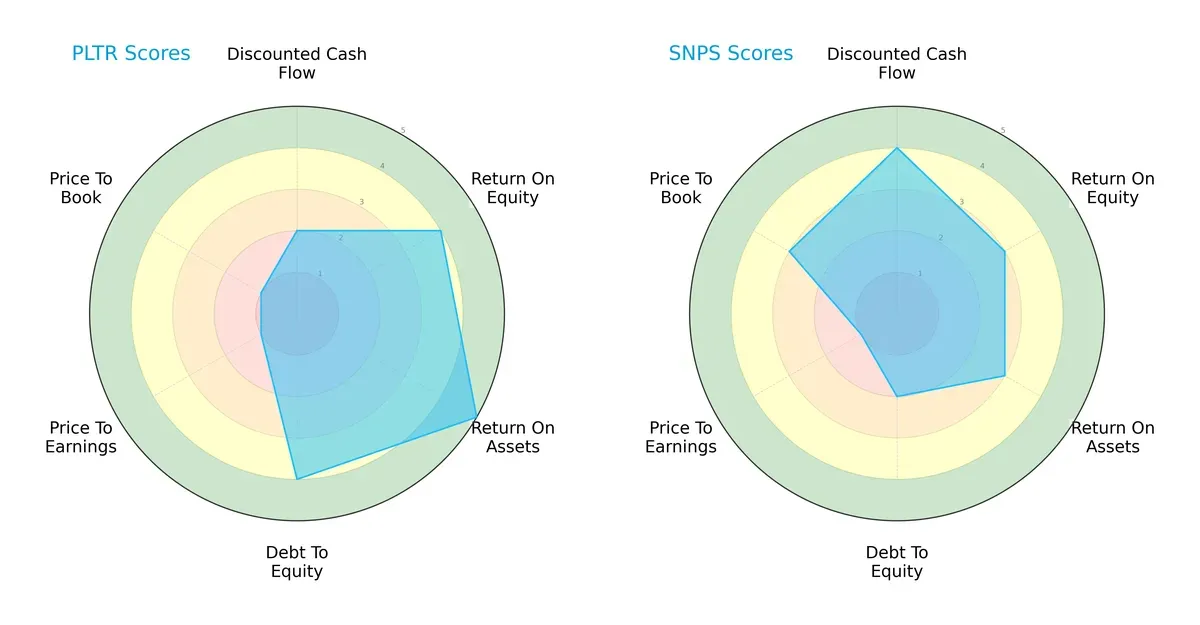
Palantir excels in asset efficiency (ROA 5 vs. 3) and financial leverage (Debt/Equity 4 vs. 2), suggesting prudent capital structure management. Synopsys leads in discounted cash flow (DCF 4 vs. 2) and price-to-book valuation (3 vs. 1), implying better market valuation and cash flow prospects. Both share a weak price-to-earnings score (1), indicating valuation challenges. Palantir presents a more balanced operational profile, while Synopsys relies more on valuation strength.
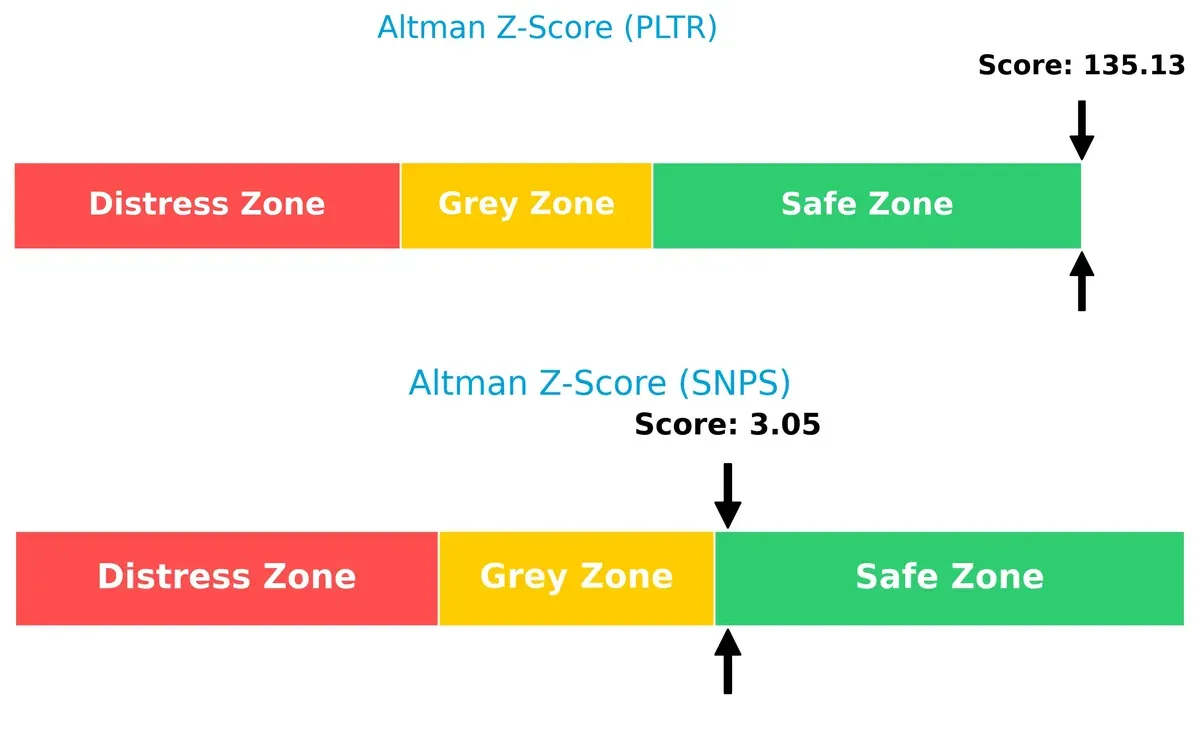
Bankruptcy Risk: Solvency Showdown
Palantir’s Altman Z-Score of 135.1 vastly exceeds Synopsys’s 3.05, signaling an exceptionally stronger buffer against bankruptcy risk in this cycle:
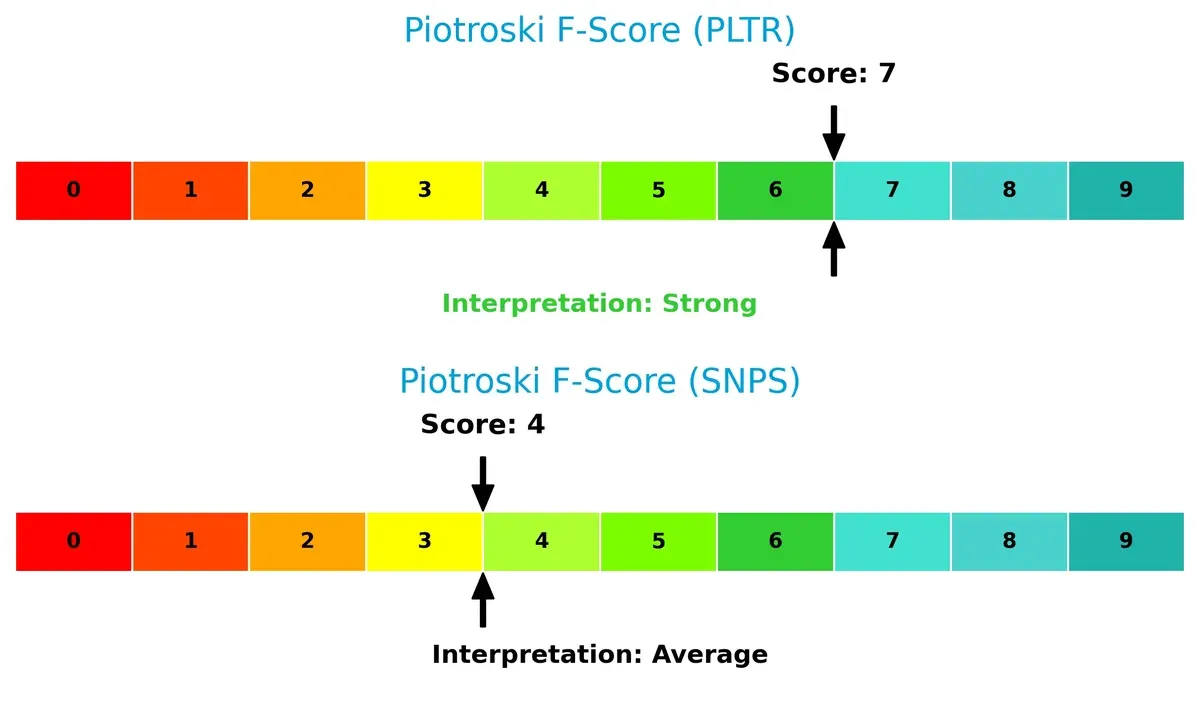
Financial Health: Quality of Operations
Palantir scores a strong 7 on the Piotroski F-Score, outperforming Synopsys’s average 4, indicating superior operational quality and fewer internal red flags:
How are the two companies positioned?
This section dissects the operational DNA of Palantir and Synopsys by comparing their revenue distribution and internal dynamics. The goal is to confront their economic moats to identify which model offers the most resilient, sustainable advantage in today’s market.
Revenue Segmentation: The Strategic Mix
This visual comparison dissects how Palantir Technologies and Synopsys diversify their income streams and where their primary sector bets lie:
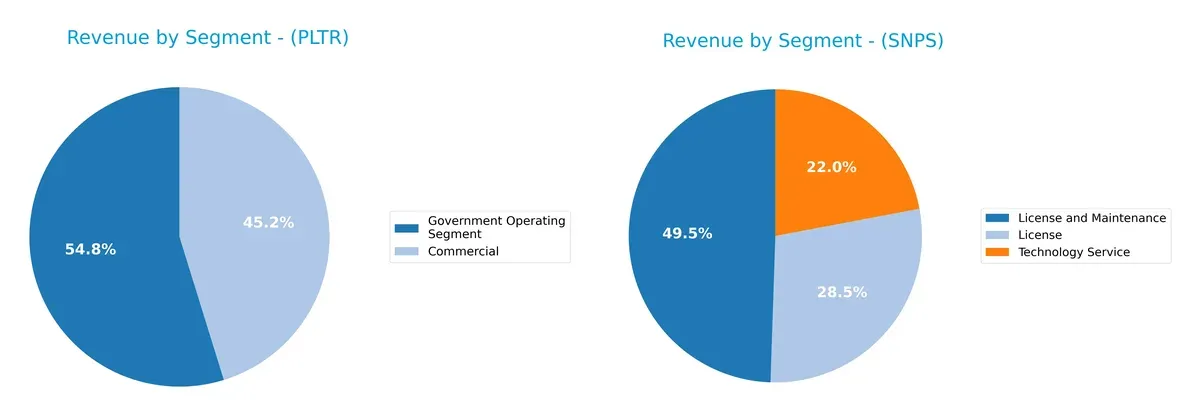
Palantir anchors its revenue heavily in Government Operating Segment at $1.57B (2024), with Commercial trailing at $1.30B. Synopsys shows a broader mix, with License and Maintenance at $3.22B, License at $1.80B, and Technology Service at $1.10B (2024). Palantir’s concentration signals reliance on government contracts, exposing concentration risk. Synopsys’s diversified streams reflect ecosystem lock-in and steady infrastructure dominance.
Strengths and Weaknesses Comparison
This table compares the Strengths and Weaknesses of Palantir Technologies Inc. and Synopsys, Inc.:
Palantir Technologies Inc. Strengths
- High net margin at 36.31%
- Strong ROE at 22.0%
- ROIC well above WACC at 17.95% vs 11.79%
- Very low debt levels with D/E of 0.03
- Robust global presence including US, UK, and Rest of World
- Fast fixed asset turnover at 17.76
Synopsys, Inc. Strengths
- Solid net margin at 18.89%
- Favorable current and quick ratios indicating liquidity
- Diverse revenue streams with License, Maintenance, and Technology Services
- Broad global footprint including US, China, Europe, Korea
- Moderate fixed asset turnover at 5.04
- Lower debt to assets ratio at 29.64%
Palantir Technologies Inc. Weaknesses
- Overvalued valuation metrics with PE at 259.19 and PB at 57.02
- Unfavorable high current ratio of 7.11 may indicate inefficient asset use
- WACC higher than ideal at 11.79%
- No dividend yield
- Moderate asset turnover at 0.5
Synopsys, Inc. Weaknesses
- Low ROE at 4.7% and ROIC at 1.97% below WACC of 8.19%
- PE ratio still elevated at 54.56
- Asset turnover weak at 0.15
- Interest coverage ratio only neutral at 4.12
- No dividend yield
Both companies demonstrate strong global presences and diversified revenue sources, with Palantir showing superior profitability and capital efficiency. However, Palantir’s valuation and asset management metrics raise caution, while Synopsys faces challenges in returns on invested capital and operational efficiency. These factors shape each company’s strategic focus on balancing growth, profitability, and financial discipline.
The Moat Duel: Analyzing Competitive Defensibility
A structural moat is the only true shield protecting long-term profits from relentless competitive erosion. Let’s dissect how these two tech firms defend their turf:
Palantir Technologies Inc.: Data Dominance Through Intangible Assets
Palantir’s moat rests on powerful intangible assets—its proprietary data platforms drive high ROIC and margin stability. In 2026, expanding AI integration could deepen this competitive edge.
Synopsys, Inc.: Innovation Challenge Amid Cost Pressures
Synopsys relies on advanced technology innovation but faces a weakening moat indicated by declining ROIC. Unlike Palantir, it struggles to sustain value amid rising costs and margin pressure.
Intangible Assets vs. Innovation Velocity
Palantir’s widening moat outpaces Synopsys’s shrinking returns. Palantir is better equipped to defend and grow market share with sustainable profitability and scalable AI-driven platforms.
Which stock offers better returns?
The stock price chart highlights Palantir’s sharp rise over the past year, contrasted by Synopsys’s declining trend with recent recovery signs.
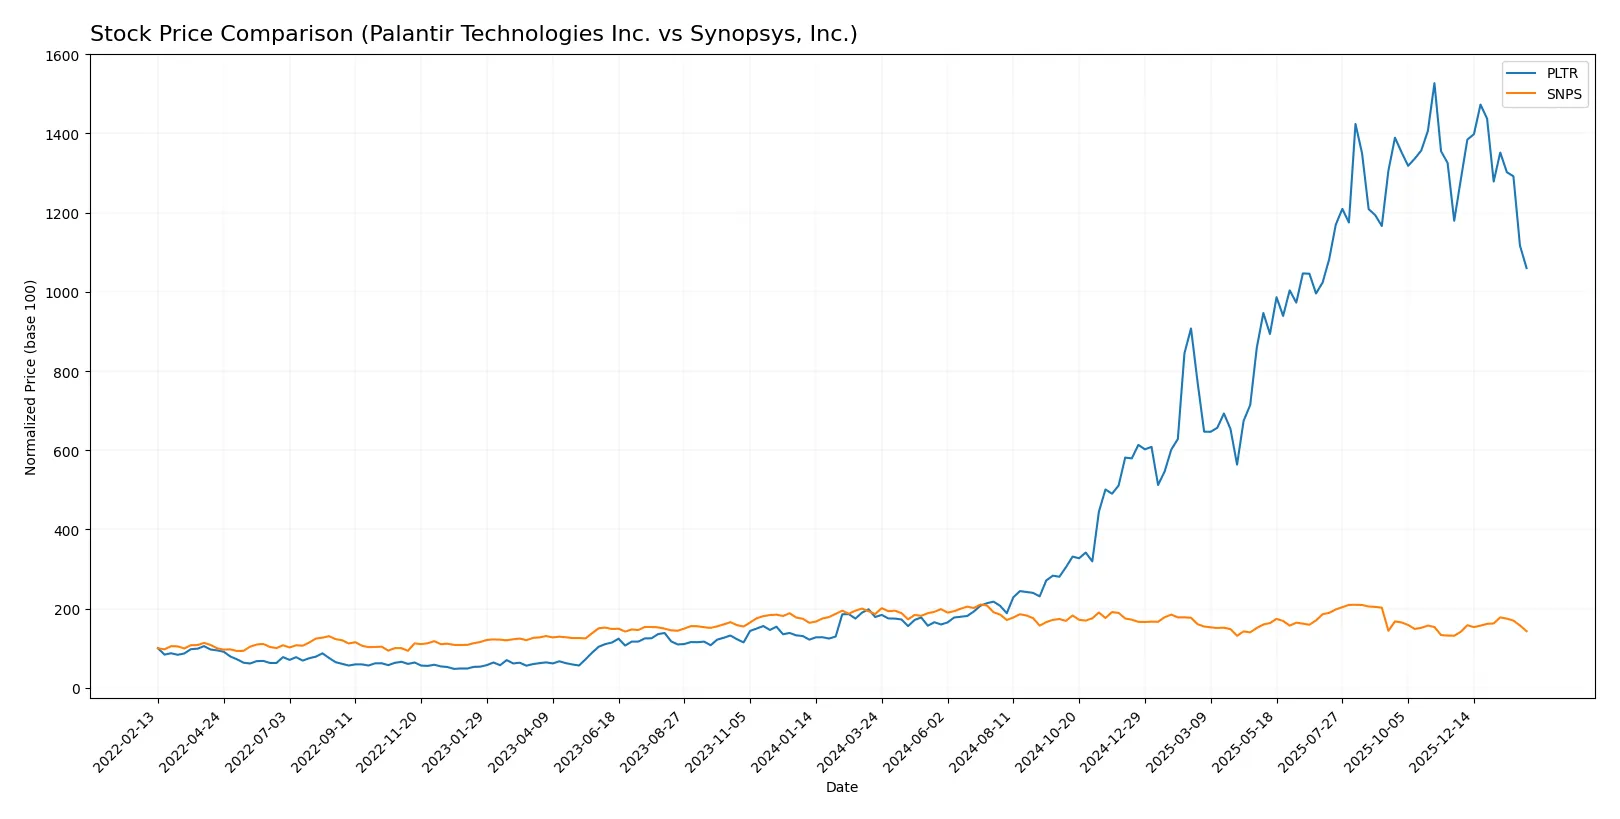
Trend Comparison
Palantir Technologies shows a strong bullish trend over the past 12 months, gaining 492.46%. The trend decelerates despite high volatility, with prices ranging from 20.47 to 200.47.
Synopsys, Inc. exhibits a bearish trend over the same period, dropping 23.17%. The decline accelerates amid similar volatility, with prices fluctuating between 388.13 and 621.3.
Palantir clearly outperforms Synopsys in market performance, delivering significantly higher gains throughout the year.
Target Prices
The consensus target prices for Palantir Technologies Inc. and Synopsys, Inc. suggest notable upside potential from current levels.
| Company | Target Low | Target High | Consensus |
|---|---|---|---|
| Palantir Technologies Inc. | 180 | 230 | 198.8 |
| Synopsys, Inc. | 425 | 600 | 530 |
Analysts expect Palantir’s shares to rise approximately 44% from $138.36, reflecting confidence in its growth trajectory. Synopsys trades near $421.30, with targets implying a 26% upside, indicating strong sector fundamentals and execution.

Don’t Let Luck Decide Your Entry Point
Optimize your entry points with our advanced ProRealTime indicators. You’ll get efficient buy signals with precise price targets for maximum performance. Start outperforming now!
How do institutions grade them?
Palantir Technologies Inc. Grades
The following table summarizes recent institutional grades for Palantir Technologies Inc.:
| Grading Company | Action | New Grade | Date |
|---|---|---|---|
| Citigroup | Maintain | Buy | 2026-02-03 |
| UBS | Maintain | Neutral | 2026-02-03 |
| DA Davidson | Maintain | Neutral | 2026-02-03 |
| Citigroup | Upgrade | Buy | 2026-01-12 |
| Morgan Stanley | Maintain | Equal Weight | 2025-11-04 |
| Piper Sandler | Maintain | Overweight | 2025-11-04 |
| Goldman Sachs | Maintain | Neutral | 2025-11-04 |
| Baird | Maintain | Neutral | 2025-11-04 |
| B of A Securities | Maintain | Buy | 2025-11-04 |
| UBS | Maintain | Neutral | 2025-11-04 |
Synopsys, Inc. Grades
This table shows the latest institutional grades assigned to Synopsys, Inc.:
| Grading Company | Action | New Grade | Date |
|---|---|---|---|
| Piper Sandler | Downgrade | Neutral | 2026-01-13 |
| Morgan Stanley | Maintain | Overweight | 2025-12-12 |
| Wells Fargo | Maintain | Equal Weight | 2025-12-11 |
| Keybanc | Maintain | Overweight | 2025-12-11 |
| JP Morgan | Maintain | Overweight | 2025-12-11 |
| Piper Sandler | Maintain | Overweight | 2025-12-11 |
| B of A Securities | Upgrade | Buy | 2025-12-11 |
| Needham | Maintain | Buy | 2025-12-11 |
| Rosenblatt | Maintain | Buy | 2025-12-11 |
| Rosenblatt | Upgrade | Buy | 2025-12-09 |
Which company has the best grades?
Synopsys, Inc. holds a stronger consensus with multiple recent Buy ratings and sustained Overweight positions. Palantir’s grades lean more neutral with fewer Buy endorsements. Investors may interpret Synopsys’s higher grades as greater institutional confidence, potentially influencing investment sentiment.
Risks specific to each company
In the challenging 2026 market environment, these categories highlight critical pressure points and systemic threats facing Palantir Technologies Inc. and Synopsys, Inc.:
1. Market & Competition
Palantir Technologies Inc.
- Faces fierce competition in data analytics and AI software, requiring constant innovation to maintain its edge.
Synopsys, Inc.
- Operates in a mature EDA software market with entrenched competitors; growth depends on expanding IP and security solutions.
2. Capital Structure & Debt
Palantir Technologies Inc.
- Very low debt-to-equity ratio (0.03), signaling strong financial stability and low leverage risk.
Synopsys, Inc.
- Moderate debt-to-equity ratio (0.5) increases financial risk but remains manageable.
3. Stock Volatility
Palantir Technologies Inc.
- High beta (1.687) indicates higher volatility and sensitivity to market swings.
Synopsys, Inc.
- Lower beta (1.126) suggests comparatively less stock volatility and market sensitivity.
4. Regulatory & Legal
Palantir Technologies Inc.
- Subject to scrutiny due to government contracts and data privacy concerns, which may lead to regulatory risks.
Synopsys, Inc.
- Faces regulatory challenges primarily in intellectual property and export controls impacting global operations.
5. Supply Chain & Operations
Palantir Technologies Inc.
- Relies heavily on software deployment; operational risks center on software delivery and client retention.
Synopsys, Inc.
- Complex supply chain for hardware-related IP and FPGA products; operational disruptions could affect delivery schedules.
6. ESG & Climate Transition
Palantir Technologies Inc.
- Increasing pressure to enhance ESG disclosures and data ethics policies amid growing investor scrutiny.
Synopsys, Inc.
- Faces ESG risks in energy-intensive manufacturing and supply chain sustainability initiatives.
7. Geopolitical Exposure
Palantir Technologies Inc.
- Exposure to geopolitical tensions due to government contracts in multiple countries, including the U.S. and U.K.
Synopsys, Inc.
- Global footprint subjects it to geopolitical risks, especially with export controls affecting semiconductor technology.
Which company shows a better risk-adjusted profile?
Palantir’s most impactful risk is its high stock volatility and regulatory scrutiny tied to government contracts. Synopsys contends mainly with moderate leverage and complex supply chains amid global geopolitical tensions. Palantir’s strong balance sheet and superior Altman Z-score position it with a better risk-adjusted profile despite volatility. Notably, Palantir’s debt-to-equity ratio at 0.03 contrasts sharply with Synopsys’ 0.5, underscoring its financial resilience in turbulent markets.
Final Verdict: Which stock to choose?
Palantir Technologies Inc. wields the superpower of rapid value creation through a soaring ROIC that significantly outpaces its cost of capital. Its robust income growth and cash generation mark it as a dynamic growth engine. The main point of vigilance is its sky-high valuation multiples, which could pressure returns if growth slows. It suits aggressive growth portfolios seeking high potential rewards amid volatility.
Synopsys, Inc. benefits from a strategic moat rooted in consistent, high-margin software solutions and recurring revenue streams. While its profitability metrics lag Palantir’s, it offers a safer balance sheet and steadier cash flows, appealing to investors favoring stability. It fits well in GARP portfolios that demand a blend of growth potential with reasonable financial prudence.
If you prioritize dynamic growth fueled by a clear competitive advantage and expanding profitability, Palantir outshines as the compelling choice due to its value-creating capital efficiency. However, if you seek better stability with a proven recurring revenue moat and moderate risk, Synopsys offers superior financial safety and steadier cash flow generation. Each scenario depends heavily on your risk tolerance and investment horizon.
Disclaimer: Investment carries a risk of loss of initial capital. The past performance is not a reliable indicator of future results. Be sure to understand risks before making an investment decision.
Go Further
I encourage you to read the complete analyses of Palantir Technologies Inc. and Synopsys, Inc. to enhance your investment decisions: