Home > Comparison > Technology > PLTR vs STNE
The strategic rivalry between Palantir Technologies Inc. and StoneCo Ltd. shapes the evolving landscape of technology infrastructure. Palantir operates as a data-driven software powerhouse focused on advanced analytics and intelligence solutions. StoneCo delivers fintech innovation by enabling seamless electronic commerce for SMEs in Brazil. This analysis pits Palantir’s platform-driven growth against StoneCo’s localized payments model to identify which offers superior risk-adjusted returns for a diversified portfolio.
Table of contents
Companies Overview
Palantir Technologies and StoneCo Ltd. stand as key players in software infrastructure with distinct market focuses and business models.
Palantir Technologies Inc.: Data Analytics Powerhouse
Palantir dominates the software infrastructure sector by delivering advanced data analytics platforms. Its revenue hinges on government and enterprise clients using Palantir Gotham and Foundry to analyze complex datasets for intelligence and operational efficiency. In 2026, Palantir sharpens its edge through AI integration and scalable deployment across diverse environments, reinforcing its competitive moat.
StoneCo Ltd.: Fintech Solutions Leader in Brazil
StoneCo commands the Brazilian fintech space by providing electronic commerce platforms to small and medium businesses. It earns mainly from transaction processing and technology services via Stone Hubs, offering hyper-local support. In 2026, StoneCo focuses on expanding merchant solutions and integrating digital and brick-and-mortar channels, seeking deeper market penetration amidst evolving payment landscapes.
Strategic Collision: Similarities & Divergences
Palantir and StoneCo both leverage software infrastructure but diverge in scope—Palantir targets global data intelligence, StoneCo local fintech commerce. Their rivalry centers on how technology drives client outcomes: Palantir champions data-driven decision frameworks; StoneCo prioritizes seamless payment ecosystems. These contrasts define their unique investment profiles—Palantir as a high-tech innovator, StoneCo as a regional commerce enabler.
Income Statement Comparison
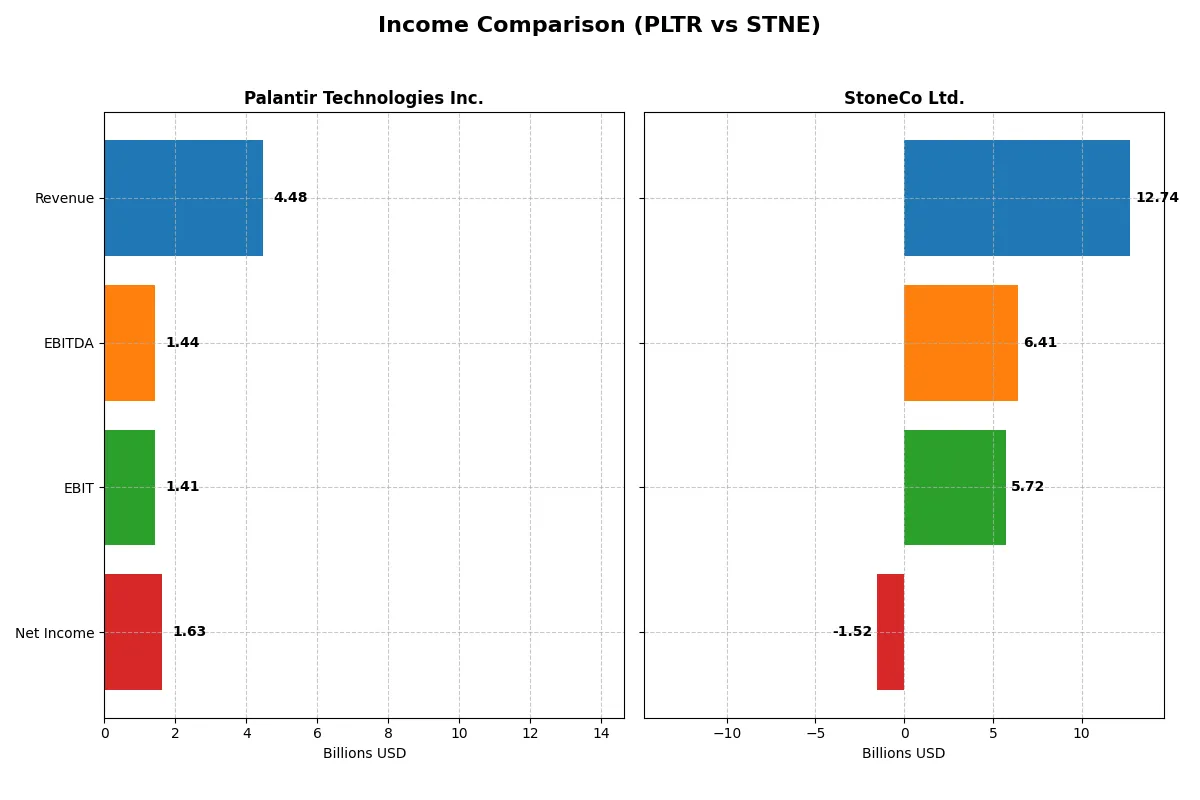
The following data dissects the core profitability and scalability of both corporate engines to reveal who dominates the bottom line:
| Metric | Palantir Technologies Inc. (PLTR) | StoneCo Ltd. (STNE) |
|---|---|---|
| Revenue | 4.48B | 12.74B |
| Cost of Revenue | 789M | 3.39B |
| Operating Expenses | 2.27B | 3.47B |
| Gross Profit | 3.69B | 9.35B |
| EBITDA | 1.44B | 6.41B |
| EBIT | 1.41B | 5.72B |
| Interest Expense | 0 | 1.06B |
| Net Income | 1.63B | -1.52B |
| EPS | 0.69 | -5.02 |
| Fiscal Year | 2025 | 2024 |
Income Statement Analysis: The Bottom-Line Duel
This income statement comparison reveals which company converts revenue into profits more efficiently and sustainably.
Palantir Technologies Inc. Analysis
Palantir’s revenue surged from $1.54B in 2021 to $4.48B in 2025, with net income turning sharply positive at $1.63B in 2025. Its gross margin remains strong above 82%, and net margin improved to 36.3%, signaling robust operational leverage and efficiency gains in the latest year.
StoneCo Ltd. Analysis
StoneCo expanded revenue from BRL 3.17B in 2020 to BRL 12.7B in 2024 but suffered a net loss of BRL 1.52B in 2024. Despite a healthy gross margin of 73.4% and a solid EBIT margin near 45%, negative net margins erode bottom-line profitability, reflecting significant interest expenses and other costs.
Margin Power vs. Revenue Scale
Palantir delivers superior margin expansion and net income growth, while StoneCo boasts larger revenue but struggles with profitability. Palantir stands out as the fundamental winner, showcasing a profile of efficient profit conversion. Investors seeking margin strength and accelerating earnings momentum will find Palantir’s profile more compelling.
Financial Ratios Comparison
These vital ratios act as a diagnostic tool to expose the underlying fiscal health, valuation premiums, and capital efficiency of the companies compared below:
| Ratios | Palantir Technologies Inc. (PLTR) | StoneCo Ltd. (STNE) |
|---|---|---|
| ROE | 22.0% | -12.9% |
| ROIC | 17.9% | 22.4% |
| P/E | 259.2 | -9.8 |
| P/B | 57.0 | 1.27 |
| Current Ratio | 7.11 | 1.37 |
| Quick Ratio | 7.11 | 1.37 |
| D/E (Debt-to-Equity) | 0.031 | 1.10 |
| Debt-to-Assets | 2.6% | 23.5% |
| Interest Coverage | 0 | 5.57 |
| Asset Turnover | 0.50 | 0.23 |
| Fixed Asset Turnover | 17.8 | 6.95 |
| Payout ratio | 0 | 0 |
| Dividend yield | 0 | 0 |
| Fiscal Year | 2025 | 2024 |
Efficiency & Valuation Duel: The Vital Signs
Financial ratios serve as a company’s DNA, unveiling hidden risks and operational excellence beneath headline figures.
Palantir Technologies Inc.
Palantir posts a robust 22% ROE and a strong 36.31% net margin, signaling operational efficiency. However, its sky-high P/E of 259.19 suggests an expensive valuation. Palantir retains earnings for growth and R&D, foregoing dividends, reflecting a long-term reinvestment strategy despite stretched valuation multiples.
StoneCo Ltd.
StoneCo shows a negative ROE at -12.87% and a net margin of -11.89%, highlighting profitability challenges. Its P/E ratio is negative but paired with a modest 1.27 PB ratio, indicating a cheaper valuation relative to book value. StoneCo currently pays no dividend, focusing on capital allocation to improve returns and operational efficiency.
Premium Valuation vs. Recovery Potential
Palantir balances strong profitability with a stretched valuation, posing higher risk for valuation correction. StoneCo offers a cheaper price but faces profitability headwinds. Palantir suits growth-oriented investors accepting valuation risk; StoneCo fits those seeking turnaround potential with operational improvement.
Which one offers the Superior Shareholder Reward?
Palantir Technologies (PLTR) and StoneCo Ltd. (STNE) both forgo dividends, focusing on reinvestment and buybacks. PLTR’s payout ratio is zero, with no dividend yield, but it generates strong free cash flow (0.89 per share) and maintains a robust buyback capacity supported by exceptional margins and liquidity. STNE also pays no dividend and reports negative free cash flow (-16.2 per share in 2024) with deteriorating operating cash flows, signaling limited buyback potential. PLTR’s disciplined capital allocation and near-zero debt create a sustainable model for long-term value. STNE’s heavy leverage and cash burn impair its shareholder reward outlook. I conclude PLTR offers a superior total return profile for 2026 investors.
Comparative Score Analysis: The Strategic Profile
The radar chart reveals the fundamental DNA and trade-offs of Palantir Technologies Inc. and StoneCo Ltd., highlighting their financial strengths and vulnerabilities:
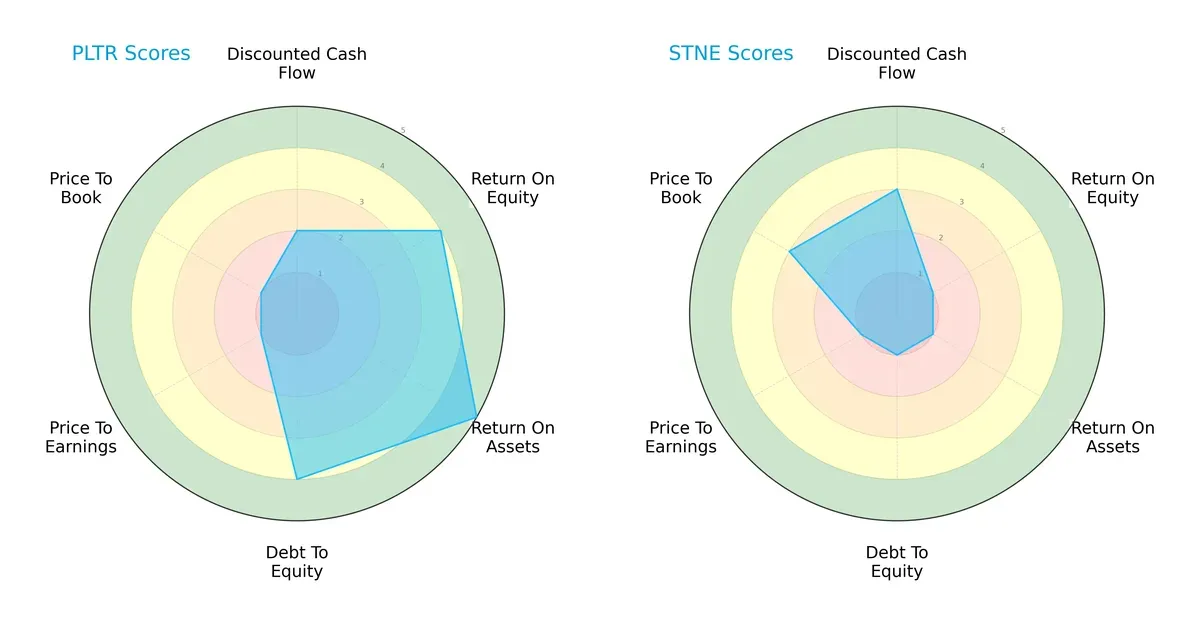
Palantir shows superior operational efficiency with high ROE (4) and ROA (5) scores, while maintaining a favorable debt-to-equity (4). StoneCo lags significantly in profitability and leverage metrics, scoring very low in ROE (1), ROA (1), and debt-to-equity (1). StoneCo’s DCF score (3) edges out Palantir’s (2), suggesting slightly better cash flow valuation. However, Palantir’s valuation scores (P/E and P/B both 1) indicate overvaluation risk, unlike StoneCo’s moderate P/B (3). Overall, Palantir presents a more balanced profile, relying on operational strength, while StoneCo depends more on valuation bargains amid weaker fundamentals.
Bankruptcy Risk: Solvency Showdown
Palantir’s Altman Z-Score (135.1) vastly outperforms StoneCo’s (1.0), signaling very strong solvency versus high bankruptcy risk for StoneCo in this cycle:
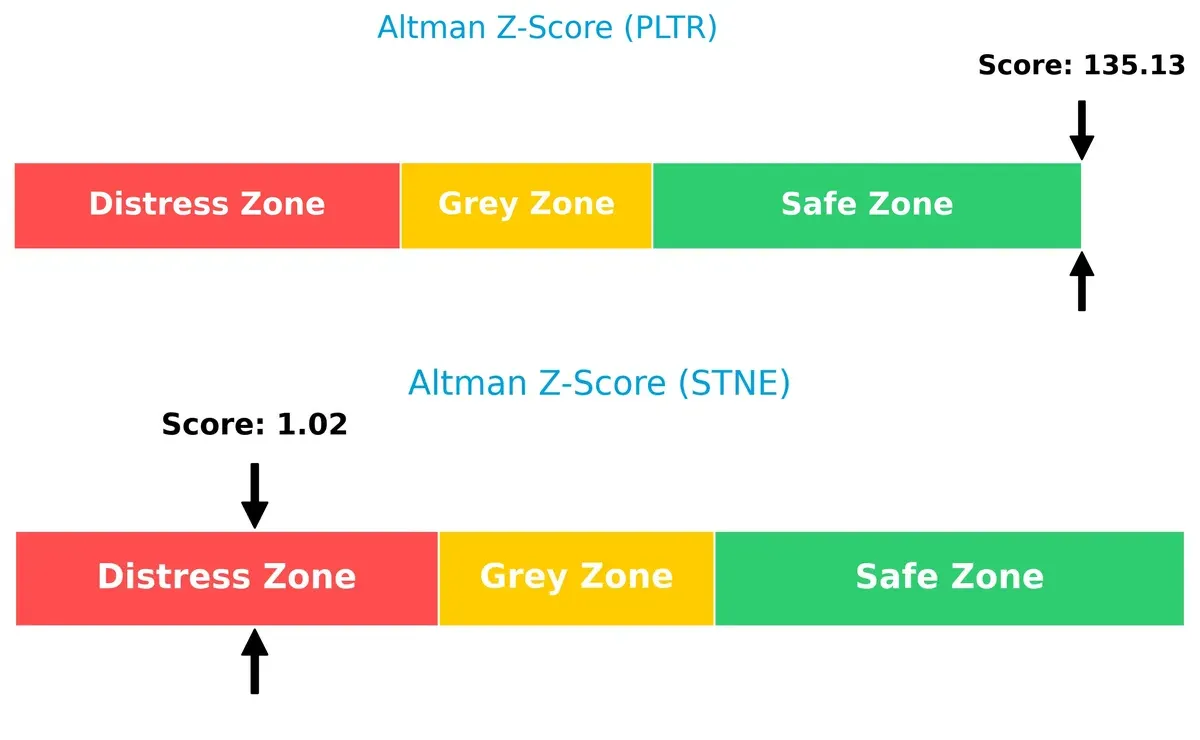
Palantir’s extremely high Z-Score places it safely in the “safe zone,” reflecting robust financial stability and low default risk. StoneCo’s score falls in the “distress zone,” indicating significant vulnerability to financial distress. This gulf reveals Palantir’s superior capital structure and earnings resilience compared to StoneCo’s precarious position.
Financial Health: Quality of Operations
Palantir’s Piotroski F-Score (7) surpasses StoneCo’s (5), showing stronger internal financial health and operational quality:
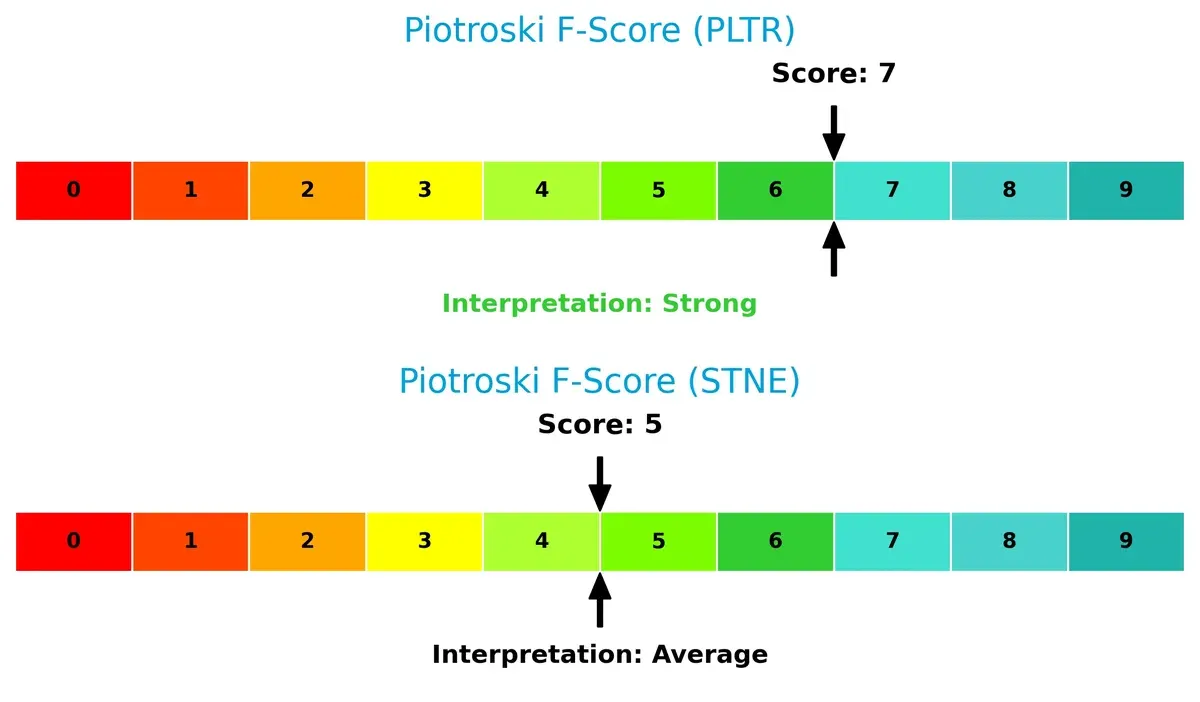
With a score of 7, Palantir demonstrates solid profitability, liquidity, and efficiency metrics consistent with strong financial discipline. StoneCo’s average score of 5 flags moderate internal strength but also raises caution about operational consistency and potential red flags. Investors should weigh StoneCo’s weaker fundamentals carefully against its valuation appeal.
How are the two companies positioned?
This section dissects the operational DNA of Palantir and StoneCo by comparing their revenue distribution and internal dynamics. The goal is to confront their economic moats, revealing which model offers a more resilient and sustainable advantage today.
Revenue Segmentation: The Strategic Mix
The following visual comparison dissects how Palantir Technologies Inc. and StoneCo Ltd. diversify their income streams and where their primary sector bets lie:
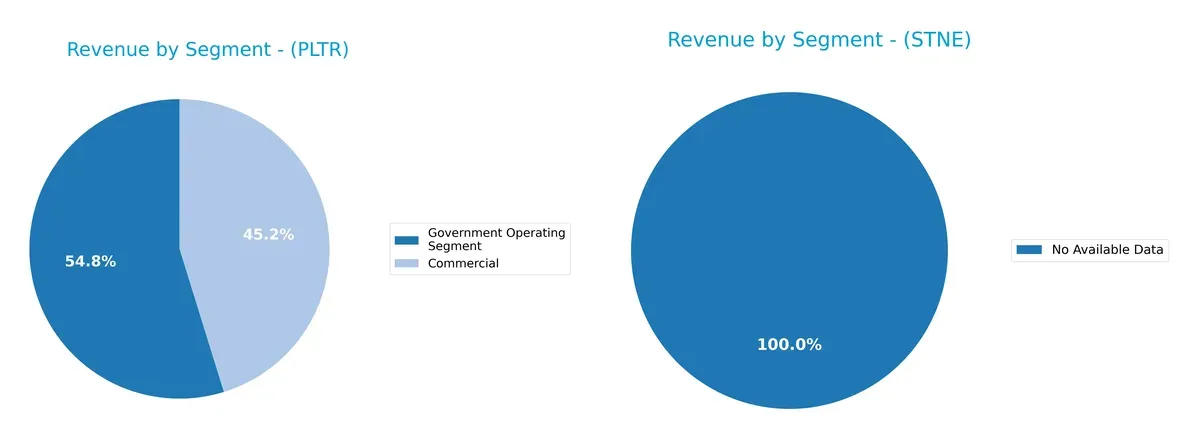
Palantir displays a clear dual focus, with government revenue reaching $1.57B and commercial at $1.30B in 2024. This mix signals a strong government ecosystem lock-in paired with expanding commercial presence. StoneCo lacks available data, preventing segmentation analysis. Palantir’s balanced revenue base reduces concentration risk and anchors its strategy in both public infrastructure and private enterprise software.
Strengths and Weaknesses Comparison
This table compares the Strengths and Weaknesses of Palantir Technologies Inc. and StoneCo Ltd.:
Palantir Strengths
- Strong profitability with 36% net margin
- High ROE at 22%
- Favorable ROIC above WACC
- Very low debt-to-assets at 2.58%
- High fixed asset turnover at 17.76
- Significant US and UK revenue presence
StoneCo Strengths
- Favorable ROIC at 22.41%
- Reasonable price-to-book at 1.27
- Favorable quick ratio and interest coverage
- Moderate debt-to-assets at 23.53%
- Positive fixed asset turnover at 6.95
Palantir Weaknesses
- Unfavorable high PE and PB ratios (259x and 57x)
- Unfavorable current ratio despite strong quick ratio
- WACC higher than ROIC
- No dividend yield
- Asset turnover only neutral
- Heavy reliance on US market
StoneCo Weaknesses
- Negative net margin and ROE indicating losses
- WACC above ROIC
- High debt-to-equity ratio at 1.1
- Low asset turnover at 0.23
- No dividend yield
- Limited geographic diversification data
Palantir’s strengths lie in its strong profitability and capital efficiency, offset by valuation concerns and market concentration. StoneCo shows operational strengths in capital returns but struggles with profitability and leverage, signaling strategic challenges ahead.
The Moat Duel: Analyzing Competitive Defensibility
A structural moat is the only thing protecting long-term profits from the erosion of competition. Let’s dissect how these firms defend their turf:
Palantir Technologies Inc.: Intangible Assets and Data Integration Moat
Palantir’s moat stems from proprietary software platforms that integrate complex data sources, securing high ROIC above WACC and margin stability. Expanding AI capabilities in 2026 could deepen this intangible asset moat.
StoneCo Ltd.: Cost Advantage and Localized Payment Network
StoneCo defends its niche through cost-efficient fintech solutions tailored for Brazilian SMEs, driving a strong ROIC and growing profitability. Its moat contrasts with Palantir’s by focusing on scale and operational efficiency. Expansion in digital commerce offers further growth.
Moat Face-Off: Intangibles vs. Cost Leadership in Tech Infrastructure
Both companies show very favorable moats with growing ROIC trends. Palantir’s intangible asset moat is deeper, driven by high-margin software and AI innovations. StoneCo’s cost advantage is robust but more vulnerable to market shifts. Palantir is better positioned to defend and extend its competitive edge in 2026.
Which stock offers better returns?
The past year saw Palantir Technologies Inc. exhibit strong price growth despite recent pullbacks, while StoneCo Ltd. experienced a modest decline overall with a recent upward shift in momentum.
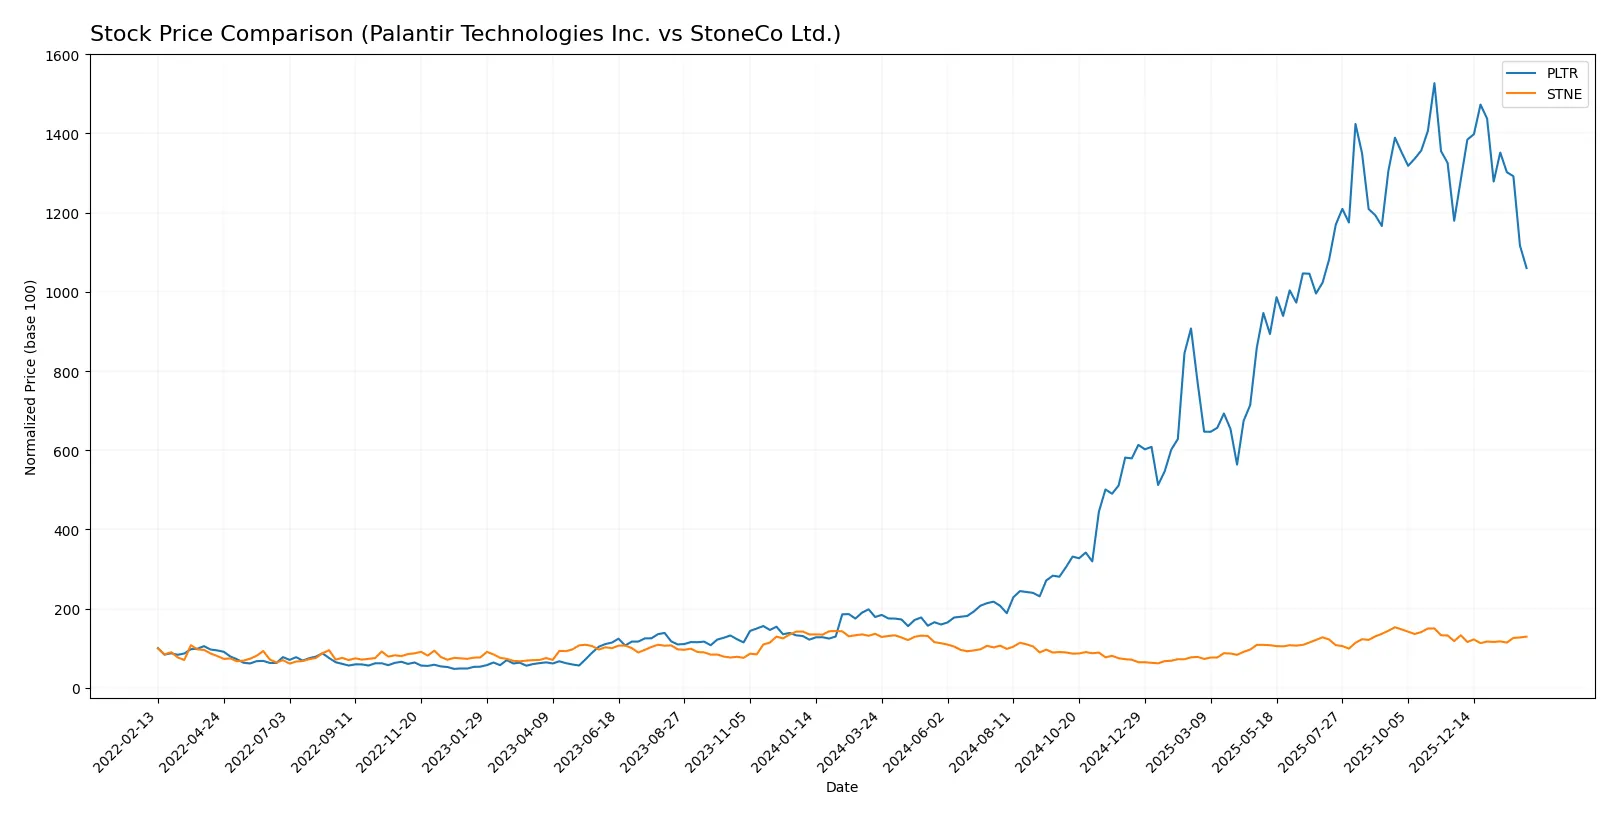
Trend Comparison
Palantir Technologies Inc. posted a 492.46% increase over 12 months, marking a bullish trend with decelerating gains. The stock ranged between 20.47 and 200.47, showing high volatility (std dev 59.55).
StoneCo Ltd. recorded a 5.18% decline over the same period, indicating a bearish trend with accelerating downward pressure. The price fluctuated between 7.85 and 19.40, with low volatility (std dev 2.9).
Palantir’s strong positive return contrasts with StoneCo’s mild decline, making Palantir the higher performer in market gains over the past year.
Target Prices
Analysts present a moderate upside potential for both Palantir Technologies Inc. and StoneCo Ltd.
| Company | Target Low | Target High | Consensus |
|---|---|---|---|
| Palantir Technologies Inc. | 180 | 230 | 198.8 |
| StoneCo Ltd. | 19 | 21 | 19.83 |
Palantir’s target consensus of 198.8 suggests roughly 44% upside from its current 137.84 price. StoneCo’s consensus of 19.83 implies a smaller 21% potential gain versus its 16.4 market price.

Don’t Let Luck Decide Your Entry Point
Optimize your entry points with our advanced ProRealTime indicators. You’ll get efficient buy signals with precise price targets for maximum performance. Start outperforming now!
How do institutions grade them?
Palantir Technologies Inc. Grades
The following table summarizes recent institutional grade actions for Palantir Technologies Inc.:
| Grading Company | Action | New Grade | Date |
|---|---|---|---|
| Citigroup | Maintain | Buy | 2026-02-03 |
| UBS | Maintain | Neutral | 2026-02-03 |
| DA Davidson | Maintain | Neutral | 2026-02-03 |
| Citigroup | Upgrade | Buy | 2026-01-12 |
| Morgan Stanley | Maintain | Equal Weight | 2025-11-04 |
| Piper Sandler | Maintain | Overweight | 2025-11-04 |
| Goldman Sachs | Maintain | Neutral | 2025-11-04 |
| Baird | Maintain | Neutral | 2025-11-04 |
| B of A Securities | Maintain | Buy | 2025-11-04 |
| UBS | Maintain | Neutral | 2025-11-04 |
StoneCo Ltd. Grades
The following table summarizes recent institutional grade actions for StoneCo Ltd.:
| Grading Company | Action | New Grade | Date |
|---|---|---|---|
| Goldman Sachs | Maintain | Buy | 2026-01-28 |
| UBS | Maintain | Buy | 2026-01-28 |
| Goldman Sachs | Maintain | Buy | 2025-10-14 |
| B of A Securities | Maintain | Buy | 2025-09-09 |
| UBS | Maintain | Buy | 2025-08-29 |
| JP Morgan | Maintain | Overweight | 2025-07-16 |
| Barclays | Maintain | Equal Weight | 2025-05-12 |
| Barclays | Maintain | Equal Weight | 2025-04-23 |
| Citigroup | Upgrade | Buy | 2025-04-22 |
| Morgan Stanley | Maintain | Underweight | 2025-03-21 |
Which company has the best grades?
StoneCo Ltd. consistently holds more “Buy” ratings from major institutions compared to Palantir, whose grades range from “Neutral” to “Buy.” This suggests stronger institutional confidence in StoneCo, potentially influencing investor sentiment positively.
Risks specific to each company
The following categories identify the critical pressure points and systemic threats facing both firms in the 2026 market environment:
1. Market & Competition
Palantir Technologies Inc.
- Strong position in software infrastructure with advanced AI integration but faces fierce competition from tech giants and emerging startups.
StoneCo Ltd.
- Operates in Brazil’s fintech with intense competition from global and local players, challenged by slower growth and regulatory shifts.
2. Capital Structure & Debt
Palantir Technologies Inc.
- Very low debt-to-equity ratio (0.03) and strong interest coverage, indicating minimal financial risk and solid balance sheet.
StoneCo Ltd.
- High debt-to-equity ratio (1.1) raises financial risk despite favorable debt-to-assets; interest coverage remains adequate but vulnerable.
3. Stock Volatility
Palantir Technologies Inc.
- Beta of 1.69 signals higher volatility than market average; wide price range (66.12-207.52) reflects investor uncertainty.
StoneCo Ltd.
- Higher beta of 1.79 shows even greater stock volatility; price range narrower but still notable, reflecting emerging market risks.
4. Regulatory & Legal
Palantir Technologies Inc.
- Subject to stringent US and international data privacy and national security regulations, increasing compliance costs and legal scrutiny.
StoneCo Ltd.
- Faces complex regulatory environment in Brazil, including fintech-specific rules and currency controls, adding operational uncertainty.
5. Supply Chain & Operations
Palantir Technologies Inc.
- Software-centric model limits supply chain risks; operational efficiency supported by strong asset turnover and tech innovation.
StoneCo Ltd.
- Relies on local infrastructure and partnerships; supply chain disruptions and local economic instability pose risks to operations.
6. ESG & Climate Transition
Palantir Technologies Inc.
- Increasing focus on AI ethics and data security; ESG initiatives are evolving but remain secondary to core technology development.
StoneCo Ltd.
- Growing pressure to improve ESG standards amid Brazil’s environmental scrutiny and social governance expectations.
7. Geopolitical Exposure
Palantir Technologies Inc.
- Mainly exposed to US and allied countries’ geopolitical tensions, especially related to defense and intelligence sectors.
StoneCo Ltd.
- High exposure to Brazil’s political and economic volatility, including currency risks and regional instability.
Which company shows a better risk-adjusted profile?
Palantir’s most impactful risk lies in market competition and valuation volatility, whereas StoneCo grapples chiefly with financial leverage and emerging market instability. Palantir’s superior Altman Z-score and Piotroski score confirm stronger financial health. StoneCo’s high debt and distress-zone Altman Z-score signal elevated bankruptcy risk. Palantir displays a better risk-adjusted profile, reinforced by its low debt and strong profitability despite valuation challenges.
Final Verdict: Which stock to choose?
Palantir Technologies’ superpower lies in its ability to generate exceptional returns on invested capital, signaling a robust and growing competitive moat. Its rapid income growth and cash generation impress, though high valuation multiples and an elevated current ratio warrant caution. It suits investors targeting aggressive growth with tolerance for premium pricing.
StoneCo’s strategic moat stems from its solid capital efficiency and recurring revenue streams within Brazil’s growing fintech space. Despite recent profitability challenges, it offers comparatively better balance sheet safety than Palantir, reflected in moderate leverage and interest coverage. It fits those seeking growth at a reasonable price with a focus on emerging markets.
If you prioritize transformative growth and can navigate valuation volatility, Palantir outshines with its expanding profitability and strong capital returns. However, if you seek more stability and a foothold in emerging fintech, StoneCo offers a safer capital structure and a more moderate entry point. Both demand careful risk assessment aligned with your investment horizon.
Disclaimer: Investment carries a risk of loss of initial capital. The past performance is not a reliable indicator of future results. Be sure to understand risks before making an investment decision.
Go Further
I encourage you to read the complete analyses of Palantir Technologies Inc. and StoneCo Ltd. to enhance your investment decisions: