Home > Comparison > Technology > PLTR vs PANW
The strategic rivalry between Palantir Technologies Inc. and Palo Alto Networks, Inc. shapes the trajectory of the software infrastructure sector. Palantir operates as a data-centric platform innovator focused on intelligence and analytics, while Palo Alto Networks dominates cybersecurity with extensive firewall and cloud security solutions. This head-to-head pits advanced data analytics against comprehensive security services. This analysis will identify which company offers a superior risk-adjusted outlook for a diversified portfolio in technology.

Table of contents
Companies Overview
Palantir Technologies and Palo Alto Networks dominate the software infrastructure landscape with distinct market roles and strategies.
Palantir Technologies Inc.: Data Integration Powerhouse
Palantir specializes in software platforms that enable intelligence and operational data analysis. Its revenue primarily stems from government and commercial clients using Palantir Gotham and Foundry to uncover hidden data patterns. In 2026, Palantir focuses heavily on expanding its AI-driven capabilities and flexible deployment via Palantir Apollo and its AI Platform.
Palo Alto Networks, Inc.: Cybersecurity Leader
Palo Alto Networks stands as a leading cybersecurity provider offering firewall solutions, threat prevention, and cloud security. Its core revenue comes from hardware, software, and subscription services across enterprises and governments. The company’s 2026 strategy emphasizes integrated security platforms and advanced threat intelligence to combat increasingly sophisticated cyber threats.
Strategic Collision: Similarities & Divergences
Both firms operate in software infrastructure but diverge sharply. Palantir builds a data-centric, AI-powered ecosystem while Palo Alto Networks delivers comprehensive cybersecurity defenses. Their competition centers on securing sensitive data—Palantir through insight generation, Palo Alto through protection. These contrasting approaches define distinct investment profiles: Palantir bets on analytics innovation; Palo Alto on security resilience.
Income Statement Comparison
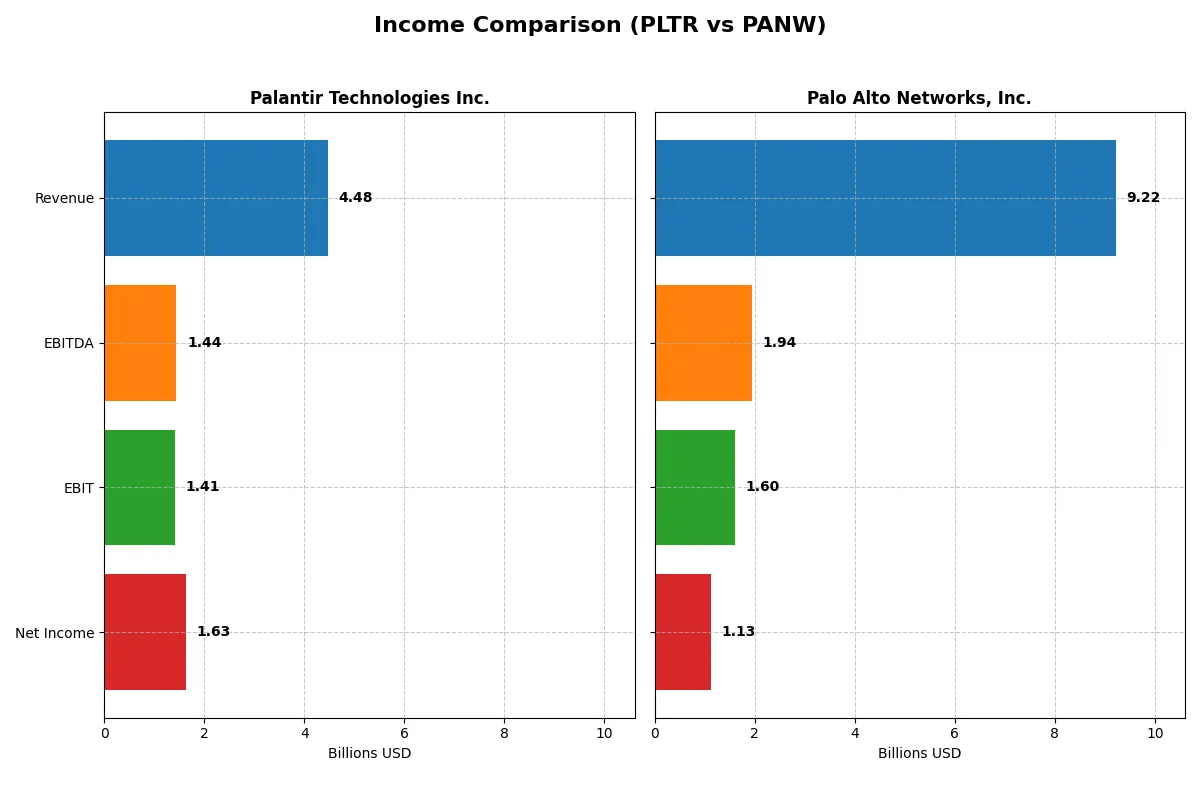
This data dissects the core profitability and scalability of both corporate engines to reveal who dominates the bottom line:
| Metric | Palantir Technologies Inc. (PLTR) | Palo Alto Networks, Inc. (PANW) |
|---|---|---|
| Revenue | 4.48B | 9.22B |
| Cost of Revenue | 789M | 2.45B |
| Operating Expenses | 2.27B | 5.53B |
| Gross Profit | 3.69B | 6.77B |
| EBITDA | 1.44B | 1.94B |
| EBIT | 1.41B | 1.60B |
| Interest Expense | 0 | 3M |
| Net Income | 1.63B | 1.13B |
| EPS | 0.69 | 1.71 |
| Fiscal Year | 2025 | 2025 |
Income Statement Analysis: The Bottom-Line Duel
This income statement comparison reveals which company runs a more efficient and profitable corporate engine in 2025.
Palantir Technologies Inc. Analysis
Palantir’s revenue soared from $2.2B in 2023 to $4.5B in 2025, with net income jumping from $210M to $1.63B. Its gross margin stands impressively at 82%, and net margin at 36%, both healthy and expanding. The latest year shows exceptional momentum, driven by scalable operations and strong cost control.
Palo Alto Networks, Inc. Analysis
Palo Alto’s revenue grew steadily from $6.9B in 2023 to $9.2B in 2025, with net income rising to $1.13B despite a dip in 2024. Its gross margin of 73% and net margin of 12% remain robust but trail Palantir’s efficiency. The company shows solid growth but faces margin pressure and uneven net income momentum.
Margin Leadership vs. Revenue Scale
Palantir outperforms with superior margins and rapid net income growth, delivering remarkable efficiency and profitability gains. Palo Alto Networks boasts higher revenue scale but lags in converting sales into bottom-line profits. For investors prioritizing margin strength and accelerating earnings, Palantir presents the more attractive profile in 2025.
Financial Ratios Comparison
These vital ratios act as a diagnostic tool to expose the underlying fiscal health, valuation premiums, and capital efficiency of the companies compared:
| Ratios | Palantir Technologies Inc. (PLTR) | Palo Alto Networks, Inc. (PANW) |
|---|---|---|
| ROE | 22.0% | 14.5% |
| ROIC | 18.0% | 5.7% |
| P/E | 259.2 | 101.4 |
| P/B | 57.0 | 14.7 |
| Current Ratio | 7.11 | 0.89 |
| Quick Ratio | 7.11 | 0.89 |
| D/E | 0.03 | 0.04 |
| Debt-to-Assets | 2.6% | 1.4% |
| Interest Coverage | 0 | 414.3 |
| Asset Turnover | 0.50 | 0.39 |
| Fixed Asset Turnover | 17.8 | 12.6 |
| Payout ratio | 0 | 0 |
| Dividend yield | 0 | 0 |
| Fiscal Year | 2025 | 2025 |
Efficiency & Valuation Duel: The Vital Signs
Financial ratios serve as a company’s DNA, uncovering hidden risks and operational strengths that shape investment outcomes.
Palantir Technologies Inc.
Palantir demonstrates robust profitability with a 22% ROE and a strong 36.3% net margin, signaling operational excellence. However, its valuation is stretched, with a P/E at 259 and P/B at 57, reflecting market optimism but potential overpricing. Palantir returns no dividends, instead reinvesting heavily in R&D to fuel growth.
Palo Alto Networks, Inc.
Palo Alto shows moderate profitability: 14.5% ROE and a 12.3% net margin, indicating solid but less aggressive returns. Its valuation at a P/E of 101 and P/B of 14.7 remains high, though less extreme than Palantir. The company also pays no dividends, focusing on R&D investment to support expansion and innovation.
Premium Valuation vs. Operational Safety
Palantir’s high profitability contrasts with its stretched valuation, posing greater risk but higher upside potential. Palo Alto offers a more balanced risk profile with decent returns and more reasonable valuation. Growth-oriented investors may prefer Palantir’s aggressive reinvestment, while cautious investors might lean toward Palo Alto’s steadier fundamentals.
Which one offers the Superior Shareholder Reward?
Palantir Technologies (PLTR) pays no dividends and allocates capital primarily to growth and R&D, maintaining a pristine balance sheet with negligible debt and soaring free cash flow per share at $0.89 in 2025. Its massive buyback programs remain absent, reflecting a reinvestment-first strategy. Palo Alto Networks (PANW) also skips dividends but executes aggressive share buybacks supported by $5.24 free cash flow per share in 2025, balancing moderate debt levels and a steady operating cash flow. I see PANW’s buyback intensity as a stronger driver for immediate shareholder returns, while PLTR’s growth reinvestment offers longer-term value but less near-term reward. In 2026, PANW offers a more attractive total return profile due to its robust buyback program and solid free cash flow generation, despite its higher leverage risk.
Comparative Score Analysis: The Strategic Profile
The radar chart reveals the fundamental DNA and trade-offs of Palantir Technologies Inc. and Palo Alto Networks, Inc., highlighting their financial strengths and vulnerabilities:
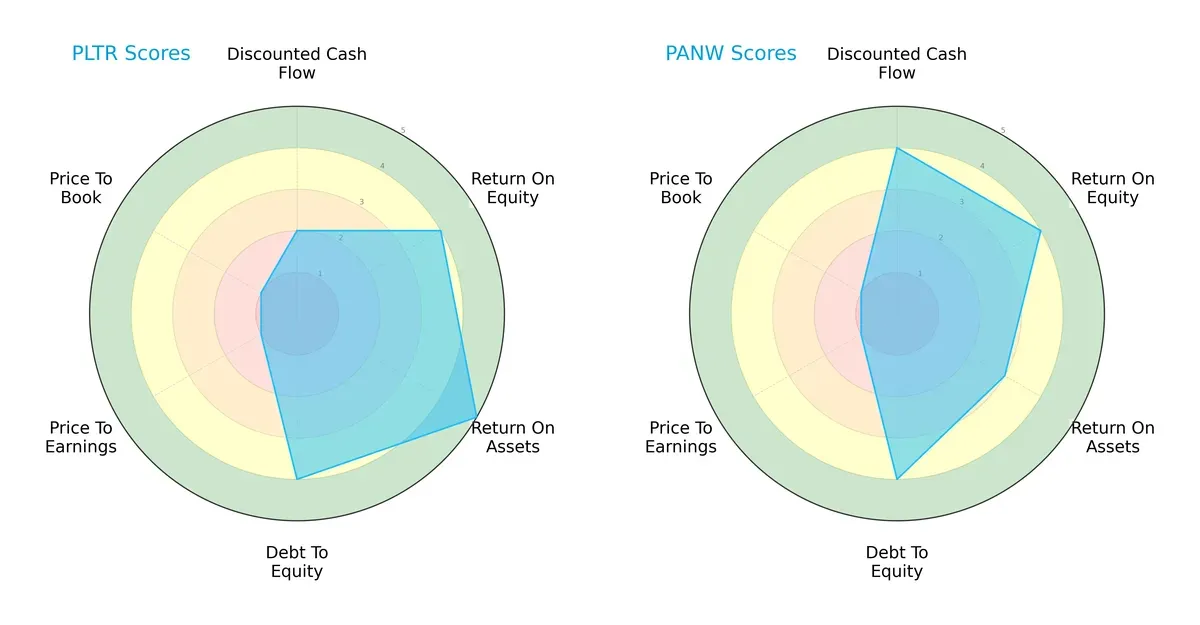
Palantir exhibits superior asset efficiency with a ROA score of 5 versus Palo Alto’s 3. Palo Alto leads in discounted cash flow with a 4 against Palantir’s 2, signaling better valuation prospects. Both share strong equity returns (ROE 4) and balanced leverage (Debt/Equity 4). However, both face valuation challenges reflected in very unfavorable P/E and P/B scores of 1. Palantir’s profile leans on operational efficiency, while Palo Alto benefits from cash flow strength, making Palantir slightly more balanced overall.
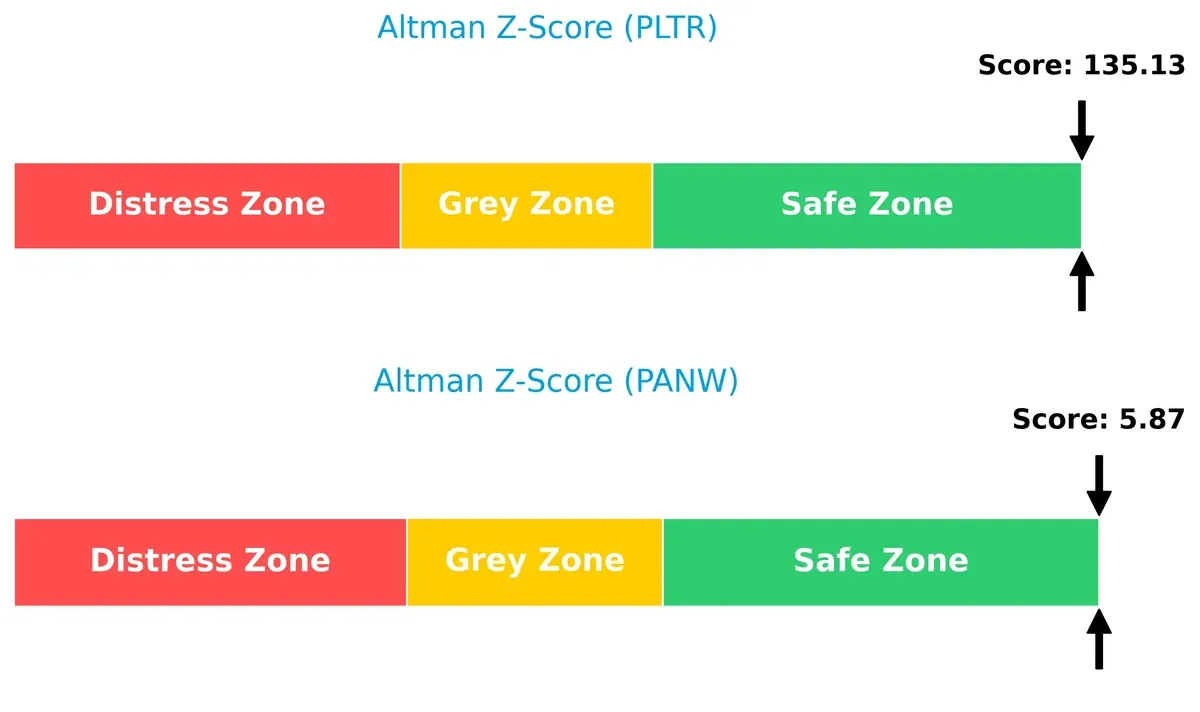
Bankruptcy Risk: Solvency Showdown
The Altman Z-Score difference underscores Palantir’s exceptional solvency at 135.1, far surpassing Palo Alto’s solid 5.9, signaling Palantir’s near-zero bankruptcy risk and robust long-term survival:
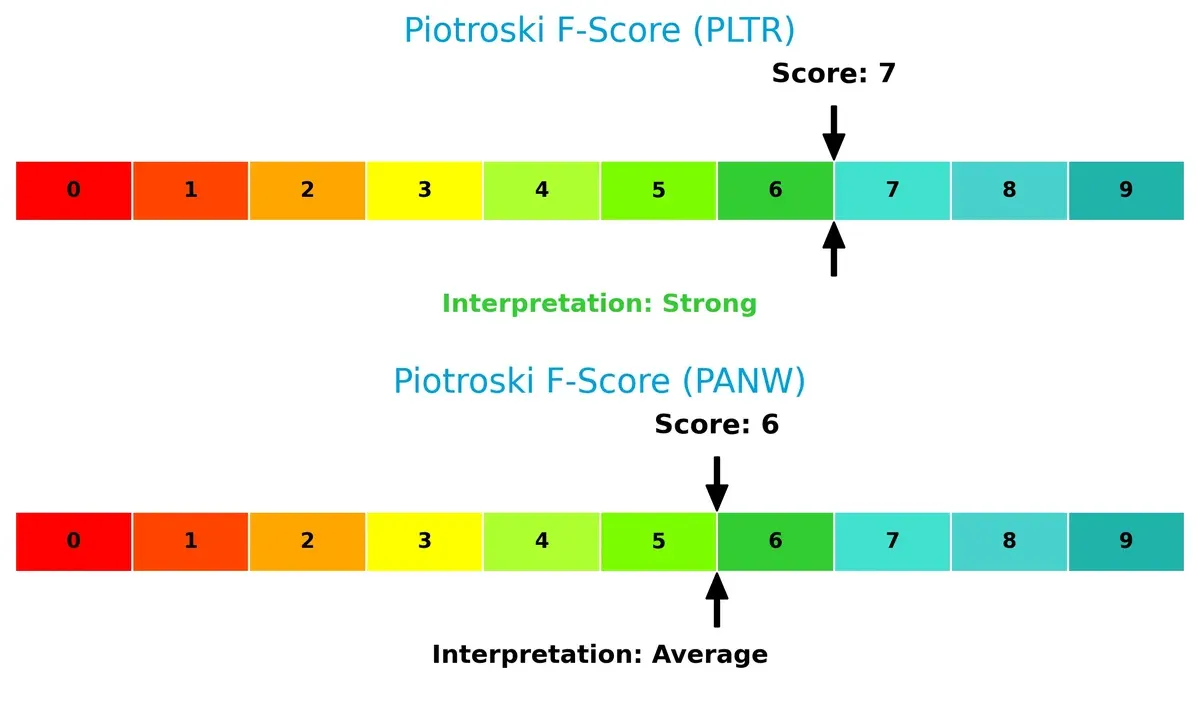
Financial Health: Quality of Operations
Palantir’s Piotroski F-Score of 7 versus Palo Alto’s 6 signals stronger internal financial health, with Palantir demonstrating fewer red flags in profitability, leverage, and liquidity metrics:
How are the two companies positioned?
This section dissects the operational DNA of Palantir and Palo Alto Networks by comparing their revenue distribution and internal strengths and weaknesses. The goal is to confront their economic moats to identify which model offers the most resilient, sustainable competitive advantage today.
Revenue Segmentation: The Strategic Mix
This visual comparison dissects how Palantir Technologies and Palo Alto Networks diversify their income streams and where their primary sector bets lie:
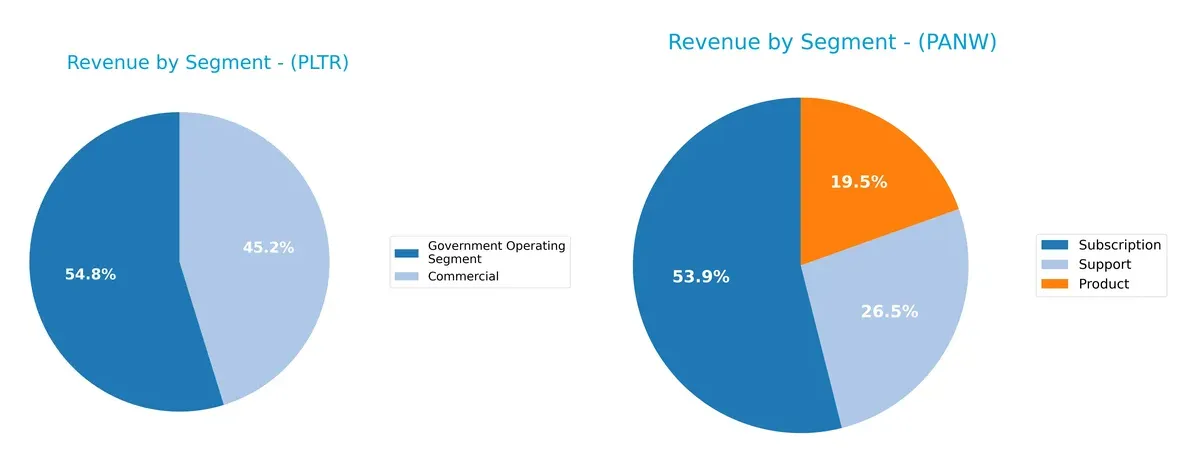
Palantir leans heavily on two segments: Government at $1.57B and Commercial at $1.30B, showing moderate diversification. Palo Alto Networks dwarfs with a tripartite mix: Subscription at $4.97B anchors its revenue, followed by Support at $2.45B and Product at $1.80B. Palo Alto’s broad base reduces concentration risk, while Palantir’s government reliance signals ecosystem lock-in but higher exposure to public sector shifts.
Strengths and Weaknesses Comparison
This table compares the strengths and weaknesses of Palantir Technologies Inc. (PLTR) and Palo Alto Networks, Inc. (PANW):
PLTR Strengths
- High net margin at 36.31%
- Strong ROE at 22.0%
- ROIC of 17.95% well above WACC
- Low debt-to-assets at 2.58%
- Robust quick ratio at 7.11
- Diverse revenue from commercial and government sectors
- Growing international sales including US, UK, Rest of World
PANW Strengths
- Positive net margin at 12.3%
- Favorable WACC at 7.36%
- Strong interest coverage at 532.53
- Low debt-to-assets at 1.43%
- Solid fixed asset turnover
- Diversified revenue streams: product, subscription, support
- Broad global footprint with strong Americas and EMEA presence
PLTR Weaknesses
- Unfavorable high P/E at 259.19 and P/B at 57.02
- Unfavorable current ratio at 7.11 indicating potential liquidity excess
- High WACC at 11.79%
- Zero dividend yield
- Moderate asset turnover at 0.5
- Heavy reliance on US for majority revenue
PANW Weaknesses
- Unfavorable current ratio below 1 at 0.89
- Neutral ROE and ROIC indicate average profitability
- Elevated P/E at 101.43 and P/B at 14.7
- Lower asset turnover at 0.39
- Zero dividend yield
- Subscription revenue dependent, less government exposure
Both companies show clear financial strengths in profitability and conservative leverage. PLTR excels in return metrics but faces valuation and liquidity concerns. PANW maintains operational efficiency and global diversification but shows some margin and liquidity constraints. These factors shape their strategic priorities in growth and capital management.
The Moat Duel: Analyzing Competitive Defensibility
A structural moat is the only thing protecting long-term profits from the erosion of competition. Let’s examine how Palantir and Palo Alto Networks defend their turf:
Palantir Technologies Inc.: Data Integration & AI-driven Switching Costs
Palantir’s moat stems from deep switching costs embedded in its AI-powered data platforms. Its very high ROIC (6.2% above WACC) and 214% ROIC growth confirm efficient capital use. New AI products in 2026 promise to deepen this advantage by locking in enterprise clients further.
Palo Alto Networks, Inc.: Security Ecosystem with Fragmented Value Capture
Palo Alto’s competitive edge lies in a broad cybersecurity ecosystem, distinct from Palantir’s data focus. Despite growing ROIC, it still sheds value versus WACC, signaling margin pressure. Market expansion in cloud security offers upside but also intensifies competition risk.
Verdict: AI-driven Switching Costs vs. Ecosystem Scale
Palantir’s wider moat emerges from superior value creation and durable switching costs. Palo Alto grows profitably but lacks the capital efficiency to defend aggressively. Palantir stands better equipped to protect market share amid intensifying sector competition.
Which stock offers better returns?
Stock prices for Palantir Technologies Inc. and Palo Alto Networks, Inc. showed strong overall growth but recent declines, with notable shifts in buyer dominance and trading volume trends over the past year.
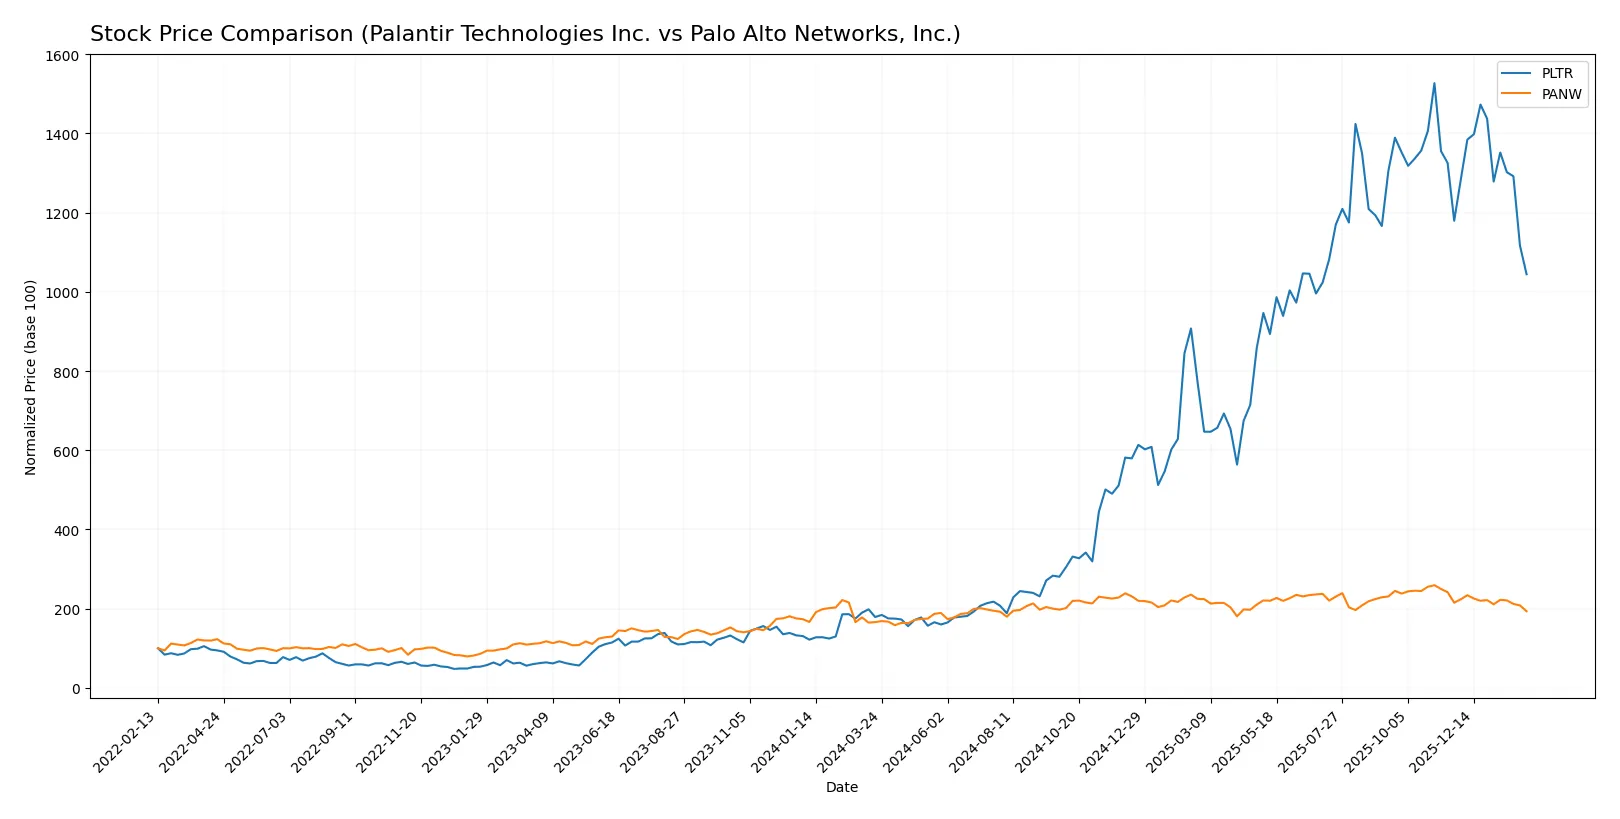
Trend Comparison
Palantir Technologies Inc. gained 483.8% over the past 12 months, marking a bullish trend with decelerating momentum and high volatility. Prices ranged from 20.47 to 200.47.
Palo Alto Networks, Inc. rose 16.6% over the same period, also bullish but with decelerating acceleration and lower volatility. The stock traded between 134.51 and 220.24.
Palantir outperformed Palo Alto Networks substantially, delivering the highest market return despite recent short-term declines in both stocks.
Target Prices
Analysts maintain a bullish outlook on Palantir Technologies Inc. and Palo Alto Networks, Inc., reflecting confident growth expectations.
| Company | Target Low | Target High | Consensus |
|---|---|---|---|
| Palantir Technologies Inc. | 180 | 230 | 198.8 |
| Palo Alto Networks, Inc. | 157 | 265 | 231.07 |
Target prices for both companies exceed current stock prices, signaling upside potential. This suggests analysts anticipate robust performance despite recent market pressures.

Don’t Let Luck Decide Your Entry Point
Optimize your entry points with our advanced ProRealTime indicators. You’ll get efficient buy signals with precise price targets for maximum performance. Start outperforming now!
How do institutions grade them?
The following tables summarize the recent grades assigned by major financial institutions for each company:
Palantir Technologies Inc. Grades
This table shows the latest grading actions from recognized firms for Palantir Technologies Inc.:
| Grading Company | Action | New Grade | Date |
|---|---|---|---|
| Citigroup | Maintain | Buy | 2026-02-03 |
| UBS | Maintain | Neutral | 2026-02-03 |
| DA Davidson | Maintain | Neutral | 2026-02-03 |
Palo Alto Networks, Inc. Grades
This table presents recent ratings from established grading companies for Palo Alto Networks, Inc.:
| Grading Company | Action | New Grade | Date |
|---|---|---|---|
| Needham | Maintain | Buy | 2026-01-28 |
| UBS | Maintain | Neutral | 2026-01-13 |
| Guggenheim | Upgrade | Neutral | 2026-01-05 |
Which company has the best grades?
Palantir Technologies holds a stronger consensus with multiple Buy and Neutral ratings, while Palo Alto Networks shows a mix of Buy and Neutral but a recent upgrade from Sell to Neutral. This suggests Palantir currently enjoys more favorable institutional views, potentially influencing investor confidence.
Risks specific to each company
The following categories identify critical pressure points and systemic threats facing Palantir Technologies Inc. and Palo Alto Networks, Inc. in the 2026 market environment:
1. Market & Competition
Palantir Technologies Inc.
- Faces intense competition from other data analytics and AI firms; high valuation pressures raise growth expectations.
Palo Alto Networks, Inc.
- Operates in a crowded cybersecurity market; moderate beta suggests lower market sensitivity but rising competition from cloud-native players.
2. Capital Structure & Debt
Palantir Technologies Inc.
- Extremely low debt (D/E 0.03) and strong interest coverage signal conservative leverage and financial stability.
Palo Alto Networks, Inc.
- Also maintains low debt (D/E 0.04) with robust interest coverage, but current ratio below 1 signals potential liquidity constraints.
3. Stock Volatility
Palantir Technologies Inc.
- Beta of 1.687 indicates high stock volatility, raising risk for short-term traders.
Palo Alto Networks, Inc.
- Beta of 0.75 suggests more stable stock price, appealing for risk-averse investors.
4. Regulatory & Legal
Palantir Technologies Inc.
- Operates with government contracts, exposing it to regulatory scrutiny and geopolitical shifts.
Palo Alto Networks, Inc.
- Cybersecurity industry faces evolving regulations, but diversified customer base mitigates concentrated legal risk.
5. Supply Chain & Operations
Palantir Technologies Inc.
- Software-centric business limits supply chain risk; operational execution critical for scaling AI platforms.
Palo Alto Networks, Inc.
- Hardware and software mix exposes it to supply chain disruptions, especially in semiconductor availability.
6. ESG & Climate Transition
Palantir Technologies Inc.
- Limited direct climate impact; ESG risks tied to data privacy and governance practices.
Palo Alto Networks, Inc.
- Increasing focus on sustainable cybersecurity and energy-efficient data centers aligns with ESG trends.
7. Geopolitical Exposure
Palantir Technologies Inc.
- Heavy reliance on U.S. government contracts creates exposure to geopolitical tensions and funding shifts.
Palo Alto Networks, Inc.
- Global enterprise footprint diversifies geopolitical risks but increases exposure to international regulatory changes.
Which company shows a better risk-adjusted profile?
Palantir’s highest risk lies in market volatility and dependency on government contracts, while Palo Alto Networks faces liquidity risks and supply chain vulnerabilities. Palantir’s strong balance sheet and superior profitability provide a better risk-adjusted profile despite its stock volatility. Recent data show Palantir’s current ratio at 7.11, reflecting exceptional liquidity, contrasting with Palo Alto’s below-par 0.89, signaling operational tightness.
Final Verdict: Which stock to choose?
Palantir Technologies Inc. (PLTR) impresses with its superpower of rapidly expanding profitability and strong capital efficiency, evidenced by a growing ROIC well above its cost of capital. Its main point of vigilance is the high valuation multiples, which could pressure returns if growth slows. This stock suits aggressive growth portfolios aiming to capitalize on breakthrough data analytics.
Palo Alto Networks, Inc. (PANW) commands a strategic moat rooted in its entrenched cybersecurity platform and steady recurring revenue. While its capital returns lag behind Palantir’s, it offers a more stable cash flow profile and lower relative valuation risk. This makes it attractive for GARP investors seeking growth balanced with reasonable price considerations.
If you prioritize aggressive expansion and superior value creation, Palantir outshines with its high ROIC and explosive margin improvement. However, if you seek better stability and a robust recurring revenue base, Palo Alto Networks offers a safer harbor with solid growth prospects. Each scenario involves weighing growth potential against valuation discipline and risk tolerance.
Disclaimer: Investment carries a risk of loss of initial capital. The past performance is not a reliable indicator of future results. Be sure to understand risks before making an investment decision.
Go Further
I encourage you to read the complete analyses of Palantir Technologies Inc. and Palo Alto Networks, Inc. to enhance your investment decisions: