In the dynamic landscape of software applications, Workday, Inc. and PagerDuty, Inc. stand out as innovators shaping enterprise technology. Both companies operate in the application software industry, with Workday focusing on cloud-based financial and human capital management, while PagerDuty excels in digital operations management powered by machine learning. This comparison explores their market strategies and growth potential to help you decide which company may offer the most compelling investment opportunity. Let’s dive in and evaluate their strengths together.
Table of contents
Companies Overview
I will begin the comparison between Workday and PagerDuty by providing an overview of these two companies and their main differences.
Workday Overview
Workday, Inc. provides enterprise cloud applications internationally, focusing on financial management, human capital management, planning, analytics, and reporting. Its solutions help organizations streamline operations, improve financial control, and enhance employee lifecycle management. Operating since 2005 and headquartered in Pleasanton, California, Workday serves diverse industries such as healthcare, education, government, and retail with a workforce of over 20K employees.
PagerDuty Overview
PagerDuty, Inc. operates a digital operations management platform that leverages machine learning to collect and analyze data from software-enabled systems worldwide. Founded in 2009 and based in San Francisco, California, PagerDuty serves industries including technology, telecommunications, retail, and financial services. The company employs about 1.2K people and focuses on real-time incident detection and resolution to optimize digital operations.
Key similarities and differences
Both Workday and PagerDuty operate in the software application industry, offering cloud-based technology solutions to improve business processes. While Workday emphasizes enterprise resource planning with broad applications in finance and human capital management, PagerDuty specializes in digital operations and incident management using machine learning. Their client bases overlap in technology sectors but differ in scale, with Workday being a larger, more diversified provider.
Income Statement Comparison
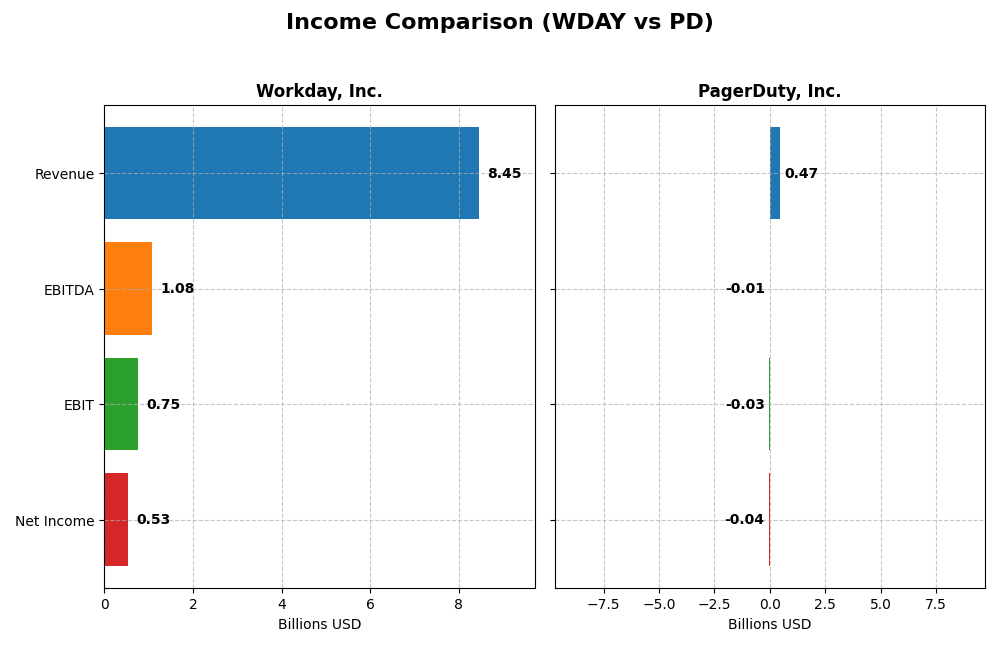
The table below compares the key income statement metrics for Workday, Inc. and PagerDuty, Inc. for the fiscal year 2025, highlighting their revenue, profitability, and earnings per share.
| Metric | Workday, Inc. (WDAY) | PagerDuty, Inc. (PD) |
|---|---|---|
| Market Cap | 49.9B | 1.0B |
| Revenue | 8.45B | 467M |
| EBITDA | 1.08B | -12M |
| EBIT | 752M | -32.5M |
| Net Income | 526M | -42.7M |
| EPS | 1.98 | -0.59 |
| Fiscal Year | 2025 | 2025 |
Income Statement Interpretations
Workday, Inc.
Workday’s revenue increased steadily from $4.32B in 2021 to $8.45B in 2025, nearly doubling over five years. Net income recovered from losses in 2021-2023 to $526M in 2025. Gross margin remained strong at 75.5%, while EBIT margin stabilized around 8.9%. The latest year showed favorable revenue and EBIT growth, though net margin and EPS declined sharply.
PagerDuty, Inc.
PagerDuty’s revenue nearly doubled from $214M in 2021 to $467M in 2025, with net losses narrowing to -$54M in 2025 from -$129M in 2023. Gross margins stayed high near 83%, but EBIT and net margins remained negative. The most recent year featured improved profitability metrics, including better net margin and EPS growth, reflecting operational progress despite ongoing losses.
Which one has the stronger fundamentals?
Both companies exhibit favorable revenue growth and gross margins, but Workday’s scale and positive net income contrast with PagerDuty’s persistent net losses. Workday shows strong overall margin improvement and higher net income growth, while PagerDuty’s progress is marked by margin recovery yet continued negative profitability. Hence, Workday demonstrates more robust income fundamentals based on the data.
Financial Ratios Comparison
Below is a comparison of key financial ratios for Workday, Inc. (WDAY) and PagerDuty, Inc. (PD) based on their most recent fiscal year 2025 data.
| Ratios | Workday, Inc. (WDAY) | PagerDuty, Inc. (PD) |
|---|---|---|
| ROE | 5.82% | -32.92% |
| ROIC | 2.73% | -9.66% |
| P/E | 132.15 | -39.87 |
| P/B | 7.69 | 13.12 |
| Current Ratio | 1.85 | 1.87 |
| Quick Ratio | 1.85 | 1.87 |
| D/E (Debt-to-Equity) | 0.37 | 3.57 |
| Debt-to-Assets | 18.70% | 50.00% |
| Interest Coverage | 3.64 | -6.46 |
| Asset Turnover | 0.47 | 0.50 |
| Fixed Asset Turnover | 5.36 | 16.61 |
| Payout Ratio | 0 | 0 |
| Dividend Yield | 0 | 0 |
Interpretation of the Ratios
Workday, Inc.
Workday exhibits a balanced profile with 43% favorable and 43% unfavorable ratios, resulting in a neutral overall evaluation. Its strong liquidity metrics and low leverage contrast with weak profitability measures like ROE and ROIC. The company does not pay dividends, reflecting a reinvestment strategy focused on growth and innovation rather than shareholder payouts.
PagerDuty, Inc.
PagerDuty shows an unfavorable ratio profile, with 57% unfavorable versus 36% favorable metrics. Despite solid liquidity and an efficient fixed asset turnover, it struggles with profitability and high debt levels. Like Workday, PagerDuty does not distribute dividends, likely prioritizing reinvestment and expansion during its growth phase.
Which one has the best ratios?
Between the two, Workday holds a more balanced ratio set with a neutral stance, while PagerDuty’s ratios lean clearly unfavorable due to weaker profitability and higher indebtedness. Workday’s mix of strong liquidity and manageable debt contrasts with PagerDuty’s financial challenges, making Workday comparatively stronger on these metrics.
Strategic Positioning
This section compares the strategic positioning of Workday, Inc. and PagerDuty, Inc., focusing on market position, key segments, and exposure to technological disruption:
Workday, Inc.
- Large market cap (~50B), operates in competitive enterprise cloud applications market.
- Key segments include subscription services (~7.7B) and professional services (~728M) driving growth.
- Provides advanced analytics, machine learning, and cloud solutions, adapting to technological changes.
PagerDuty, Inc.
- Smaller market cap (~1B), operates in digital operations management platform market.
- Focuses on digital signal data collection and machine learning for operational insights across industries.
- Leverages machine learning for predictive digital operations, exposed to evolving tech in software systems.
Workday, Inc. vs PagerDuty, Inc. Positioning
Workday shows a diversified business with large-scale subscription and professional services revenue, while PagerDuty concentrates on a niche digital operations platform. Workday’s broader industry reach contrasts with PagerDuty’s focused technology-driven approach.
Which has the best competitive advantage?
Both companies exhibit slightly unfavorable MOAT status with growing ROIC trends but currently destroy value. Workday’s larger scale and diversified revenue may offer more stability, whereas PagerDuty’s smaller scale faces greater competitive challenges.
Stock Comparison
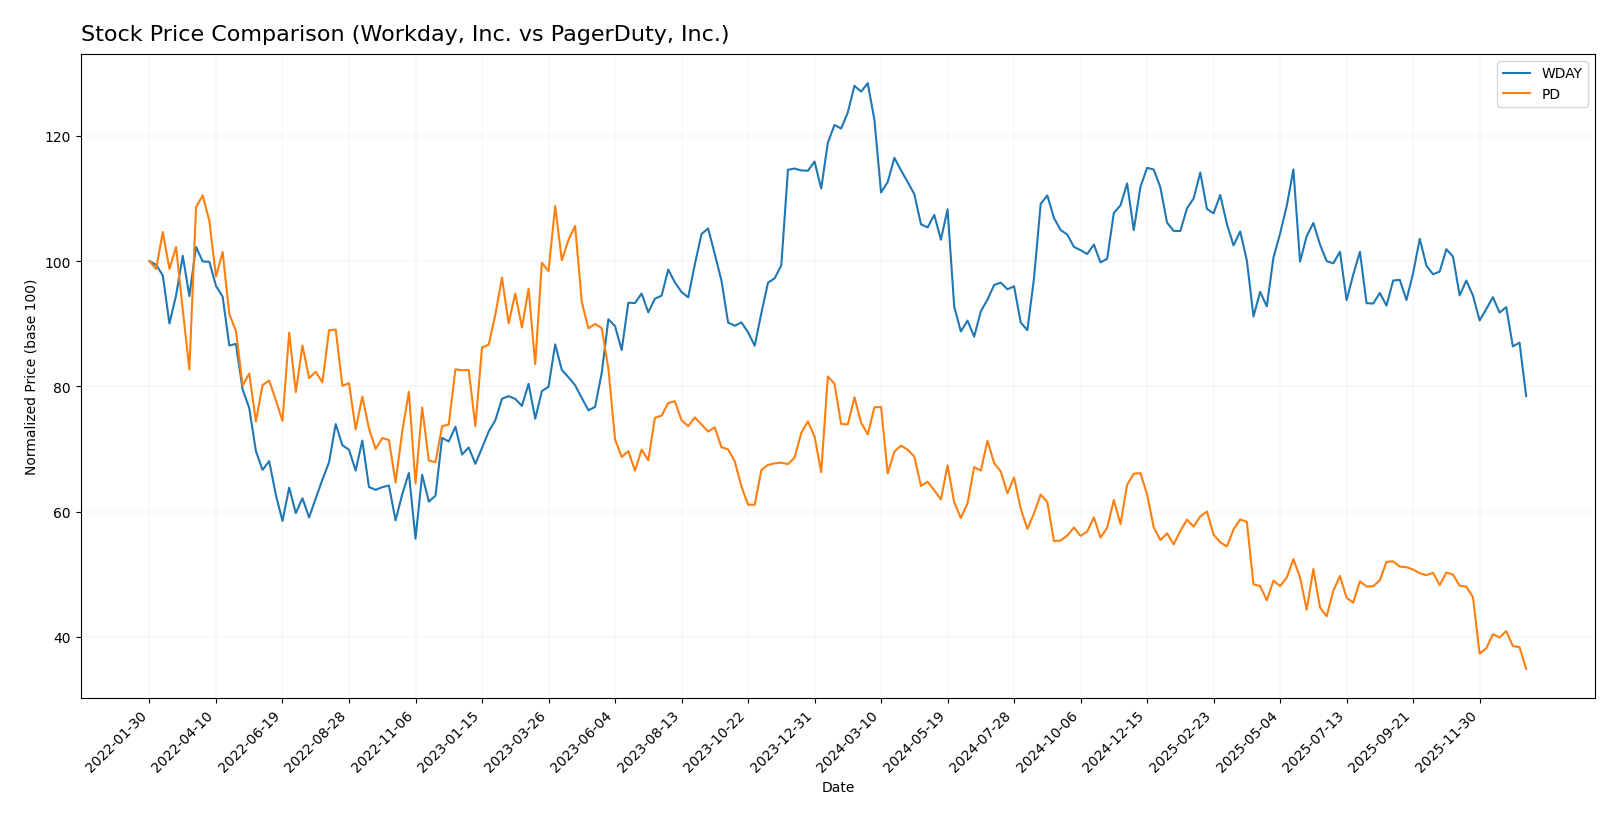
The stock price charts of Workday, Inc. (WDAY) and PagerDuty, Inc. (PD) reveal significant bearish trends over the past 12 months, marked by sharp declines and decelerating momentum in both cases.
Trend Analysis
Workday, Inc. (WDAY) experienced a -38.91% price decline over the past year, reflecting a bearish trend with decelerating downward momentum. The stock volatility was high, with a standard deviation of 20.22, peaking at 305.88 and bottoming at 186.86.
PagerDuty, Inc. (PD) showed a more pronounced bearish trend, losing -51.76% in value over the same 12-month period. The decline also decelerated, with lower volatility at a 2.92 standard deviation, and a price range from 24.66 to 11.22.
Comparing the two, Workday’s stock delivered a relatively better market performance than PagerDuty, experiencing a smaller percentage loss and higher volatility, though both showed clear bearish trends.
Target Prices
The current analyst target price consensus indicates potential upside for both Workday, Inc. and PagerDuty, Inc.
| Company | Target High | Target Low | Consensus |
|---|---|---|---|
| Workday, Inc. | 320 | 235 | 274.47 |
| PagerDuty, Inc. | 19 | 15 | 16.2 |
Analysts expect Workday’s stock to trade significantly higher than its current price of $186.86, while PagerDuty’s consensus target of $16.2 suggests moderate upside compared to its current price of $11.22.
Analyst Opinions Comparison
This section compares analysts’ ratings and financial scores for Workday, Inc. and PagerDuty, Inc.:
Rating Comparison
Workday, Inc. Rating
- Rating: B-, considered very favorable overall.
- Discounted Cash Flow Score: 4, favorable status.
- ROE Score: 3, moderate status for efficiency.
- ROA Score: 3, moderate asset utilization.
- Debt To Equity Score: 2, moderate financial risk.
- Overall Score: 2, moderate overall score.
PagerDuty, Inc. Rating
- Rating: A-, considered very favorable overall.
- Discounted Cash Flow Score: 5, very favorable status.
- ROE Score: 5, very favorable efficiency rating.
- ROA Score: 5, very favorable asset utilization.
- Debt To Equity Score: 1, very unfavorable financial risk.
- Overall Score: 4, favorable overall score.
Which one is the best rated?
PagerDuty, Inc. holds higher ratings and scores in discounted cash flow, ROE, ROA, and overall score, reflecting stronger financial metrics. However, its debt to equity score is less favorable compared to Workday, Inc., which presents a moderate risk profile.
Scores Comparison
Here is a comparison of the financial health scores for Workday, Inc. and PagerDuty, Inc.:
WDAY Scores
- Altman Z-Score: 4.41, indicating a safe zone and low bankruptcy risk.
- Piotroski Score: 6, reflecting average financial strength.
PD Scores
- Altman Z-Score: 1.26, indicating distress zone and high bankruptcy risk.
- Piotroski Score: 7, reflecting strong financial strength.
Which company has the best scores?
Workday shows a much stronger Altman Z-Score, placing it safely away from bankruptcy risk, while PagerDuty’s score signals distress. PagerDuty has a higher Piotroski Score, indicating better financial strength compared to Workday’s average rating.
Grades Comparison
I present the recent grades and rating consensus for Workday, Inc. and PagerDuty, Inc.:
Workday, Inc. Grades
The following table summarizes recent grades assigned to Workday, Inc. by recognized grading companies.
| Grading Company | Action | New Grade | Date |
|---|---|---|---|
| Barclays | Maintain | Overweight | 2026-01-12 |
| RBC Capital | Maintain | Outperform | 2026-01-05 |
| TD Cowen | Maintain | Buy | 2025-11-26 |
| DA Davidson | Maintain | Neutral | 2025-11-26 |
| Wells Fargo | Maintain | Overweight | 2025-11-26 |
| Barclays | Maintain | Overweight | 2025-11-26 |
| Keybanc | Maintain | Overweight | 2025-11-26 |
| Citigroup | Maintain | Neutral | 2025-11-26 |
| JP Morgan | Maintain | Overweight | 2025-11-26 |
| UBS | Maintain | Neutral | 2025-11-26 |
Workday, Inc.’s grades predominantly indicate a positive outlook, with multiple Overweight and Buy ratings and few Neutral assessments.
PagerDuty, Inc. Grades
Below is a summary of recent grades for PagerDuty, Inc. from established grading firms.
| Grading Company | Action | New Grade | Date |
|---|---|---|---|
| Truist Securities | Maintain | Buy | 2026-01-07 |
| RBC Capital | Downgrade | Sector Perform | 2026-01-05 |
| TD Cowen | Maintain | Buy | 2025-11-26 |
| Craig-Hallum | Downgrade | Hold | 2025-11-26 |
| Morgan Stanley | Maintain | Equal Weight | 2025-11-26 |
| RBC Capital | Maintain | Outperform | 2025-11-26 |
| Truist Securities | Maintain | Buy | 2025-11-19 |
| Baird | Maintain | Neutral | 2025-09-04 |
| RBC Capital | Maintain | Outperform | 2025-09-04 |
| Canaccord Genuity | Maintain | Buy | 2025-09-04 |
PagerDuty, Inc. shows a mixed rating trend with some downgrades and several Buy and Outperform ratings, reflecting a more cautious stance.
Which company has the best grades?
Workday, Inc. has received more consistently positive grades, predominantly Overweight and Buy, compared to PagerDuty, Inc., which has a more varied rating profile including downgrades. This difference may influence investors seeking more stable analyst confidence.
Strengths and Weaknesses
Below is a comparison of key strengths and weaknesses for Workday, Inc. (WDAY) and PagerDuty, Inc. (PD) based on the most recent financial and operational data.
| Criterion | Workday, Inc. (WDAY) | PagerDuty, Inc. (PD) |
|---|---|---|
| Diversification | Strong focus on subscription services (7.7B USD in 2025) with growing professional services segment (728M USD) | Limited product diversification, primarily software incident response |
| Profitability | Slightly unfavorable profitability; positive net margin (6.23%), but ROIC (2.73%) below WACC (8.86%) | Unfavorable profitability with negative net margin (-9.14%) and ROIC (-9.66%) |
| Innovation | Moderate; growing ROIC trend (+162%) suggests improving efficiency and innovation | Moderate; slight ROIC growth (+3.3%) but overall value destruction |
| Global presence | Established global footprint with consistent revenue growth in subscription services | Smaller scale with limited global footprint compared to WDAY |
| Market Share | Strong market share in enterprise HR and finance cloud software | Niche market leader in incident management, but smaller overall market share |
Key takeaways: Workday shows solid revenue growth and diversification within subscription and services, though profitability remains challenged with ROIC below cost of capital. PagerDuty faces profitability headwinds and higher leverage, but exhibits modest improvement in capital efficiency. Both companies have slightly unfavorable moats but growing ROIC trends, suggesting potential for future value creation with cautious risk management.
Risk Analysis
Below is a summary table of key risks for Workday, Inc. (WDAY) and PagerDuty, Inc. (PD) based on their latest financial and operational profiles in 2025-2026.
| Metric | Workday, Inc. (WDAY) | PagerDuty, Inc. (PD) |
|---|---|---|
| Market Risk | Beta 1.14; moderate market volatility exposure | Beta 0.63; lower market volatility exposure |
| Debt level | Debt/Equity 0.37; low financial leverage | Debt/Equity 3.57; high financial leverage |
| Regulatory Risk | Moderate; software industry compliance standard risks | Moderate; digital ops platform regulation evolving |
| Operational Risk | Medium; large workforce (20.5K) and complex cloud apps | Higher; smaller team (1.2K) but critical platform uptime needed |
| Environmental Risk | Low; primarily software-based, limited physical footprint | Low; software platform with limited direct environmental impact |
| Geopolitical Risk | Moderate; global presence with exposure to US and international markets | Moderate; international operations including US and Japan |
Synthesis: PagerDuty’s high debt level and negative profitability ratios elevate its financial risk, compounded by a low Altman Z-score indicating distress zone risk. Workday shows a safer financial position with moderate market risk and favorable liquidity, but faces operational complexity at scale. The most impactful risk for PagerDuty is financial distress, while for Workday it is market volatility and execution risk amid competition. Investors should weigh PagerDuty’s growth potential against its leverage risk and Workday’s stable but premium valuation.
Which Stock to Choose?
Workday, Inc. (WDAY) shows favorable income growth with a 16.35% revenue increase in 2025 and a strong overall income trend since 2021. Its financial ratios are mixed, with about 43% favorable and 43% unfavorable, supported by low debt levels and a very favorable rating of B-. Profitability is modest with a 6.23% net margin, and debt metrics are solid, reflecting financial stability.
PagerDuty, Inc. (PD) also demonstrates favorable income growth with an 8.54% revenue increase in 2025 and an overall positive income statement evaluation. However, its financial ratios are less favorable, with 57% unfavorable and only 36% favorable, and higher debt levels. Despite this, PD holds a very favorable rating of A-, with strong profitability challenges indicated by a negative net margin of -9.14%.
For investors, the choice might depend on risk tolerance: those seeking a company with more stable financial ratios and moderate profitability might view Workday as more suitable, while investors with a higher risk appetite focused on growth potential amid financial challenges could see PagerDuty as more appealing. Both companies show improving profitability despite value destruction, suggesting nuanced risk considerations.
Disclaimer: Investment carries a risk of loss of initial capital. The past performance is not a reliable indicator of future results. Be sure to understand risks before making an investment decision.
Go Further
I encourage you to read the complete analyses of Workday, Inc. and PagerDuty, Inc. to enhance your investment decisions: