In the dynamic world of technology, Uber Technologies, Inc. and PagerDuty, Inc. stand out as innovators within the software application industry. Both companies, headquartered in San Francisco, leverage cutting-edge platforms—Uber in mobility and delivery services, PagerDuty in digital operations management. Their overlapping focus on technological solutions and growth potential makes them compelling candidates for comparison. Join me as we explore which company offers the most attractive opportunity for investors today.

Table of contents
Companies Overview
I will begin the comparison between Uber Technologies, Inc. and PagerDuty, Inc. by providing an overview of these two companies and their main differences.
Uber Overview
Uber Technologies, Inc. develops and operates proprietary technology applications across multiple continents, connecting consumers with independent ride service providers and delivery services for meals, groceries, and other goods. Operating through Mobility, Delivery, and Freight segments, Uber aims to offer diverse transportation and logistics solutions. Founded in 2009 and headquartered in San Francisco, it holds a significant market presence with a large workforce of 31,100 employees.
PagerDuty Overview
PagerDuty, Inc. operates a digital operations management platform using machine learning to analyze data from software-enabled systems worldwide. Serving industries like technology, telecommunications, retail, and financial services, its platform focuses on predicting and resolving digital operational issues. Founded in 2009 and also based in San Francisco, PagerDuty is a smaller firm with 1,242 employees and an international client base.
Key similarities and differences
Both companies operate in the technology sector focusing on software applications, are headquartered in San Francisco, and were founded in 2009. While Uber’s business model centers on mobility, delivery, and freight services connecting providers to consumers, PagerDuty specializes in digital operations management using data analytics and machine learning. Uber’s scale is substantially larger in terms of market capitalization and workforce compared to PagerDuty’s more niche operational focus.
Income Statement Comparison
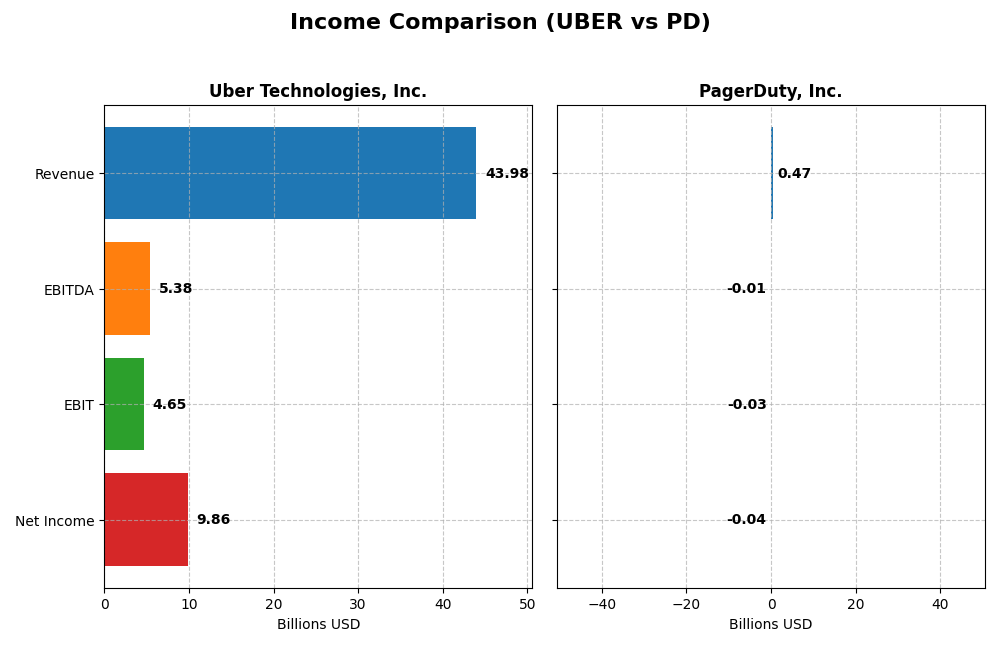
The table below presents a side-by-side comparison of the most recent fiscal year income statement metrics for Uber Technologies, Inc. and PagerDuty, Inc., reflecting their financial performance.
| Metric | Uber Technologies, Inc. | PagerDuty, Inc. |
|---|---|---|
| Market Cap | 176.3B | 1.03B |
| Revenue | 43.98B | 468M |
| EBITDA | 5.39B | -12M |
| EBIT | 4.65B | -32M |
| Net Income | 9.86B | -43M |
| EPS | 4.71 | -0.59 |
| Fiscal Year | 2024 | 2025 |
Income Statement Interpretations
Uber Technologies, Inc.
Uber demonstrated robust revenue growth from 2020 to 2024, with a 295% increase overall, reaching $44B in 2024. Net income turned strongly positive in the latest year at $9.8B, a significant recovery from previous losses. Margins improved considerably, with a gross margin of 39.4% and a net margin of 22.4%, reflecting enhanced profitability and operational efficiency in 2024.
PagerDuty, Inc.
PagerDuty showed steady revenue growth over 2021-2025, increasing by nearly 119% to $467M in 2025. Despite growth, the company remained unprofitable with a net loss of $43M in 2025, though net margin improved from prior years. Gross margin was high at 83%, but EBIT and net margins remained negative, signaling ongoing challenges in achieving sustainable operating profitability.
Which one has the stronger fundamentals?
Uber exhibits stronger fundamentals with consistent revenue and net income growth, positive margins across the board, and favorable income statement evaluations. PagerDuty, while growing revenues and gross profit, struggles to turn profits and maintain positive EBIT and net margins, reflecting higher operational risks. Uber’s financials indicate a more mature and profitable business model.
Financial Ratios Comparison
The table below presents a side-by-side comparison of key financial ratios for Uber Technologies, Inc. and PagerDuty, Inc., based on their most recent fiscal year data.
| Ratios | Uber Technologies, Inc. (2024) | PagerDuty, Inc. (2025) |
|---|---|---|
| ROE | 45.7% | -32.9% |
| ROIC | 6.8% | -9.7% |
| P/E | 12.8 | -39.9 |
| P/B | 5.9 | 13.1 |
| Current Ratio | 1.07 | 1.87 |
| Quick Ratio | 1.07 | 1.87 |
| D/E | 0.53 | 3.57 |
| Debt-to-Assets | 22.3% | 50.0% |
| Interest Coverage | 5.35 | -6.46 |
| Asset Turnover | 0.86 | 0.50 |
| Fixed Asset Turnover | 14.1 | 16.6 |
| Payout ratio | 0 | 0 |
| Dividend yield | 0 | 0 |
Interpretation of the Ratios
Uber Technologies, Inc.
Uber shows a balanced profile with 50% of its ratios rated favorable, including strong net margin (22.41%) and return on equity (45.72%). Some concerns arise from a high price-to-book ratio (5.86) and neutral return on invested capital (6.79%). The company does not pay dividends, likely prioritizing reinvestment and growth over shareholder payouts.
PagerDuty, Inc.
PagerDuty’s financial ratios indicate weaknesses, with 57.14% unfavorable metrics such as negative net margin (-9.14%) and poor return on equity (-32.92%). However, liquidity ratios like current ratio (1.87) and quick ratio (1.87) are favorable. The firm also does not distribute dividends, reflecting its focus on reinvestment and development amid losses.
Which one has the best ratios?
Uber holds a slightly favorable overall ratio profile with stronger profitability and coverage ratios despite some valuation concerns. PagerDuty faces significant challenges with multiple unfavorable profitability and leverage metrics. Therefore, Uber presents more favorable financial ratios compared to PagerDuty based on the available data.
Strategic Positioning
This section compares the strategic positioning of Uber Technologies, Inc. and PagerDuty, Inc., focusing on Market position, Key segments, and Exposure to technological disruption:
Uber Technologies, Inc.
- Large market cap with significant competitive pressure in mobility, delivery, and freight services worldwide.
- Three key segments: Mobility, Delivery, and Freight driving revenue growth, with Mobility as the largest.
- Exposure through proprietary technology platforms connecting consumers and providers in transport and delivery.
PagerDuty, Inc.
- Smaller market cap, operates in digital operations management across multiple industries with moderate competitive pressure.
- Focused on digital operations management platform serving software, telecom, retail, and financial sectors.
- Leverages machine learning in software-enabled system data for predictive digital operations management.
Uber Technologies, Inc. vs PagerDuty, Inc. Positioning
Uber pursues a diversified business model across multiple transportation and delivery segments, generating large-scale revenues but facing intense competition. PagerDuty concentrates on digital operations management, serving a variety of industries with a niche technological platform but smaller scale.
Which has the best competitive advantage?
Both companies exhibit slightly unfavorable moats, indicating value destruction despite growing profitability. Uber’s larger scale and diversified segments contrast with PagerDuty’s specialized platform, but neither currently demonstrates a strong sustainable competitive advantage.
Stock Comparison
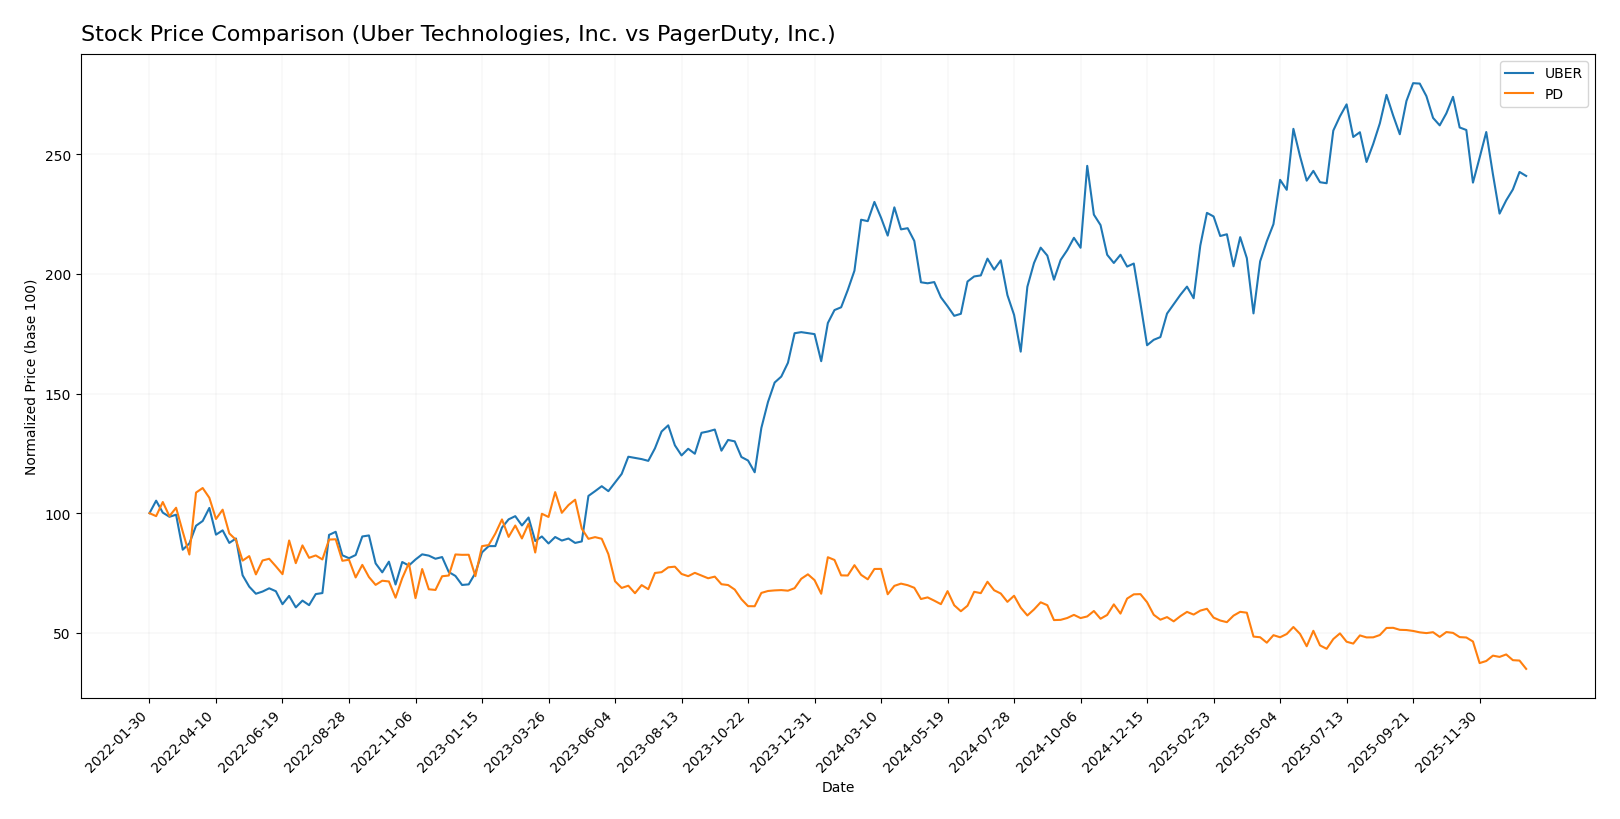
The past year shows contrasting price movements between Uber Technologies, Inc. and PagerDuty, Inc., with Uber exhibiting a bullish but decelerating trend, while PagerDuty faces a pronounced bearish trend amid shifting trading volumes.
Trend Analysis
Uber Technologies, Inc. recorded an 8.5% price increase over the past 12 months, indicating a bullish trend with decelerating momentum. Its price ranged from a low of 58.99 to a high of 98.51, supported by a high volatility of 10.29%.
PagerDuty, Inc. experienced a 51.76% price decline in the same period, reflecting a bearish trend with deceleration. Its price fluctuated between 11.22 and 24.66, with lower volatility at 2.92%.
Comparatively, Uber delivered the highest market performance over the past year, showing positive growth while PagerDuty’s stock sharply declined.
Target Prices
Analysts present a clear target price consensus for Uber Technologies, Inc. and PagerDuty, Inc.
| Company | Target High | Target Low | Consensus |
|---|---|---|---|
| Uber Technologies, Inc. | 140 | 73 | 111.26 |
| PagerDuty, Inc. | 19 | 15 | 16.2 |
The consensus target for Uber is significantly above its current price of $84.85, indicating bullish expectations, while PagerDuty’s consensus target at $16.2 also suggests upside potential compared to its current price of $11.22.
Analyst Opinions Comparison
This section compares analysts’ ratings and grades for Uber Technologies, Inc. and PagerDuty, Inc.:
Rating Comparison
Uber Rating
- Rating: B, assessed as Very Favorable by analysts.
- Discounted Cash Flow Score: 1, considered Very Unfavorable, indicating potential overvaluation.
- ROE Score: 5, Very Favorable, showing efficient profit generation from shareholders’ equity.
- ROA Score: 5, Very Favorable, demonstrating excellent asset utilization.
- Debt To Equity Score: 2, Moderate, indicating some financial risk but manageable debt levels.
- Overall Score: 3, Moderate, showing average financial standing.
PagerDuty Rating
- Rating: A-, also evaluated as Very Favorable.
- Discounted Cash Flow Score: 5, Very Favorable, suggesting strong future cash flow projections.
- ROE Score: 5, Very Favorable, equally strong in profit efficiency.
- ROA Score: 5, Very Favorable, matching strong asset use efficiency.
- Debt To Equity Score: 1, Very Unfavorable, reflecting higher financial risk from debt.
- Overall Score: 4, Favorable, indicating better overall financial health.
Which one is the best rated?
Based strictly on the provided data, PagerDuty holds a higher overall rating (A- vs. B) and better scores in discounted cash flow and overall assessment. However, Uber shows stronger debt-to-equity management, indicating lower financial risk.
Scores Comparison
Here is a comparison of the financial scores for Uber Technologies, Inc. and PagerDuty, Inc.:
Uber Scores
- Altman Z-Score: 4.44, indicating a safe financial zone with low bankruptcy risk.
- Piotroski Score: 6, reflecting average financial strength and investment quality.
PagerDuty Scores
- Altman Z-Score: 1.26, indicating financial distress and higher bankruptcy risk.
- Piotroski Score: 7, reflecting strong financial health and investment potential.
Which company has the best scores?
Uber has a significantly higher Altman Z-Score, placing it in a safer financial zone, while PagerDuty scores better on the Piotroski scale, indicating stronger financial health. Each company excels in different score categories based on the data provided.
Grades Comparison
Here is a comparison of the latest available grades for Uber Technologies, Inc. and PagerDuty, Inc.:
Uber Technologies, Inc. Grades
This table shows recent grades assigned by reputable grading companies to Uber Technologies, Inc.:
| Grading Company | Action | New Grade | Date |
|---|---|---|---|
| BTIG | Maintain | Buy | 2026-01-15 |
| Wells Fargo | Maintain | Overweight | 2026-01-08 |
| Cantor Fitzgerald | Maintain | Overweight | 2026-01-08 |
| Wolfe Research | Maintain | Outperform | 2026-01-06 |
| Wedbush | Maintain | Neutral | 2025-12-19 |
| Morgan Stanley | Maintain | Overweight | 2025-12-08 |
| Arete Research | Upgrade | Buy | 2025-12-03 |
| Wells Fargo | Maintain | Overweight | 2025-11-05 |
| Guggenheim | Maintain | Buy | 2025-11-05 |
| DA Davidson | Maintain | Buy | 2025-11-05 |
Overall, Uber has consistently received predominantly positive grades, with a strong bias toward Buy and Overweight ratings.
PagerDuty, Inc. Grades
This table shows recent grades assigned by reputable grading companies to PagerDuty, Inc.:
| Grading Company | Action | New Grade | Date |
|---|---|---|---|
| Truist Securities | Maintain | Buy | 2026-01-07 |
| RBC Capital | Downgrade | Sector Perform | 2026-01-05 |
| TD Cowen | Maintain | Buy | 2025-11-26 |
| Craig-Hallum | Downgrade | Hold | 2025-11-26 |
| Morgan Stanley | Maintain | Equal Weight | 2025-11-26 |
| RBC Capital | Maintain | Outperform | 2025-11-26 |
| Truist Securities | Maintain | Buy | 2025-11-19 |
| Baird | Maintain | Neutral | 2025-09-04 |
| RBC Capital | Maintain | Outperform | 2025-09-04 |
| Canaccord Genuity | Maintain | Buy | 2025-09-04 |
PagerDuty’s grades show a mixed trend with Buy ratings alongside several downgrades and Hold or Neutral assessments.
Which company has the best grades?
Uber Technologies, Inc. has received stronger and more consistent Buy and Overweight ratings compared to PagerDuty, Inc., which shows a more cautious and mixed grading profile. This difference suggests Uber is viewed more favorably by analysts, potentially reflecting greater confidence in its future performance, while PagerDuty exhibits higher uncertainty for investors.
Strengths and Weaknesses
Below is a comparison of key strengths and weaknesses for Uber Technologies, Inc. and PagerDuty, Inc. based on the most recent financial and operational data.
| Criterion | Uber Technologies, Inc. | PagerDuty, Inc. |
|---|---|---|
| Diversification | Strong revenue streams from Delivery (13.75B), Mobility (25.09B), and Freight (5.14B) segments | Limited diversification; primarily focused on digital operations management software |
| Profitability | Favorable net margin (22.41%), strong ROE (45.72%), but ROIC slightly below WACC (6.79% vs 9.17%) | Negative net margin (-9.14%), negative ROE (-32.92%), and ROIC well below WACC (-9.66% vs 5.85%) |
| Innovation | High fixed asset turnover (14.14), ongoing technology investments in mobility and delivery | Innovation-driven SaaS platform with growing ROIC, but profitability remains a challenge |
| Global presence | Extensive global footprint in ride-sharing, food delivery, and freight logistics | Primarily focused on enterprise clients, less global scale compared to Uber |
| Market Share | Leading market share in ride-hailing and food delivery globally | Niche player in incident response software with growing but smaller market share |
Uber’s diversified business model across multiple high-growth segments and strong profitability metrics position it well, despite a slightly unfavorable ROIC compared to WACC. PagerDuty shows promise with innovation and growing ROIC but faces significant profitability and leverage challenges. Investors should weigh Uber’s scale and profitability against PagerDuty’s growth potential and risk profile.
Risk Analysis
Below is a comparative overview of key risks for Uber Technologies, Inc. and PagerDuty, Inc. as of the most recent fiscal years.
| Metric | Uber Technologies, Inc. | PagerDuty, Inc. |
|---|---|---|
| Market Risk | Moderate (beta 1.20) | Lower (beta 0.63) |
| Debt level | Moderate (D/E 0.53) | High (D/E 3.57) |
| Regulatory Risk | Elevated (global operations, ride-sharing regulations) | Moderate (tech sector compliance) |
| Operational Risk | Moderate (multi-segment logistics and delivery) | Lower (digital platform focus) |
| Environmental Risk | Moderate (logistics and vehicle emissions) | Low (software service) |
| Geopolitical Risk | Moderate (global presence in 70+ countries) | Low (primarily US and Japan) |
Uber faces the most impactful risks from regulatory challenges and market volatility due to its global ride-sharing and delivery operations. PagerDuty’s greatest concern lies in its high debt level and financial distress risk, as indicated by its Altman Z-Score in the distress zone, despite strong operational metrics. Investors should weigh Uber’s regulatory exposure against PagerDuty’s financial leverage risk carefully.
Which Stock to Choose?
Uber Technologies, Inc. has shown strong income growth with a 295% revenue increase over five years and a 22.41% net margin in 2024. Financial ratios are slightly favorable, boasting a 45.7% ROE, moderate debt levels, and a solid interest coverage, while the overall rating is very favorable (B). Despite a slightly unfavorable MOAT indicating value destruction, Uber’s profitability trend is improving.
PagerDuty, Inc. presents a favorable income statement overall but with negative net margin (-9.14%) and ROE (-32.9%) in 2025. Its financial ratios are globally unfavorable, reflecting higher leverage and weaker profitability metrics, though with a very favorable rating (A-) and strong Piotroski score. The MOAT is slightly unfavorable, showing value destruction but a modestly growing ROIC.
Investors focused on growth and improving profitability might view Uber’s consistently favorable income and ratios as attractive, whereas those tolerant of risk and seeking high rating scores despite financial weaknesses may find PagerDuty’s profile more aligned with their strategy. The choice could depend on the investor’s risk tolerance and investment focus.
Disclaimer: Investment carries a risk of loss of initial capital. The past performance is not a reliable indicator of future results. Be sure to understand risks before making an investment decision.
Go Further
I encourage you to read the complete analyses of Uber Technologies, Inc. and PagerDuty, Inc. to enhance your investment decisions: