In the dynamic landscape of technology, Tyler Technologies, Inc. (TYL) and PagerDuty, Inc. (PD) stand out as influential players in software applications, yet they serve distinct but occasionally overlapping markets. Tyler focuses on integrated public sector solutions, while PagerDuty leads in digital operations management with AI-driven insights. Comparing their innovation strategies and market positions will help you decide which company holds the most promise for your investment portfolio. Let’s explore their potential together.
Table of contents
Companies Overview
I will begin the comparison between Tyler Technologies and PagerDuty by providing an overview of these two companies and their main differences.
Tyler Technologies Overview
Tyler Technologies, Inc. provides integrated information management solutions and services tailored for the public sector. With a focus on enterprise software, it delivers financial management, judicial, public safety, and property appraisal systems that automate government and educational institution processes. Founded in 1966 and headquartered in Plano, Texas, Tyler operates through multiple segments and maintains a strategic cloud hosting partnership with Amazon Web Services.
PagerDuty Overview
PagerDuty, Inc. operates a digital operations management platform that leverages machine learning to analyze data signals from software-enabled systems globally. Serving diverse industries such as technology, telecommunications, retail, and financial services, PagerDuty helps predict and resolve operational issues. Founded in 2009 and based in San Francisco, California, the company supports a broad international client base with its platform.
Key similarities and differences
Both Tyler Technologies and PagerDuty operate in the software application industry within the technology sector and trade on the NYSE. Tyler focuses on public sector solutions primarily in the US, providing extensive government and education software, while PagerDuty offers a machine learning-driven operations platform serving multiple industries worldwide. Tyler has a significantly larger market cap and workforce compared to PagerDuty, reflecting their scale and market focus differences.
Income Statement Comparison
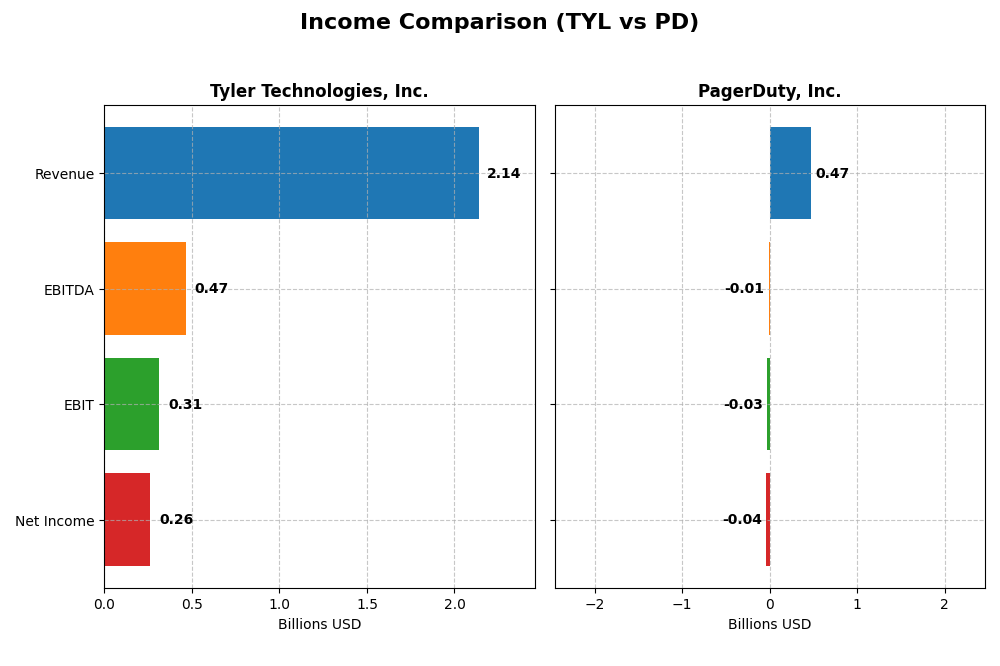
The table below compares the key income statement metrics of Tyler Technologies, Inc. and PagerDuty, Inc. for their most recent fiscal years, highlighting differences in revenue, profitability, and earnings per share.
| Metric | Tyler Technologies, Inc. (TYL) | PagerDuty, Inc. (PD) |
|---|---|---|
| Market Cap | 18.9B | 1.03B |
| Revenue | 2.14B | 467M |
| EBITDA | 466M | -12M |
| EBIT | 314M | -32.5M |
| Net Income | 263M | -43M |
| EPS | 6.17 | -0.59 |
| Fiscal Year | 2024 | 2025 |
Income Statement Interpretations
Tyler Technologies, Inc.
Tyler Technologies exhibited consistent revenue growth from $1.12B in 2020 to $2.14B in 2024, reflecting a 91.45% increase. Net income rose from $195M to $263M over the same period, despite a slight decline in net margin by 29.48%. The 2024 fiscal year showed solid growth with revenue up 9.53% and net margin improving to 12.3%, indicating strengthened profitability.
PagerDuty, Inc.
PagerDuty’s revenue climbed steadily from $214M in 2021 to $467M in 2025, an overall increase of 118.91%. Net income, although negative, improved significantly from a loss of $69M to a loss of $54M, with net margin rising by 71.67%. The latest year showed 8.54% revenue growth and a 33.71% EPS increase, suggesting operational improvements despite ongoing losses.
Which one has the stronger fundamentals?
Tyler Technologies demonstrates stronger fundamentals with positive net income, favorable margins, and high profitability growth over the period. PagerDuty shows robust revenue expansion and margin improvement but continues to operate at a net loss with negative EBIT margins. Tyler’s consistent earnings and margin stability contrast with PagerDuty’s improving yet still negative profitability metrics.
Financial Ratios Comparison
This table presents a side-by-side comparison of key financial ratios for Tyler Technologies, Inc. and PagerDuty, Inc. based on their latest fiscal year data, facilitating a clear evaluation of their financial performance and position.
| Ratios | Tyler Technologies, Inc. (TYL) 2024 | PagerDuty, Inc. (PD) 2025 |
|---|---|---|
| ROE | 7.76% | -32.92% |
| ROIC | 6.20% | -9.66% |
| P/E | 93.42 | -39.87 |
| P/B | 7.25 | 13.12 |
| Current Ratio | 1.35 | 1.87 |
| Quick Ratio | 1.35 | 1.87 |
| D/E (Debt-to-Equity) | 0.19 | 3.57 |
| Debt-to-Assets | 12.32% | 50.00% |
| Interest Coverage | 50.50 | -6.46 |
| Asset Turnover | 0.41 | 0.50 |
| Fixed Asset Turnover | 10.95 | 16.61 |
| Payout Ratio | 0% | 0% |
| Dividend Yield | 0% | 0% |
Interpretation of the Ratios
Tyler Technologies, Inc.
Tyler Technologies shows a mixed ratio profile with 50% favorable and 35.7% unfavorable metrics. While net margin (12.3%) and interest coverage (52.96) are strong, its high P/E (93.42) and P/B (7.25) ratios raise valuation concerns. The company pays no dividend, suggesting a focus on reinvestment rather than shareholder payouts.
PagerDuty, Inc.
PagerDuty displays a generally unfavorable ratio set, with 57.1% of metrics negative, including a net margin of -9.14% and return on equity at -32.92%. Its debt levels are high with a debt-to-equity of 3.57. No dividends are paid, consistent with its negative earnings and emphasis on growth and R&D investment.
Which one has the best ratios?
Tyler Technologies holds a more balanced and slightly favorable ratio profile, combining profitability and liquidity strengths despite valuation challenges. PagerDuty’s ratios reflect ongoing operational struggles and higher leverage, making its financial metrics less favorable in comparison.
Strategic Positioning
This section compares the strategic positioning of Tyler Technologies, Inc. and PagerDuty, Inc., including Market position, Key segments, and exposure to disruption:
Tyler Technologies, Inc.
- Leading public sector software provider with established market, facing moderate competitive pressure.
- Focuses on integrated public sector software: enterprise, appraisal and tax, SaaS, and services.
- Moderate exposure to cloud disruption with AWS collaboration; legacy public sector systems presence.
PagerDuty, Inc.
- Operates digital operations platform across industries, smaller market cap and higher competitive pressure.
- Concentrates on digital operations management platform using machine learning for diverse industry applications.
- High exposure to technological disruption through machine learning-driven platform in fast-evolving digital markets.
Tyler Technologies, Inc. vs PagerDuty, Inc. Positioning
Tyler Technologies adopts a diversified approach targeting public sector software solutions with multiple segments and services, providing stable revenue streams. PagerDuty’s concentrated focus on a digital operations platform offers growth potential but exposes it to rapid technological changes and competitive pressures.
Which has the best competitive advantage?
Both companies are currently value destroyers with ROIC below WACC; however, PagerDuty shows improving profitability trends, while Tyler Technologies faces declining returns, suggesting PagerDuty may have a slightly more favorable moat trajectory.
Stock Comparison
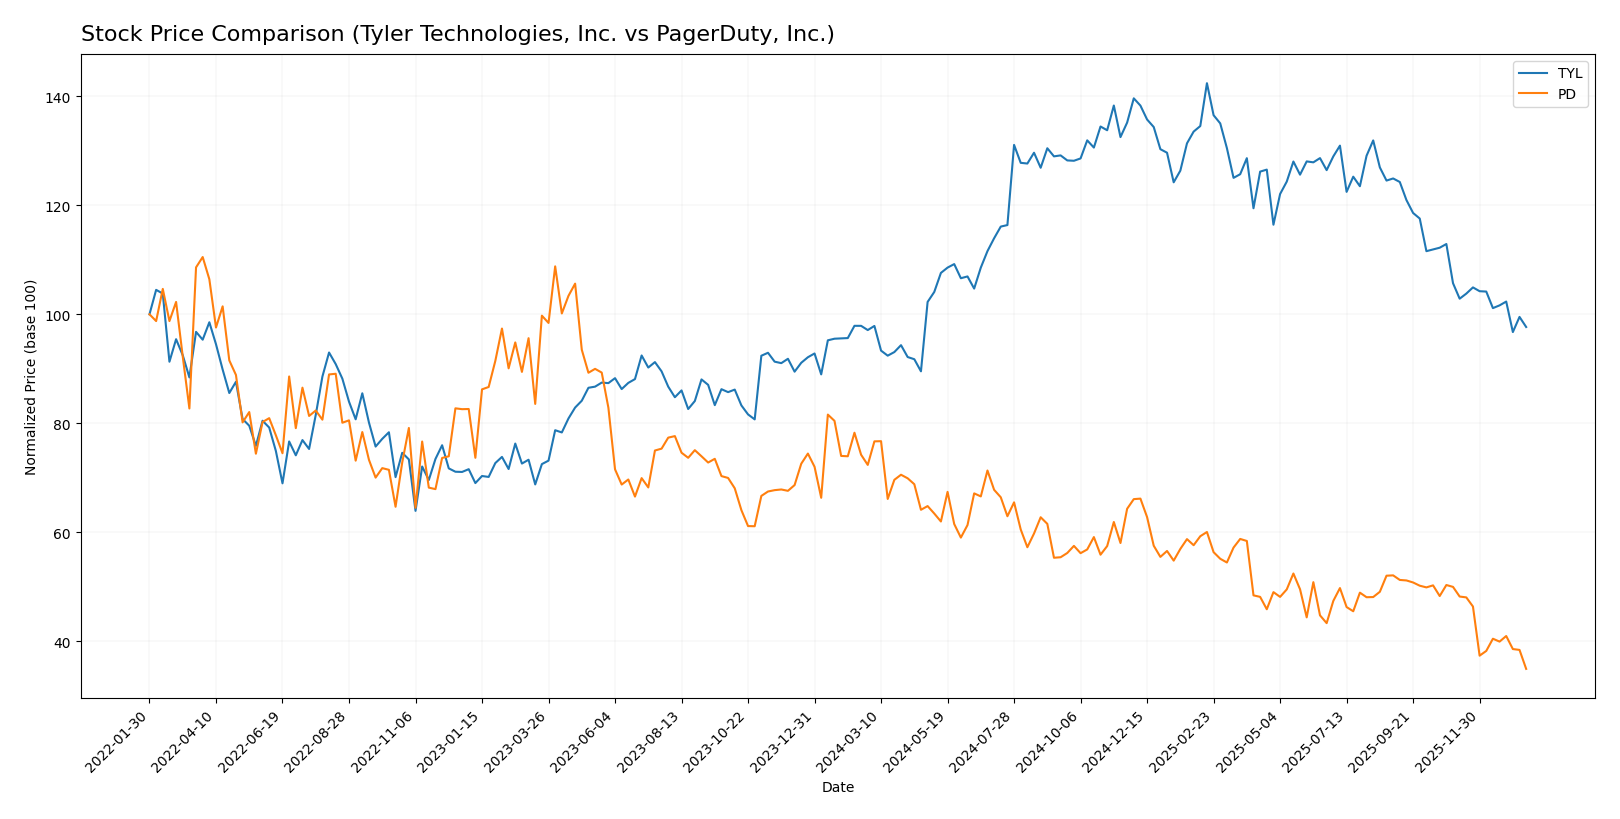
The stock price movements of Tyler Technologies, Inc. (TYL) and PagerDuty, Inc. (PD) over the past year reveal contrasting dynamics, with TYL showing marginal gains and PD experiencing significant declines amid shifting trading volumes.
Trend Analysis
Tyler Technologies, Inc. displayed a bullish trend over the past 12 months with a 0.58% price increase, though the trend shows deceleration. The stock fluctuated between 403.35 and 641.7, with notable volatility at 61.82 std deviation.
PagerDuty, Inc. experienced a bearish trend over the same period with a 51.76% price drop and deceleration in the downward trend. The price ranged from 11.22 to 24.66, with a low volatility level of 2.92 std deviation.
Comparing the two, Tyler Technologies outperformed PagerDuty, delivering a positive albeit slight market performance, while PagerDuty’s stock significantly declined over the past year.
Target Prices
The current analyst consensus on target prices shows varied upside potential for Tyler Technologies and PagerDuty.
| Company | Target High | Target Low | Consensus |
|---|---|---|---|
| Tyler Technologies, Inc. | 675 | 470 | 584 |
| PagerDuty, Inc. | 19 | 15 | 16.2 |
Analysts expect Tyler Technologies to trade significantly above its current price of 440.01 USD, reflecting confidence in growth. PagerDuty’s consensus target of 16.2 USD indicates moderate upside from its current 11.22 USD market price.
Analyst Opinions Comparison
This section compares analysts’ ratings and grades for Tyler Technologies, Inc. and PagerDuty, Inc.:
Rating Comparison
TYL Rating
- Rating: B, considered very favorable by analysts.
- Discounted Cash Flow Score: 4, favorable valuation.
- ROE Score: 3, moderate efficiency in equity use.
- ROA Score: 4, favorable asset utilization.
- Debt To Equity Score: 3, moderate financial risk.
- Overall Score: 3, moderate overall financial standing.
PD Rating
- Rating: A-, also very favorable.
- Discounted Cash Flow Score: 5, very favorable.
- ROE Score: 5, very favorable profit generation.
- ROA Score: 5, very favorable asset utilization.
- Debt To Equity Score: 1, very unfavorable balance sheet.
- Overall Score: 4, favorable overall financial standing.
Which one is the best rated?
Based strictly on the provided data, PagerDuty holds a better rating overall, with higher scores in discounted cash flow, ROE, ROA, and overall score despite a less favorable debt-to-equity rating compared to Tyler Technologies.
Scores Comparison
Here is a comparison of the financial scores for Tyler Technologies, Inc. and PagerDuty, Inc.:
TYL Scores
- Altman Z-Score: 7.42, indicating a safe zone from bankruptcy risk.
- Piotroski Score: 6, classified as average financial strength.
PD Scores
- Altman Z-Score: 1.26, indicating distress zone with high bankruptcy risk.
- Piotroski Score: 7, classified as strong financial strength.
Which company has the best scores?
Based on the data, TYL has a significantly higher Altman Z-Score, indicating better bankruptcy safety. PD has a stronger Piotroski Score, reflecting better financial strength. Each company excels in different score categories.
Grades Comparison
Here is a comparison of the latest grades and ratings for Tyler Technologies, Inc. and PagerDuty, Inc.:
Tyler Technologies, Inc. Grades
This table summarizes recent grades assigned by reputable grading companies to Tyler Technologies, Inc.:
| Grading Company | Action | New Grade | Date |
|---|---|---|---|
| Piper Sandler | Maintain | Overweight | 2026-01-13 |
| Wells Fargo | Maintain | Equal Weight | 2026-01-08 |
| DA Davidson | Maintain | Neutral | 2025-12-09 |
| Evercore ISI Group | Maintain | In Line | 2025-10-31 |
| DA Davidson | Maintain | Neutral | 2025-10-31 |
| DA Davidson | Maintain | Neutral | 2025-10-10 |
| DA Davidson | Maintain | Neutral | 2025-08-05 |
| Barclays | Maintain | Overweight | 2025-07-31 |
| Needham | Maintain | Buy | 2025-05-13 |
| Barclays | Maintain | Overweight | 2025-04-25 |
Tyler Technologies’ grades overall indicate a positive outlook with multiple “Overweight” and “Buy” ratings, suggesting moderate confidence among analysts.
PagerDuty, Inc. Grades
This table summarizes recent grades assigned by reputable grading companies to PagerDuty, Inc.:
| Grading Company | Action | New Grade | Date |
|---|---|---|---|
| Truist Securities | Maintain | Buy | 2026-01-07 |
| RBC Capital | Downgrade | Sector Perform | 2026-01-05 |
| TD Cowen | Maintain | Buy | 2025-11-26 |
| Craig-Hallum | Downgrade | Hold | 2025-11-26 |
| Morgan Stanley | Maintain | Equal Weight | 2025-11-26 |
| RBC Capital | Maintain | Outperform | 2025-11-26 |
| Truist Securities | Maintain | Buy | 2025-11-19 |
| Baird | Maintain | Neutral | 2025-09-04 |
| RBC Capital | Maintain | Outperform | 2025-09-04 |
| Canaccord Genuity | Maintain | Buy | 2025-09-04 |
PagerDuty’s grades show a more mixed trend, with several downgrades and a number of “Hold” or “Neutral” ratings, reflecting cautious sentiment.
Which company has the best grades?
Tyler Technologies holds a stronger consensus with a majority of “Buy” and “Overweight” ratings, while PagerDuty presents more variability with some downgrades and a “Hold” consensus. Investors could interpret Tyler Technologies’ grades as reflecting steadier analyst confidence, whereas PagerDuty’s mixed ratings denote greater uncertainty.
Strengths and Weaknesses
Below is a comparative table of strengths and weaknesses for Tyler Technologies, Inc. (TYL) and PagerDuty, Inc. (PD) based on their latest financial and operational data.
| Criterion | Tyler Technologies, Inc. (TYL) | PagerDuty, Inc. (PD) |
|---|---|---|
| Diversification | Diverse revenue streams including SaaS Arrangements (645M), Transaction Based Fees (698M), and Professional Services (264M). | Less diversified with core focus on digital operations management software. |
| Profitability | Positive net margin at 12.3%, neutral ROIC at 6.2%, but declining overall ROIC trend; slightly favorable financial ratios overall. | Negative net margin (-9.14%), negative ROIC (-9.66%), but improving ROIC trend; mostly unfavorable ratios. |
| Innovation | Moderate innovation with strong fixed asset turnover (10.95) and solid software platform segments. | High innovation indicated by high fixed asset turnover (16.61) and growing ROIC despite losses. |
| Global presence | Primarily US-focused with robust enterprise software and tax-related services. | Expanding global footprint in SaaS-based incident response and operations. |
| Market Share | Established niche in public sector software solutions; steady revenue growth in key segments. | Emerging player with growing presence in digital operations, but still shedding value. |
Key takeaways: Tyler Technologies offers stable profitability and diversification but faces challenges in maintaining value creation, while PagerDuty shows innovation and improving profitability trends but remains unprofitable and less diversified, indicating higher risk for investors.
Risk Analysis
Below is a comparative table summarizing key risk factors for Tyler Technologies, Inc. (TYL) and PagerDuty, Inc. (PD) based on the most recent data available for 2024-2025.
| Metric | Tyler Technologies, Inc. (TYL) | PagerDuty, Inc. (PD) |
|---|---|---|
| Market Risk | Moderate (Beta 0.916) | Lower (Beta 0.627) |
| Debt level | Low (Debt-to-Equity 0.19, favorable) | High (Debt-to-Equity 3.57, unfavorable) |
| Regulatory Risk | Moderate (Public sector focus) | Moderate (Tech industry, global) |
| Operational Risk | Moderate (Complex software solutions) | Moderate to High (Platform reliability critical) |
| Environmental Risk | Low | Low |
| Geopolitical Risk | Low (US-based, domestic focus) | Moderate (International markets exposure) |
The most impactful risks are PagerDuty’s high debt levels and financial distress indicators, reflected in its Altman Z-score in the distress zone (1.26), signaling bankruptcy risk. Tyler Technologies shows stronger financial stability with a safe Altman Z-score (7.42) but faces moderate market and operational risks typical of enterprise software providers. Investors should weigh PagerDuty’s growth potential against its solvency risks and Tyler’s stability against valuation concerns.
Which Stock to Choose?
Tyler Technologies, Inc. (TYL) shows a favorable income evolution with a 9.53% revenue growth in 2024 and solid profitability indicated by a 12.3% net margin. Its financial ratios are slightly favorable overall, with low debt levels and strong interest coverage, though some valuation ratios appear unfavorable. The company’s rating is very favorable (B), supported by a safe-zone Altman Z-Score and average Piotroski score, but its economic moat is very unfavorable due to declining ROIC below WACC.
PagerDuty, Inc. (PD) has a favorable income statement growth with an 8.54% revenue increase and improving profitability trends despite negative net margins. Its financial ratios are broadly unfavorable, reflecting high debt and negative returns, but it benefits from a very favorable rating (A-) and a strong Piotroski score. However, PD’s Altman Z-Score indicates financial distress, and its economic moat remains slightly unfavorable despite a growing ROIC.
Investors focused on stability and value might find Tyler Technologies’ strong income statement and financial health more reassuring, while those with a higher risk tolerance and growth orientation could interpret PagerDuty’s improving profitability and rating as potential upside, albeit with elevated financial risks. The differing financial profiles suggest that the choice depends significantly on individual risk appetite and investment strategy.
Disclaimer: Investment carries a risk of loss of initial capital. The past performance is not a reliable indicator of future results. Be sure to understand risks before making an investment decision.
Go Further
I encourage you to read the complete analyses of Tyler Technologies, Inc. and PagerDuty, Inc. to enhance your investment decisions: