In the fast-evolving software industry, Strategy Inc (MSTR) and PagerDuty, Inc. (PD) stand out with distinct yet overlapping innovation strategies. Strategy Inc focuses on bitcoin treasury management and AI-driven analytics, while PagerDuty excels in digital operations management using machine learning. Both companies serve technology-driven markets, making their comparison essential for investors seeking growth and stability. Let’s explore which company offers the most compelling investment opportunity in 2026.

Table of contents
Companies Overview
I will begin the comparison between Strategy Inc and PagerDuty, Inc. by providing an overview of these two companies and their main differences.
Strategy Inc Overview
Strategy Inc, formerly MicroStrategy Incorporated, operates as a bitcoin treasury company and offers AI-powered enterprise analytics software. Headquartered in Tysons Corner, Virginia, it provides investors economic exposure to Bitcoin through various securities and delivers tools like Strategy One and Strategy Mosaic for data governance and actionable insights. The company is a significant player in the software application industry with a market cap of 50B USD.
PagerDuty, Inc. Overview
PagerDuty, Inc. runs a digital operations management platform that uses machine learning to process and predict issues from data signals across software-enabled systems. Founded in 2009 and based in San Francisco, California, PagerDuty serves multiple industries including technology, telecommunications, and financial services. It is listed on the NYSE with a market cap of approximately 1B USD and focuses on enhancing operational efficiency through predictive analytics.
Key similarities and differences
Both companies operate in the software application sector and leverage advanced technologies such as AI and machine learning. However, Strategy Inc centers on bitcoin treasury management combined with enterprise analytics software, while PagerDuty specializes in digital operations management platforms for diverse industries. Their market capitalizations differ significantly, reflecting varying scales and strategic focuses within the technology space.
Income Statement Comparison
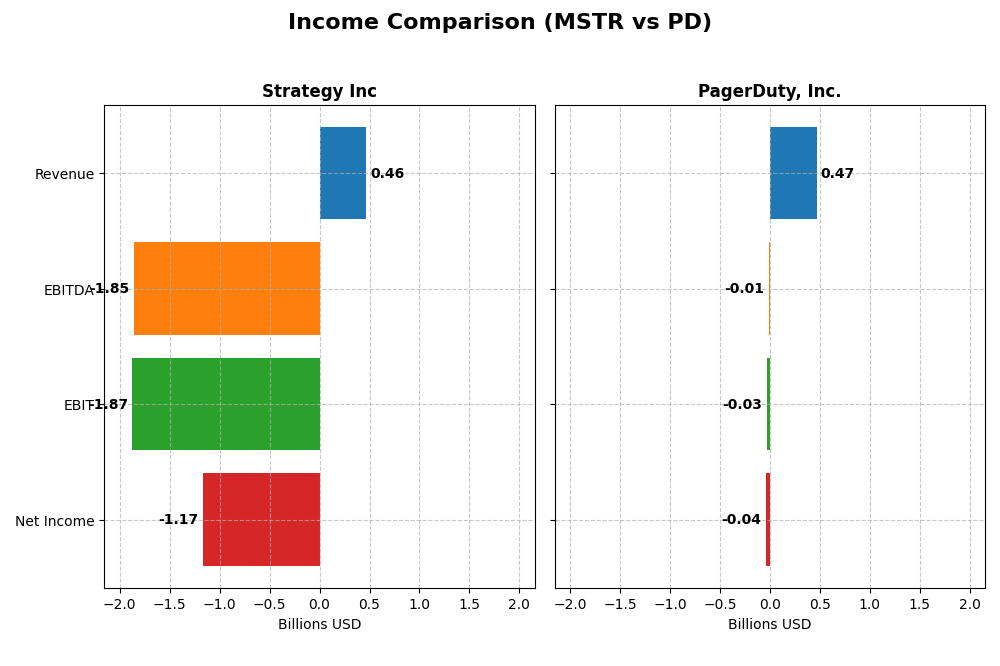
The table below compares the most recent full fiscal year income statement metrics for Strategy Inc and PagerDuty, Inc., highlighting key financial performance indicators.
| Metric | Strategy Inc (MSTR) | PagerDuty, Inc. (PD) |
|---|---|---|
| Market Cap | 50B | 1B |
| Revenue | 463M | 467M |
| EBITDA | -1.85B | -12M |
| EBIT | -1.87B | -32M |
| Net Income | -1.17B | -43M |
| EPS | -6.06 | -0.59 |
| Fiscal Year | 2024 | 2025 |
Income Statement Interpretations
Strategy Inc
Strategy Inc’s revenue slightly declined by 3.59% overall and 6.61% in the last year, with net income falling sharply over the period by 15406%. Gross margin remains favorable at 72.06%, but operating and net margins are deeply negative, indicating substantial losses. The 2024 performance worsened with a 13.55% drop in gross profit and a steep decline in EBIT and net income margins.
PagerDuty, Inc.
PagerDuty shows robust revenue growth of 118.91% over five years and an 8.54% increase in 2025 alone. Net income grew 37.98% overall, though it remains negative with a -9.14% net margin. Its gross margin is strong at 82.96%, and interest expense is low and favorable. The 2025 year saw improvements in EBIT and net margin by over 50%, signaling better operational efficiency.
Which one has the stronger fundamentals?
PagerDuty demonstrates stronger fundamentals with consistent revenue and net income growth, a high gross margin, and improving profitability metrics. In contrast, Strategy Inc suffers from declining revenue and significant net losses despite a decent gross margin, reflecting unfavorable income statement trends and deteriorating margins. PagerDuty’s financials indicate more operational stability and growth potential.
Financial Ratios Comparison
Below is a comparison of key financial ratios for Strategy Inc (MSTR) and PagerDuty, Inc. (PD) based on the most recent fiscal year data available.
| Ratios | Strategy Inc (MSTR) 2024 | PagerDuty, Inc. (PD) 2025 |
|---|---|---|
| ROE | -6.40% | -32.92% |
| ROIC | -4.38% | -9.66% |
| P/E | -47.80 | -39.87 |
| P/B | 3.06 | 13.12 |
| Current Ratio | 0.71 | 1.87 |
| Quick Ratio | 0.71 | 1.87 |
| D/E (Debt-to-Equity) | 0.40 | 3.57 |
| Debt-to-Assets | 28.09% | 50.00% |
| Interest Coverage | -29.92 | -6.46 |
| Asset Turnover | 0.02 | 0.50 |
| Fixed Asset Turnover | 5.73 | 16.61 |
| Payout ratio | 0 | 0 |
| Dividend yield | 0 | 0 |
Interpretation of the Ratios
Strategy Inc
Strategy Inc displays mostly unfavorable ratios in 2024, with weak profitability metrics such as a net margin of -251.73% and negative returns on equity and invested capital. Liquidity ratios are low, with a current ratio of 0.71, signaling potential short-term financial stress. The company does not pay dividends, likely reflecting reinvestment priorities or operational challenges.
PagerDuty, Inc.
PagerDuty shows mixed results for 2025, with a modestly negative net margin of -9.14% and poor returns on equity and invested capital, though liquidity is stronger, with a current ratio of 1.87. The debt level is relatively high, and interest coverage is negative. PagerDuty also does not pay dividends, possibly due to ongoing investments and growth focus.
Which one has the best ratios?
Both companies face unfavorable overall ratio evaluations, but PagerDuty performs better in liquidity and weighted average cost of capital, while Strategy Inc has a lower debt-to-equity ratio and better fixed asset turnover. Neither presents a clearly superior financial profile, as both exhibit significant weaknesses in profitability and coverage metrics.
Strategic Positioning
This section compares the strategic positioning of Strategy Inc and PagerDuty, Inc., including market position, key segments, and exposure to technological disruption:
Strategy Inc
- Large market cap of 50B USD with high beta, facing industry competition.
- Key segments include bitcoin treasury management and AI-powered enterprise analytics software.
- Exposure to disruption through AI analytics and cryptocurrency treasury operations.
PagerDuty, Inc.
- Smaller market cap of 1B USD with lower beta, operating in competitive software sector.
- Focused on digital operations management platform serving multiple industries.
- Leverages machine learning for digital signal processing, adapting to software ecosystem changes.
Strategy Inc vs PagerDuty, Inc. Positioning
Strategy Inc has a diversified portfolio spanning cryptocurrency and AI analytics, while PagerDuty concentrates on digital operations management across industries. Strategy Inc’s broader scope may face varied risks, whereas PagerDuty’s focus targets operational efficiency in software environments.
Which has the best competitive advantage?
Both companies are currently shedding value with ROIC below WACC. PagerDuty shows a slightly improving profitability trend, while Strategy Inc’s profitability is declining, indicating PagerDuty’s moat may be more resilient despite unfavorable overall status.
Stock Comparison
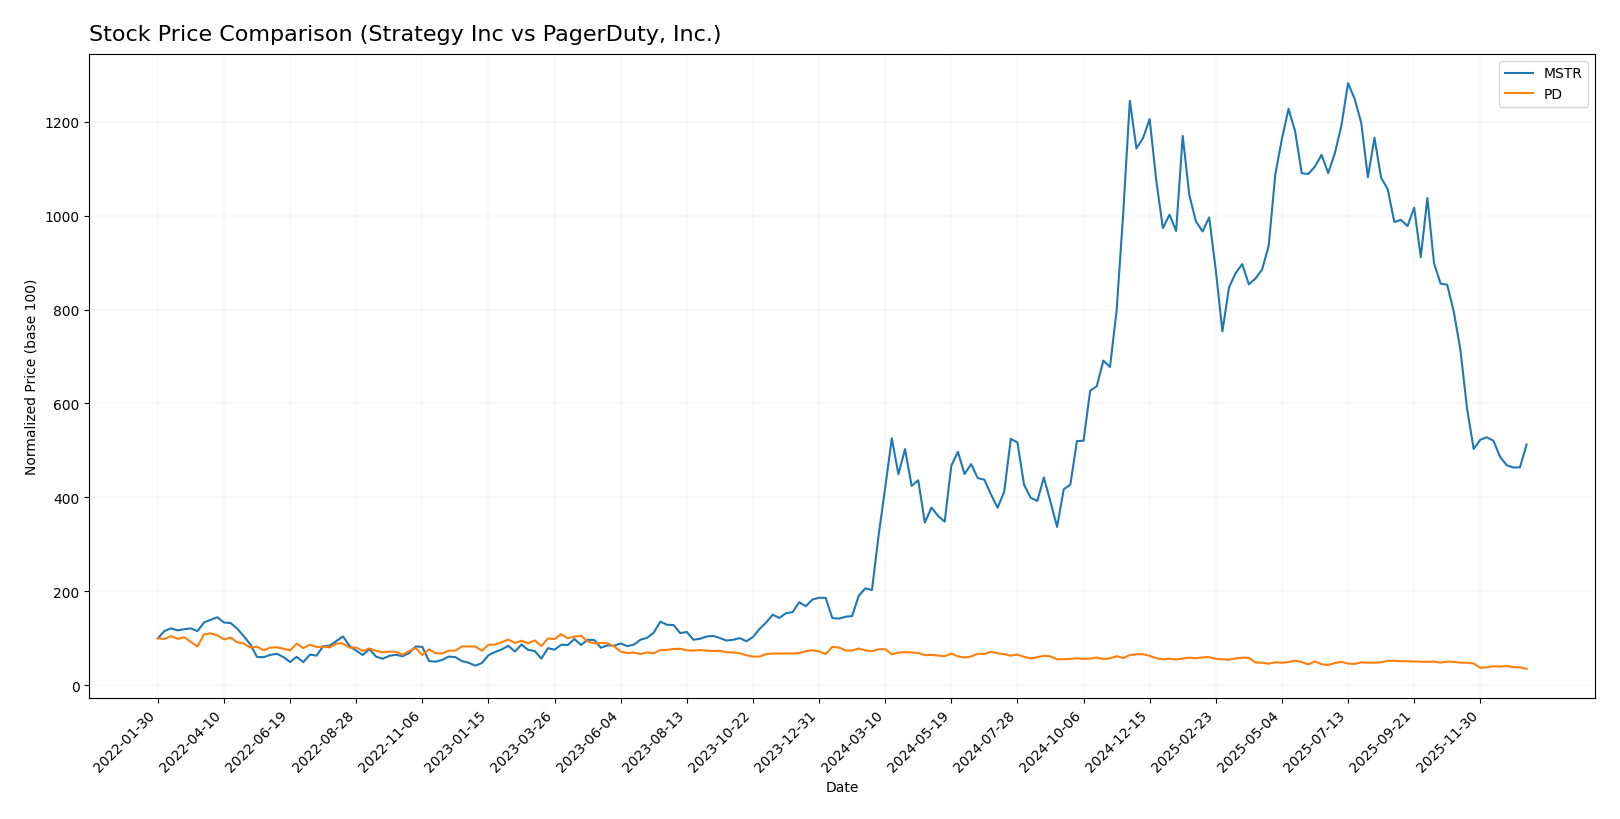
The stock price movements of Strategy Inc and PagerDuty, Inc. over the past 12 months reveal contrasting dynamics, with Strategy Inc showing strong overall gains despite recent declines, while PagerDuty experiences sustained downward pressure.
Trend Analysis
Strategy Inc’s stock demonstrated a bullish trend over the past year with a 152.71% increase, though the pace of gains has slowed recently amid a 35.55% price decline from November 2025 to January 2026. PagerDuty, Inc. exhibited a bearish trend with a 51.76% drop over the year, accompanied by further recent losses of 30.14%, indicating decelerating negative momentum. Comparing both, Strategy Inc outperformed PagerDuty, delivering substantially higher market returns despite recent volatility and downward pressure.
Target Prices
Here is the current analyst target price consensus for selected technology companies showing potential price ranges and average expectations.
| Company | Target High | Target Low | Consensus |
|---|---|---|---|
| Strategy Inc | 705 | 175 | 433.57 |
| PagerDuty, Inc. | 19 | 15 | 16.2 |
Analysts expect Strategy Inc’s stock to appreciate significantly from its current price of 173.71, reflecting bullish sentiment. PagerDuty’s consensus target of 16.2 also suggests upside potential compared to its current 11.22 price.
Analyst Opinions Comparison
This section compares analysts’ ratings and grades for Strategy Inc and PagerDuty, Inc.:
Rating Comparison
Strategy Inc Rating
- Rating: A-, considered very favorable overall.
- Discounted Cash Flow Score: 1, indicating very unfavorable valuation.
- ROE Score: 4, a favorable measure of profit efficiency.
- ROA Score: 5, very favorable asset utilization.
- Debt To Equity Score: 3, moderate financial risk.
- Overall Score: 4, favorable financial standing.
PagerDuty, Inc. Rating
- Rating: A-, also rated very favorable overall.
- Discounted Cash Flow Score: 5, indicating very favorable valuation.
- ROE Score: 5, very favorable profit efficiency.
- ROA Score: 5, very favorable asset utilization.
- Debt To Equity Score: 1, very unfavorable financial risk.
- Overall Score: 4, favorable financial standing.
Which one is the best rated?
Both companies share the same overall rating of A- and an overall score of 4. PagerDuty shows stronger scores in discounted cash flow, ROE, and matches Strategy Inc in ROA, but has a weaker debt-to-equity score. Strategy Inc has a more balanced debt-to-equity rating but weaker DCF score.
Scores Comparison
Here is a comparison of the Altman Z-Score and Piotroski Score for Strategy Inc and PagerDuty, Inc.:
Strategy Inc Scores
- Altman Z-Score: 2.78, placing the company in the grey zone.
- Piotroski Score: 4, categorized as average financial strength.
PagerDuty, Inc. Scores
- Altman Z-Score: 1.26, indicating the company is in distress.
- Piotroski Score: 7, reflecting strong financial health.
Which company has the best scores?
PagerDuty, Inc. scores lower on the Altman Z-Score, signaling distress, but has a stronger Piotroski Score (7 vs 4). Strategy Inc is in the grey zone with average Piotroski results.
Grades Comparison
Here is a comparison of the most recent grades assigned to Strategy Inc and PagerDuty, Inc.:
Strategy Inc Grades
The following table summarizes recent grades from recognized grading companies for Strategy Inc:
| Grading Company | Action | New Grade | Date |
|---|---|---|---|
| Mizuho | Maintain | Outperform | 2026-01-16 |
| TD Cowen | Maintain | Buy | 2026-01-15 |
| Citigroup | Maintain | Buy | 2025-12-22 |
| Bernstein | Maintain | Outperform | 2025-12-08 |
| Monness, Crespi, Hardt | Upgrade | Neutral | 2025-11-10 |
| HC Wainwright & Co. | Maintain | Buy | 2025-11-03 |
| Canaccord Genuity | Maintain | Buy | 2025-11-03 |
| BTIG | Maintain | Buy | 2025-10-31 |
| Cantor Fitzgerald | Maintain | Overweight | 2025-10-31 |
| TD Cowen | Maintain | Buy | 2025-10-31 |
Overall, grades for Strategy Inc show a strong and consistent buy/outperform trend with only one recent upgrade from sell to neutral.
PagerDuty, Inc. Grades
Below are recent grades from verified grading companies for PagerDuty, Inc.:
| Grading Company | Action | New Grade | Date |
|---|---|---|---|
| Truist Securities | Maintain | Buy | 2026-01-07 |
| RBC Capital | Downgrade | Sector Perform | 2026-01-05 |
| TD Cowen | Maintain | Buy | 2025-11-26 |
| Craig-Hallum | Downgrade | Hold | 2025-11-26 |
| Morgan Stanley | Maintain | Equal Weight | 2025-11-26 |
| RBC Capital | Maintain | Outperform | 2025-11-26 |
| Truist Securities | Maintain | Buy | 2025-11-19 |
| Baird | Maintain | Neutral | 2025-09-04 |
| RBC Capital | Maintain | Outperform | 2025-09-04 |
| Canaccord Genuity | Maintain | Buy | 2025-09-04 |
Grades for PagerDuty, Inc. indicate mixed signals with several downgrades and a range from buy to hold and sector perform, reflecting more cautious sentiment.
Which company has the best grades?
Strategy Inc has received mostly buy and outperform grades with stable or improving outlooks, while PagerDuty, Inc. shows more varied and less bullish ratings. This disparity may influence investors considering risk and growth potential based on analyst sentiment.
Strengths and Weaknesses
Below is a comparison of key strengths and weaknesses for Strategy Inc (MSTR) and PagerDuty, Inc. (PD) based on their recent financial and operational data.
| Criterion | Strategy Inc (MSTR) | PagerDuty, Inc. (PD) |
|---|---|---|
| Diversification | Moderate: Revenue mainly from Maintenance (244M) and Licensing (49M), with smaller contributions from Subscription and Technology Services | Limited: Primarily software service focused, less diversified product portfolio |
| Profitability | Weak: Negative net margin (-251.7%), ROIC -4.38%, shedding value with declining profitability | Weak but improving: Negative net margin (-9.14%), ROIC -9.66%, shedding value but ROIC is growing |
| Innovation | Moderate: Technology Service revenue stable (~64M in 2024) but declining trend in licensing income | Moderate to strong: Focused on cloud-based incident management with growing ROIC trend |
| Global presence | Established global operations but no explicit recent growth data | Growing presence with improving liquidity ratios indicating operational expansion |
| Market Share | Stable in legacy markets but challenged by profitability issues | Gaining traction with increasing asset turnover and operational efficiency |
Key takeaways: Strategy Inc shows challenges with profitability and declining returns on invested capital, despite stable service revenue. PagerDuty, while also unprofitable, demonstrates improving profitability trends and better liquidity, suggesting potential for value creation with continued operational improvements. Both require cautious risk management before investment.
Risk Analysis
Below is a summary table of key risks for Strategy Inc (MSTR) and PagerDuty, Inc. (PD) based on the most recent data available in 2026:
| Metric | Strategy Inc (MSTR) | PagerDuty, Inc. (PD) |
|---|---|---|
| Market Risk | High beta (3.433) indicates strong volatility and sensitivity to market swings. | Lower beta (0.627) suggests less market volatility. |
| Debt level | Moderate debt-to-assets at 28.09%, manageable debt/equity ratio (0.4). | High debt-to-assets at 50%, high debt/equity ratio (3.57), indicating financial leverage risk. |
| Regulatory Risk | Exposure to evolving cryptocurrency regulations poses ongoing compliance risks. | Operating in multiple jurisdictions with potential data privacy and security regulations. |
| Operational Risk | Reliance on AI-powered analytics and Bitcoin exposure could face technology disruptions. | Dependence on machine learning platform performance and integration risks. |
| Environmental Risk | Moderate, typical for technology firms but less direct impact. | Moderate, with operational data centers potentially exposed to environmental factors. |
| Geopolitical Risk | International Bitcoin operations expose it to geopolitical tensions and crypto policy changes. | Global operations with some exposure to geopolitical instability, but less than MSTR. |
The most likely and impactful risks for Strategy Inc stem from its high market volatility and regulatory uncertainties in the cryptocurrency space. PagerDuty faces significant financial risk due to its high leverage and operational reliance on complex technologies, though it benefits from lower market volatility. Both companies carry moderate operational and geopolitical risks inherent to their global technology operations.
Which Stock to Choose?
Strategy Inc (MSTR) shows a declining income trend with a -6.61% revenue growth in 2024 and unfavorable profitability ratios, including a -251.73% net margin and negative returns on equity and invested capital. Its debt levels appear moderate with a debt-to-equity ratio of 0.4, and it holds a very favorable overall rating of A- despite an unfavorable global income statement and ratio evaluation.
PagerDuty, Inc. (PD) exhibits positive income growth with an 8.54% revenue increase in 2025 and mostly favorable income statement trends, though profitability remains negative with a -9.14% net margin. Its financial ratios reveal mixed signals: strong liquidity but high leverage, reflected in a debt-to-equity ratio of 3.57. The company also carries a very favorable rating of A-, supported by strong return scores despite a generally unfavorable ratio profile.
Investors seeking growth opportunities might find PagerDuty’s improving income and profitability trends more appealing, while those prioritizing a stronger rating and moderate debt could view Strategy Inc’s profile as potentially more stable. The choice could depend on an investor’s risk tolerance and focus on either income growth or financial ratio strength.
Disclaimer: Investment carries a risk of loss of initial capital. The past performance is not a reliable indicator of future results. Be sure to understand risks before making an investment decision.
Go Further
I encourage you to read the complete analyses of Strategy Inc and PagerDuty, Inc. to enhance your investment decisions: