Salesforce, Inc. (CRM) and PagerDuty, Inc. (PD) both operate in the software application industry, offering innovative platforms that enhance business operations and customer engagement. While Salesforce focuses on comprehensive customer relationship management, PagerDuty specializes in digital operations management with machine learning capabilities. Their overlapping markets and contrasting scale present a fascinating comparison. In this article, I will help you determine which company stands out as the more compelling investment choice.
Table of contents
Companies Overview
I will begin the comparison between Salesforce and PagerDuty by providing an overview of these two companies and their main differences.
Salesforce Overview
Salesforce, Inc. is a leading provider of customer relationship management (CRM) technology that connects companies and customers globally. Its Customer 360 platform helps businesses deliver personalized experiences through sales, service, marketing, commerce, and analytics. Founded in 1999 and headquartered in San Francisco, Salesforce serves multiple industries with a comprehensive suite of cloud-based applications and integration tools like Tableau and MuleSoft.
PagerDuty Overview
PagerDuty, Inc. offers a digital operations management platform that uses machine learning to analyze data from software-enabled systems, helping companies anticipate and resolve issues. Founded in 2009 and also based in San Francisco, PagerDuty serves diverse sectors including technology, telecommunications, retail, and financial services. Its platform focuses on improving operational agility and incident response on a global scale.
Key similarities and differences
Both Salesforce and PagerDuty operate in the software application sector and are headquartered in San Francisco, providing technology solutions to improve business operations. Salesforce has a broader product portfolio focused on CRM and customer experience, while PagerDuty specializes in digital operations management and incident response. Salesforce is significantly larger with over 76K employees and a market cap exceeding 218B, compared to PagerDuty’s 1.2K employees and 1B market cap.
Income Statement Comparison
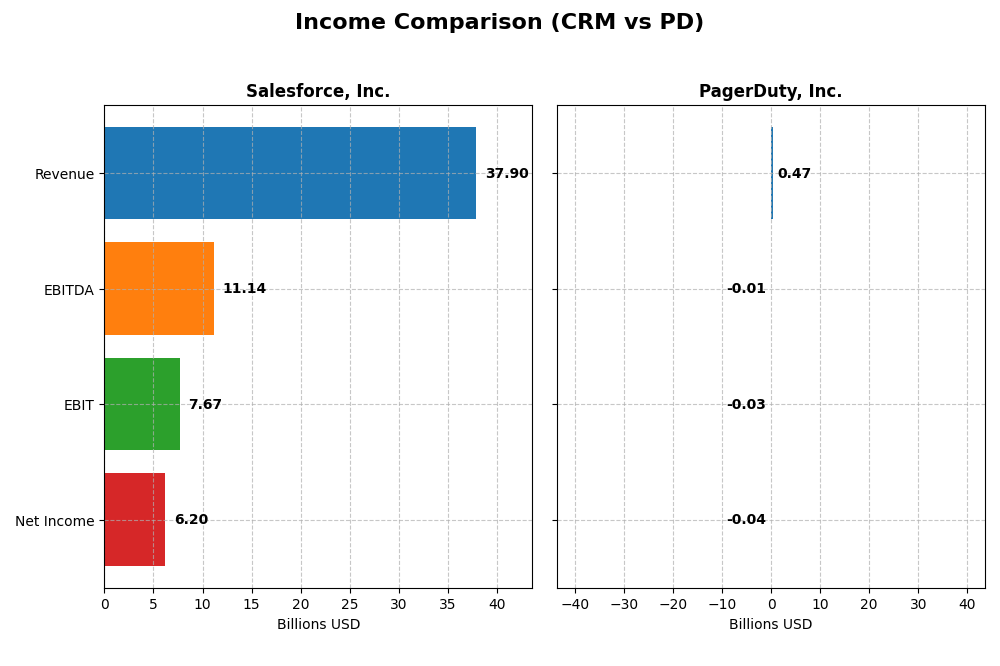
This table presents the key income statement metrics for Salesforce, Inc. and PagerDuty, Inc. for their most recent fiscal year, providing a clear side-by-side financial overview.
| Metric | Salesforce, Inc. (CRM) | PagerDuty, Inc. (PD) |
|---|---|---|
| Market Cap | 219B | 1.1B |
| Revenue | 37.9B | 468M |
| EBITDA | 11.1B | -12M |
| EBIT | 7.7B | -33M |
| Net Income | 6.2B | -43M |
| EPS | 6.44 | -0.59 |
| Fiscal Year | 2025 | 2025 |
Income Statement Interpretations
Salesforce, Inc.
Salesforce’s revenue rose steadily from $21.3B in 2021 to $37.9B in 2025, with net income expanding from $4.1B to $6.2B over the same period. Margins remained robust, with gross margin at 77.19% and net margin at 16.35% in 2025. The latest year showed strong growth in revenue (+8.7%) and net income (+37.8%), reflecting improved profitability and operational efficiency.
PagerDuty, Inc.
PagerDuty’s revenue increased from $213M in 2021 to $467M in 2025, and net losses narrowed from -$69M to -$43M. Gross margin remained high at 82.96%, but EBIT and net margins were negative at -6.95% and -9.14% respectively, in 2025. The most recent year saw revenue grow by 8.5% and net losses shrink significantly, indicating progress toward profitability despite ongoing operating expenses.
Which one has the stronger fundamentals?
Salesforce demonstrates stronger fundamentals with consistent profitability, positive net margins, and substantial net income growth. PagerDuty, while showing promising revenue growth and improved margins, still operates at a net loss with negative EBIT, indicating higher risk. Overall, Salesforce’s income statement reflects a more stable and mature financial position relative to PagerDuty.
Financial Ratios Comparison
This table presents a side-by-side comparison of key financial ratios for Salesforce, Inc. (CRM) and PagerDuty, Inc. (PD) based on their most recent fiscal year data (2025).
| Ratios | Salesforce, Inc. (CRM) | PagerDuty, Inc. (PD) |
|---|---|---|
| ROE | 10.13% | -32.92% |
| ROIC | 7.95% | -9.66% |
| P/E | 53.04 | -39.87 |
| P/B | 5.37 | 13.12 |
| Current Ratio | 1.06 | 1.87 |
| Quick Ratio | 1.06 | 1.87 |
| D/E (Debt to Equity) | 0.19 | 3.57 |
| Debt-to-Assets | 11.07% | 50.00% |
| Interest Coverage | 26.49 | -6.46 |
| Asset Turnover | 0.37 | 0.50 |
| Fixed Asset Turnover | 7.03 | 16.61 |
| Payout Ratio | 24.80% | 0.00% |
| Dividend Yield | 0.47% | 0.00% |
Interpretation of the Ratios
Salesforce, Inc.
Salesforce demonstrates a slightly favorable profile, with strong debt management and interest coverage, reflecting financial stability. However, its high P/E and P/B ratios indicate possibly overvalued shares. The quick ratio is favorable, while asset turnover is weak. Salesforce pays dividends, but the yield is low at 0.47%, suggesting limited shareholder returns compared to valuation metrics.
PagerDuty, Inc.
PagerDuty’s ratios are mostly unfavorable, showing negative returns and poor profitability metrics with a high debt load and negative interest coverage. The company maintains a strong liquidity position but faces challenges in income quality. PagerDuty does not pay dividends, likely due to ongoing reinvestment and growth initiatives, as indicated by its negative net margin and return on equity.
Which one has the best ratios?
Salesforce holds a more balanced and slightly favorable ratio profile with better profitability and debt metrics, while PagerDuty struggles with unfavorable returns and leverage despite good liquidity. Based on these evaluations, Salesforce’s ratios appear stronger, reflecting more financial resilience compared to PagerDuty’s current challenges.
Strategic Positioning
This section compares the strategic positioning of Salesforce and PagerDuty regarding market position, key segments, and exposure to technological disruption:
Salesforce, Inc.
- Leading CRM software provider with strong market presence; faces competition in enterprise software.
- Diverse cloud offerings: Sales, Service, Marketing, Commerce, Analytics, Integration, and Professional Services.
- Focus on integrated CRM and analytics platforms; adopting new technologies like AI and data integration.
PagerDuty, Inc.
- Smaller market cap; operates in digital operations management with niche focus and competitive pressure.
- Single core platform leveraging machine learning for digital operations across multiple industries.
- Uses machine learning to enhance operations; technology-driven but narrower application scope.
Salesforce vs PagerDuty Positioning
Salesforce adopts a diversified strategy across multiple cloud-based business functions, providing broad market coverage but facing intense competition. PagerDuty’s concentrated approach centers on digital operations management, focusing on machine learning advantages but with less diversification.
Which has the best competitive advantage?
Both companies currently shed value as ROIC is below WACC, despite growing profitability trends. Salesforce’s larger scale and diversified portfolio suggest a more resilient position, while PagerDuty’s narrower focus may limit its competitive moat.
Stock Comparison
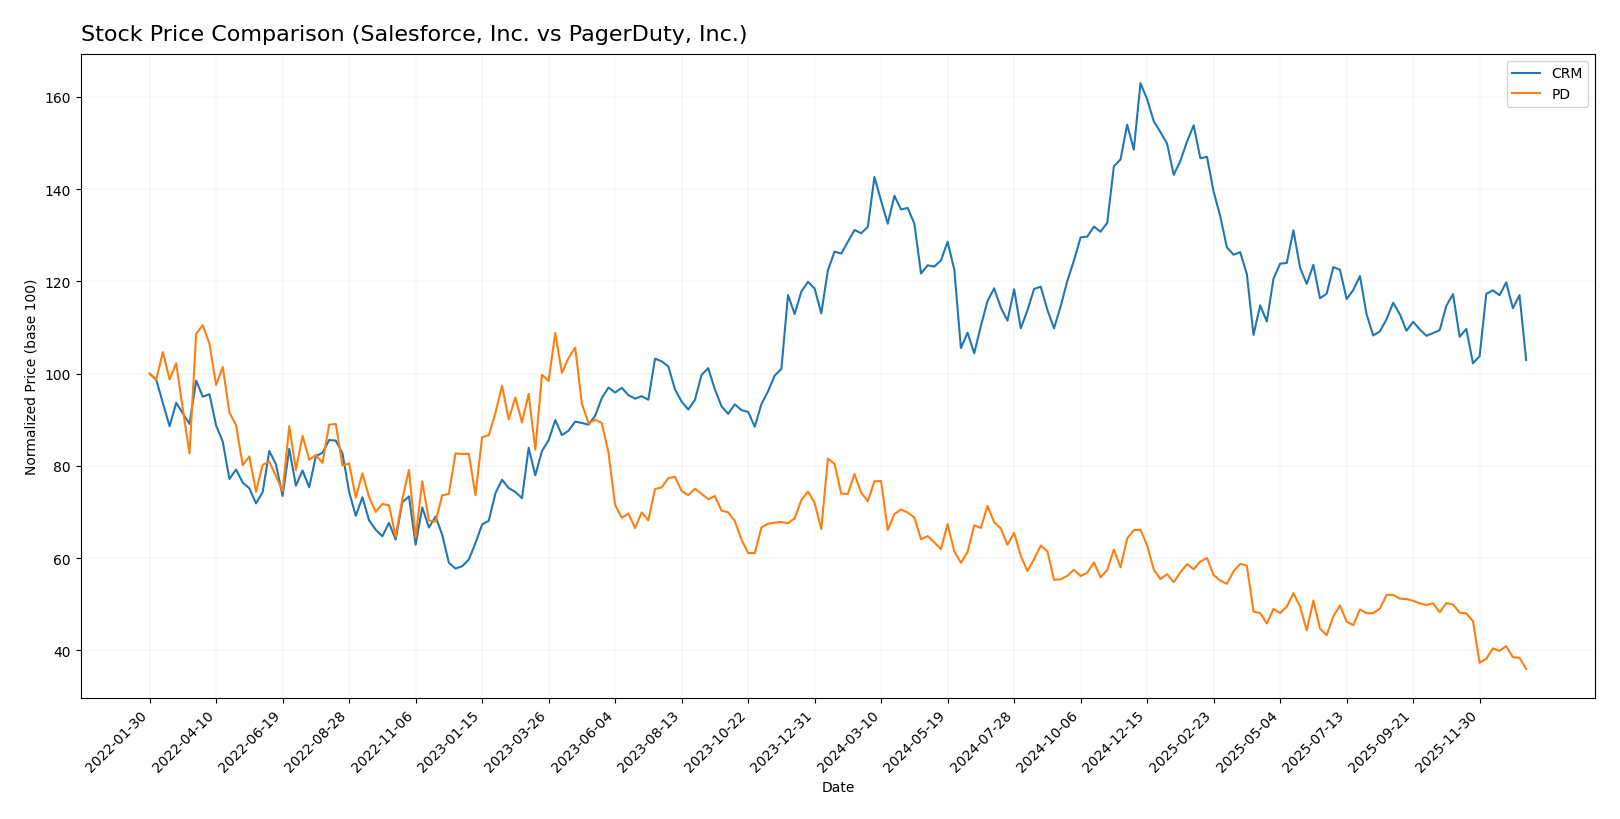
The stock prices of Salesforce, Inc. (CRM) and PagerDuty, Inc. (PD) have exhibited significant bearish trends over the past 12 months, with notable price declines and differing momentum patterns influencing their trading dynamics.
Trend Analysis
Salesforce, Inc. (CRM) experienced a 21.91% price decline over the past year, indicating a bearish trend with accelerating downward momentum and a high price volatility reflected by a 31.8 standard deviation. The recent period shows a milder 12.19% drop with a slight positive slope.
PagerDuty, Inc. (PD) showed a more pronounced bearish trend, with a 50.24% decrease in stock price over the last year, but its decelerating decline and low volatility (2.91 standard deviation) suggest a slowing downward movement. The recent trend steepened with a 27.93% drop.
Comparatively, CRM has delivered a higher market performance than PD, as its price decline was less severe and showed signs of recent stabilization, whereas PD’s losses were deeper and more persistent.
Target Prices
The current analyst consensus presents a varied but optimistic outlook for these technology firms.
| Company | Target High | Target Low | Consensus |
|---|---|---|---|
| Salesforce, Inc. | 400 | 250 | 324.17 |
| PagerDuty, Inc. | 19 | 15 | 16.2 |
Analysts expect Salesforce’s stock to appreciate significantly from its current price of $228.86, while PagerDuty’s consensus target of $16.2 suggests moderate upside potential against its $11.59 current price.
Analyst Opinions Comparison
This section compares analysts’ ratings and financial scores for Salesforce, Inc. (CRM) and PagerDuty, Inc. (PD):
Rating Comparison
CRM Rating
- Rating: B+, considered very favorable by analysts.
- Discounted Cash Flow Score: 4, indicating a favorable valuation outlook.
- ROE Score: 4, showing favorable efficiency in generating profit from equity.
- ROA Score: 4, favorable asset utilization to generate earnings.
- Debt To Equity Score: 3, moderate financial risk due to debt levels.
- Overall Score: 3, a moderate overall financial standing.
PD Rating
- Rating: A-, also very favorable according to analysts.
- Discounted Cash Flow Score: 5, reflecting a very favorable valuation status.
- ROE Score: 5, signifying very favorable profit generation from equity.
- ROA Score: 5, very favorable effectiveness in asset use.
- Debt To Equity Score: 1, indicating very unfavorable financial risk profile.
- Overall Score: 4, a favorable overall financial standing.
Which one is the best rated?
Based strictly on the provided data, PD holds a higher overall rating (A-) and better scores in DCF, ROE, and ROA, but has a notably weaker debt-to-equity score than CRM. CRM offers a more balanced risk profile with moderate scores overall.
Scores Comparison
Here is the comparison of the Altman Z-Score and Piotroski Score for both companies:
Salesforce Scores
- Altman Z-Score: 5.26, indicating a safe zone with low bankruptcy risk.
- Piotroski Score: 7, reflecting strong financial strength.
PagerDuty Scores
- Altman Z-Score: 1.26, in the distress zone signaling high bankruptcy risk.
- Piotroski Score: 7, reflecting strong financial strength.
Which company has the best scores?
Salesforce has a significantly higher Altman Z-Score, placing it in the safe zone, while PagerDuty falls in the distress zone. Both have equal Piotroski Scores of 7, indicating comparable financial strength by that measure.
Grades Comparison
Here is the grades comparison for Salesforce, Inc. and PagerDuty, Inc. based on recent analyst evaluations:
Salesforce, Inc. Grades
The table below summarizes recent grades and rating actions from reputable grading companies for Salesforce, Inc.
| Grading Company | Action | New Grade | Date |
|---|---|---|---|
| Barclays | Maintain | Overweight | 2026-01-12 |
| RBC Capital | Maintain | Sector Perform | 2026-01-05 |
| Morgan Stanley | Maintain | Overweight | 2025-12-09 |
| Citigroup | Maintain | Neutral | 2025-12-08 |
| DA Davidson | Maintain | Neutral | 2025-12-05 |
| Citizens | Maintain | Market Outperform | 2025-12-04 |
| Deutsche Bank | Maintain | Buy | 2025-12-04 |
| Wedbush | Maintain | Outperform | 2025-12-04 |
| Northland Capital Markets | Maintain | Market Perform | 2025-12-04 |
| Canaccord Genuity | Maintain | Buy | 2025-12-04 |
Salesforce’s grades show a generally positive consensus with multiple “Buy,” “Outperform,” and “Overweight” recommendations maintained by several major firms.
PagerDuty, Inc. Grades
Below is a summary of recent grading data from recognized grading companies for PagerDuty, Inc.
| Grading Company | Action | New Grade | Date |
|---|---|---|---|
| Truist Securities | Maintain | Buy | 2026-01-07 |
| RBC Capital | Downgrade | Sector Perform | 2026-01-05 |
| TD Cowen | Maintain | Buy | 2025-11-26 |
| Craig-Hallum | Downgrade | Hold | 2025-11-26 |
| Morgan Stanley | Maintain | Equal Weight | 2025-11-26 |
| RBC Capital | Maintain | Outperform | 2025-11-26 |
| Truist Securities | Maintain | Buy | 2025-11-19 |
| Baird | Maintain | Neutral | 2025-09-04 |
| RBC Capital | Maintain | Outperform | 2025-09-04 |
| Canaccord Genuity | Maintain | Buy | 2025-09-04 |
PagerDuty’s grades reveal a mixed picture with some downgrades from “Buy” to “Hold” or “Sector Perform,” alongside several maintained “Buy” and “Outperform” ratings.
Which company has the best grades?
Salesforce, Inc. consistently holds higher and more stable grades such as “Buy,” “Outperform,” and “Overweight,” while PagerDuty, Inc. shows recent downgrades and a more cautious consensus. This suggests Salesforce may be viewed more favorably by analysts, potentially influencing investor confidence and portfolio weighting decisions.
Strengths and Weaknesses
Below is a comparative overview of the key strengths and weaknesses of Salesforce, Inc. (CRM) and PagerDuty, Inc. (PD) based on the most recent financial and operational data.
| Criterion | Salesforce, Inc. (CRM) | PagerDuty, Inc. (PD) |
|---|---|---|
| Diversification | Highly diversified with multiple revenue streams across Sales Cloud (8.3B), Service Cloud (9.1B), and Marketing and Commerce Cloud (5.3B) in FY 2025 | Limited diversification; primarily focused on digital operations and incident response software |
| Profitability | Positive net margin (16.35%), neutral ROIC (7.95%), but slightly unfavorable valuation ratios (PE 53.04, PB 5.37) | Negative net margin (-9.14%) and ROIC (-9.66%), indicating ongoing losses and value destruction |
| Innovation | Strong platform innovation with growing ROIC trend (762%) despite slight value destruction | Improving ROIC trend (3.3%) but overall shedding value; innovation focused but financials weak |
| Global presence | Established global footprint with broad product offering across multiple cloud services | Smaller global reach, niche market in IT operations management |
| Market Share | Large market share in cloud CRM and enterprise software sectors | Smaller market share, more specialized industry positioning |
Key takeaway: Salesforce demonstrates strong diversification and profitability with a growing ROIC trend, signaling improving operational efficiency despite valuation concerns. PagerDuty shows promising innovation and ROIC growth but remains unprofitable with weaker financial health and less diversification, which increases investment risk.
Risk Analysis
Below is a table summarizing key risks for Salesforce, Inc. (CRM) and PagerDuty, Inc. (PD) based on the latest data from 2025:
| Metric | Salesforce, Inc. (CRM) | PagerDuty, Inc. (PD) |
|---|---|---|
| Market Risk | Beta 1.27, moderate volatility | Beta 0.63, lower volatility |
| Debt level | Low debt-to-equity 0.19, favorable | High debt-to-equity 3.57, unfavorable |
| Regulatory Risk | Moderate, subject to tech regulations | Moderate, growing compliance needs |
| Operational Risk | Large scale, complex operations | Smaller scale, but rapid growth challenges |
| Environmental Risk | Moderate, typical tech footprint | Moderate, focus on sustainable growth |
| Geopolitical Risk | US-based, global exposure risks | US-based, international presence |
The most impactful risks are PagerDuty’s high leverage and financial distress risk (Altman Z-score in distress zone), increasing its vulnerability to economic shocks. Salesforce shows stronger financial stability with low debt and a safe Altman Z-score, but market volatility remains a factor. Investors should weigh PagerDuty’s growth potential against its financial risk carefully.
Which Stock to Choose?
Salesforce, Inc. (CRM) has shown favorable income growth with a 78.31% revenue increase over 2021-2025 and strong profitability metrics, including a 16.35% net margin and a slightly favorable overall financial ratios evaluation. Its debt levels are low with a debt-to-equity ratio of 0.19, and it holds a very favorable B+ rating, indicating solid financial health despite a slightly unfavorable MOAT due to ROIC below WACC.
PagerDuty, Inc. (PD) displays favorable revenue growth of 118.91% over the period and improving profitability trends, yet it faces unfavorable income statement ratios such as a -9.14% net margin and high debt levels with a debt-to-equity ratio of 3.57. Its rating is A- and very favorable, but its MOAT is also slightly unfavorable with value destruction signs and a distress zone Altman Z-Score.
Investors with a risk-tolerant or growth-focused profile might find PagerDuty’s accelerating revenue and profitability growth appealing despite financial risks, while those prioritizing stability and lower leverage may view Salesforce’s stronger balance sheet and more consistent profitability as more favorable. The choice could depend on tolerance for volatility and capital structure preferences.
Disclaimer: Investment carries a risk of loss of initial capital. The past performance is not a reliable indicator of future results. Be sure to understand risks before making an investment decision.
Go Further
I encourage you to read the complete analyses of Salesforce, Inc. and PagerDuty, Inc. to enhance your investment decisions: