In today’s fast-evolving tech landscape, Paycom Software, Inc. and PagerDuty, Inc. stand out as innovative players within the software application industry. Both companies offer cloud-based solutions that enhance business operations, targeting overlapping markets focused on efficiency and automation. This comparison explores their distinct strategies and growth potential, helping you decide which company could be the most compelling addition to your investment portfolio. Let’s uncover which stock offers the best opportunity for your wallet.
Table of contents
Companies Overview
I will begin the comparison between Paycom Software, Inc. and PagerDuty, Inc. by providing an overview of these two companies and their main differences.
Paycom Software, Inc. Overview
Paycom Software, Inc. provides a cloud-based human capital management (HCM) solution delivered as software-as-a-service to small and mid-sized US companies. Its platform covers the entire employment lifecycle, offering applications for talent acquisition, time and labor management, payroll, and talent management. Founded in 1998 and headquartered in Oklahoma City, Paycom serves its market with a comprehensive suite of integrated HR tools and analytics.
PagerDuty, Inc. Overview
PagerDuty, Inc. operates a digital operations management platform that uses machine learning to process and predict issues from data signals generated by software systems and devices. Serving diverse industries globally, including tech, telecom, retail, and finance, PagerDuty focuses on incident response and operational intelligence. Founded in 2009 and headquartered in San Francisco, it supports customers across the US, Japan, and internationally.
Key similarities and differences
Both Paycom and PagerDuty operate in the technology sector with software-as-a-service models focused on business process optimization. However, Paycom specializes in human capital management solutions for workforce administration, while PagerDuty centers on digital operations and incident management platforms. Paycom targets HR functions in primarily US small to mid-sized firms, whereas PagerDuty addresses broader operational challenges across multiple industries worldwide.
Income Statement Comparison
The table below compares the most recent fiscal year income statement metrics for Paycom Software, Inc. and PagerDuty, Inc., highlighting their financial performance side by side.
| Metric | Paycom Software, Inc. (PAYC) | PagerDuty, Inc. (PD) |
|---|---|---|
| Market Cap | 8.35B | 1.03B |
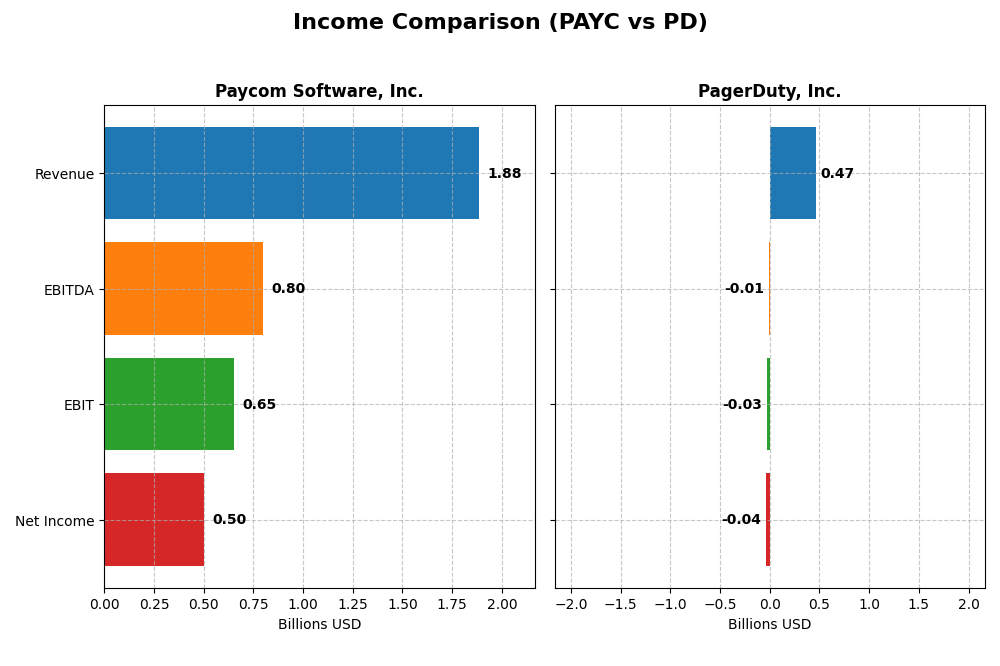
| Revenue | 1.88B | 467M |
| EBITDA | 798M | -12M |
| EBIT | 652M | -32M |
| Net Income | 502M | -43M |
| EPS | 8.93 | -0.59 |
| Fiscal Year | 2024 | 2025 |
Income Statement Interpretations
Paycom Software, Inc.
Paycom Software has shown consistent growth in revenue and net income from 2020 to 2024, with revenue rising from $841M to $1.88B and net income increasing from $143M to $502M. Gross and net margins remained strong and improved, with a gross margin above 82% and net margin reaching 26.7% in 2024. The latest year saw revenue growth of 11.2% and a significant 32.5% net margin increase, reflecting improved profitability.
PagerDuty, Inc.
PagerDuty experienced steady revenue growth from $213M in 2021 to $467M in 2025, but net income remained negative, though losses narrowed from -$69M to -$43M. The gross margin stayed stable around 83%, but EBIT and net margins were negative in 2025 at -7.0% and -9.1%, respectively. Recent growth rates improved with 8.5% revenue growth and a 51.8% net margin increase year-over-year, indicating progress toward profitability.
Which one has the stronger fundamentals?
Paycom exhibits stronger fundamentals with robust positive margins, substantial net income growth, and consistent profitability. PagerDuty shows solid revenue expansion and margin stability but continues to operate at a loss despite recent improvements. Paycom’s fully favorable income statement contrasts with PagerDuty’s mixed evaluation, reflecting Paycom’s more mature and financially stable position.
Financial Ratios Comparison
Below is a comparison of key financial ratios for Paycom Software, Inc. (PAYC) and PagerDuty, Inc. (PD) based on the most recent fiscal year data available.
| Ratios | Paycom Software, Inc. (PAYC) 2024 | PagerDuty, Inc. (PD) 2025 |
|---|---|---|
| ROE | 31.85% | -32.92% |
| ROIC | 24.86% | -9.66% |
| P/E | 22.95 | -39.87 |
| P/B | 7.31 | 13.12 |
| Current Ratio | 1.10 | 1.87 |
| Quick Ratio | 1.10 | 1.87 |
| D/E | 0.05 | 3.57 |
| Debt-to-Assets | 1.42% | 50.00% |
| Interest Coverage | 186.56 | -6.46 |
| Asset Turnover | 0.32 | 0.50 |
| Fixed Asset Turnover | 2.93 | 16.61 |
| Payout ratio | 16.89% | 0% |
| Dividend yield | 0.74% | 0% |
Interpretation of the Ratios
Paycom Software, Inc. (PAYC)
Paycom’s financial ratios present a generally favorable profile with strong net margin at 26.66%, high return on equity of 31.85%, and solid return on invested capital of 24.86%. The company has a low debt-to-equity ratio of 0.05 and excellent interest coverage at 191.88, signaling financial stability. However, its price-to-book ratio at 7.31 and asset turnover of 0.32 are less favorable. PAYC pays dividends with a modest yield of 0.74%, supported by free cash flow, yet the payout remains cautious to avoid unsustainable distributions.
PagerDuty, Inc. (PD)
PagerDuty’s ratios indicate financial challenges with negative net margin (-9.14%), return on equity (-32.92%), and return on invested capital (-9.66%), reflecting ongoing losses. The company maintains a favorable current ratio of 1.87 but suffers from high leverage, with debt-to-equity at 3.57 and debt-to-assets at 50%. No dividends are paid due to negative earnings, with a focus on reinvestment and R&D. The absence of dividends aligns with the company’s growth phase and operational cash flow constraints.
Which one has the best ratios?
Paycom Software displays a stronger and more balanced financial position, with a majority of favorable ratios and profitability metrics, while PagerDuty faces significant profitability and leverage issues. Paycom’s dividend payments and better capital structure contrast with PagerDuty’s negative earnings and high debt levels, resulting in a more favorable overall ratios evaluation for Paycom.
Strategic Positioning
This section compares the strategic positioning of Paycom Software, Inc. (PAYC) and PagerDuty, Inc. (PD), addressing Market position, Key segments, and Exposure to technological disruption:
Paycom Software, Inc.
- Large market cap of 8.3B with moderate beta, facing competition in cloud-based HCM software.
- Focuses on cloud-based human capital management for US small to mid-sized companies, with strong recurring revenue streams.
- Positioned in software-as-a-service with proprietary technologies like Microfence, facing standard software industry disruption risks.
PagerDuty, Inc.
- Smaller market cap of 1B, moderate beta, competing in digital operations management platform sector.
- Provides digital operations management platform across multiple industries internationally, leveraging machine learning.
- Relies on machine learning for digital signals correlation, exposed to rapid AI and digital platform innovations.
Paycom Software, Inc. vs PagerDuty, Inc. Positioning
PAYC adopts a concentrated approach in HCM solutions with robust recurring revenues, while PD targets diverse industries with a digital operations platform. PAYC’s scale supports stability; PD’s innovation focus offers growth potential but with higher risk.
Which has the best competitive advantage?
PAYC demonstrates a very favorable moat with strong ROIC above WACC and growing profitability, indicating durable competitive advantage. PD shows slightly unfavorable moat status with negative ROIC but improving profitability, suggesting weaker but improving competitive positioning.
Stock Comparison
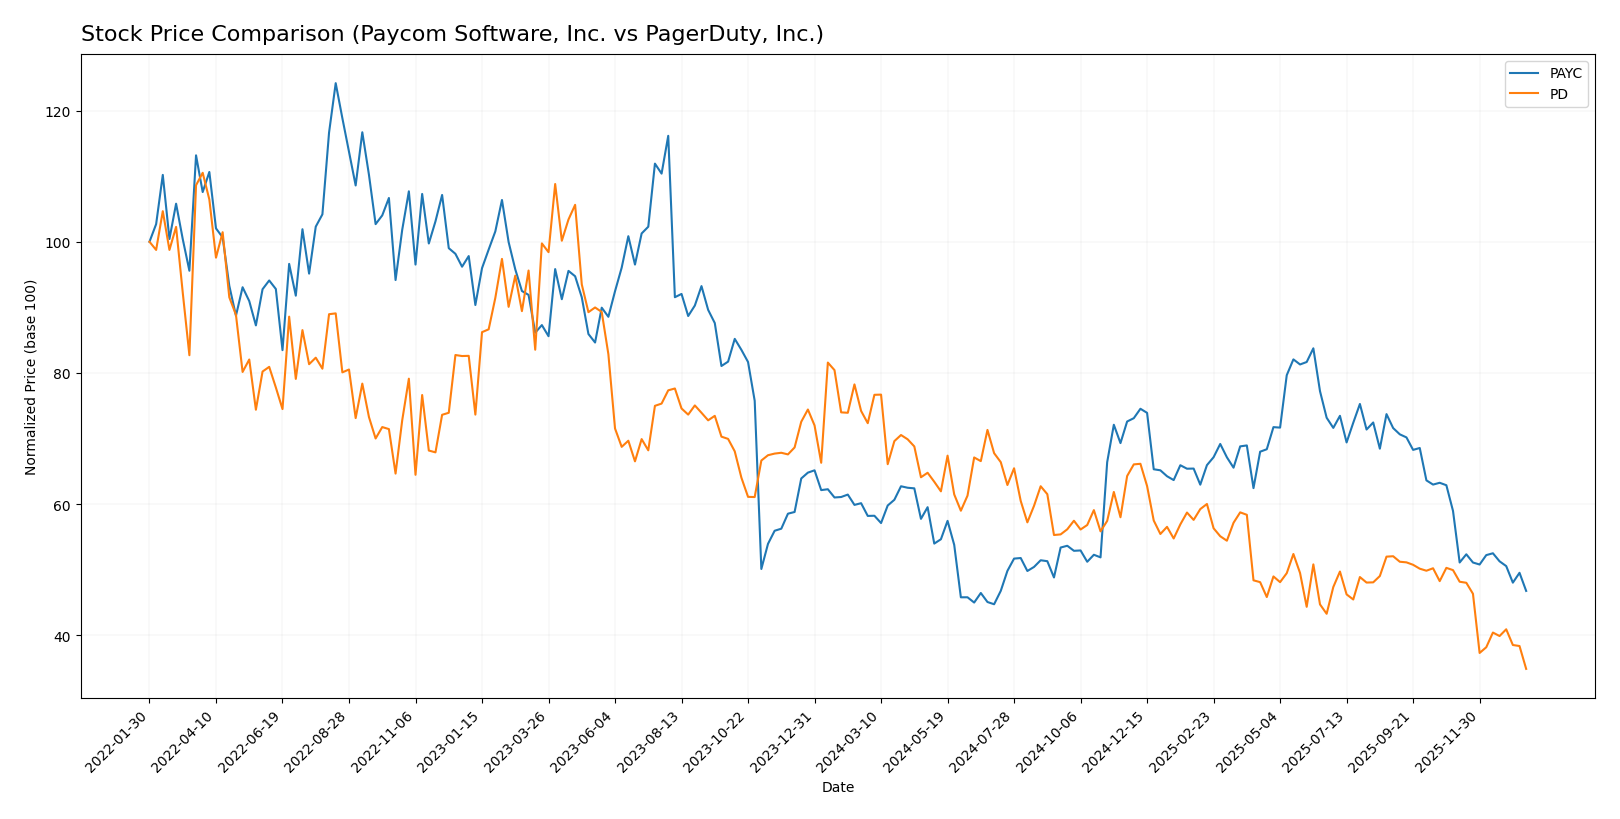
The stock price chart highlights significant bearish trends for both Paycom Software, Inc. (PAYC) and PagerDuty, Inc. (PD) over the past 12 months, with marked declines and decelerating downward momentum.
Trend Analysis
Paycom Software, Inc. (PAYC) experienced a bearish trend over the past year with a price decline of -19.64%. The trend shows deceleration, with high volatility indicated by a 31.92 standard deviation and a price range between 265.71 and 141.96.
PagerDuty, Inc. (PD) also followed a bearish trend, with a sharper 51.76% price drop over the last 12 months. The trend decelerated with lower volatility (std deviation 2.92) and prices ranging from 24.66 to 11.22.
Comparing the two, Paycom’s stock outperformed PagerDuty’s by delivering a smaller percentage loss, thus providing the higher market performance during this period.
Target Prices
The current analyst consensus for target prices shows a moderate upside potential for both Paycom Software, Inc. and PagerDuty, Inc.
| Company | Target High | Target Low | Consensus |
|---|---|---|---|
| Paycom Software, Inc. | 290 | 165 | 215 |
| PagerDuty, Inc. | 19 | 15 | 16.2 |
Analysts expect Paycom’s stock price to rise significantly above the current $148.41, while PagerDuty’s consensus target of $16.2 suggests a moderate increase from its current $11.22 price.
Analyst Opinions Comparison
This section compares analysts’ ratings and grades for Paycom Software, Inc. (PAYC) and PagerDuty, Inc. (PD):
Rating Comparison
PAYC Rating
- Rating: A, evaluated as Very Favorable overall.
- Discounted Cash Flow Score: 5, indicating very favorable future cash flow.
- ROE Score: 5, showing very efficient profit generation from equity.
- ROA Score: 5, reflecting very effective asset utilization.
- Debt To Equity Score: 4, considered favorable with lower financial risk.
- Overall Score: 4, classified as favorable in overall financial standing.
PD Rating
- Rating: A-, evaluated as Very Favorable overall.
- Discounted Cash Flow Score: 5, also very favorable for future cash flow.
- ROE Score: 5, equally efficient in generating profit from equity.
- ROA Score: 5, also very effective in asset utilization.
- Debt To Equity Score: 1, indicating very unfavorable financial risk.
- Overall Score: 4, also favorable overall financial standing.
Which one is the best rated?
Both PAYC and PD hold strong overall ratings of A and A-, respectively, with identical high scores in discounted cash flow, ROE, and ROA. PAYC has a notably better debt-to-equity score, indicating lower financial risk compared to PD.
Scores Comparison
The scores comparison between Paycom Software, Inc. and PagerDuty, Inc. is as follows:
PAYC Scores
- Altman Z-Score: 3.84, indicating a safe zone rating
- Piotroski Score: 5, considered average strength
PD Scores
- Altman Z-Score: 1.26, indicating a distress zone rating
- Piotroski Score: 7, considered strong financial health
Which company has the best scores?
Paycom demonstrates a stronger Altman Z-Score, suggesting better bankruptcy safety, while PagerDuty shows higher Piotroski strength. Each has strengths in different score metrics.
Grades Comparison
Here is a summary and comparison of the recent grades assigned to Paycom Software, Inc. and PagerDuty, Inc.:
Paycom Software, Inc. Grades
The following table presents recent grades from major grading companies for Paycom Software, Inc.:
| Grading Company | Action | New Grade | Date |
|---|---|---|---|
| Barclays | Maintain | Equal Weight | 2026-01-12 |
| TD Cowen | Maintain | Buy | 2026-01-08 |
| Citigroup | Maintain | Neutral | 2025-12-23 |
| Keybanc | Maintain | Overweight | 2025-11-06 |
| TD Cowen | Maintain | Buy | 2025-11-06 |
| UBS | Maintain | Buy | 2025-11-06 |
| Jefferies | Maintain | Hold | 2025-11-06 |
| JP Morgan | Maintain | Neutral | 2025-11-06 |
| Mizuho | Maintain | Neutral | 2025-11-06 |
| Barclays | Maintain | Equal Weight | 2025-11-06 |
The overall trend for Paycom shows a mix of Buy and Hold-related grades, with several firms maintaining Buy or Overweight ratings, balanced by multiple Neutral and Equal Weight assessments.
PagerDuty, Inc. Grades
The following table presents recent grades from major grading companies for PagerDuty, Inc.:
| Grading Company | Action | New Grade | Date |
|---|---|---|---|
| Truist Securities | Maintain | Buy | 2026-01-07 |
| RBC Capital | Downgrade | Sector Perform | 2026-01-05 |
| TD Cowen | Maintain | Buy | 2025-11-26 |
| Craig-Hallum | Downgrade | Hold | 2025-11-26 |
| Morgan Stanley | Maintain | Equal Weight | 2025-11-26 |
| RBC Capital | Maintain | Outperform | 2025-11-26 |
| Truist Securities | Maintain | Buy | 2025-11-19 |
| Baird | Maintain | Neutral | 2025-09-04 |
| RBC Capital | Maintain | Outperform | 2025-09-04 |
| Canaccord Genuity | Maintain | Buy | 2025-09-04 |
PagerDuty’s grades exhibit more variability, including recent downgrades from Outperform to Sector Perform and from Buy to Hold, indicating mixed analyst sentiment.
Which company has the best grades?
Both Paycom Software and PagerDuty currently hold a consensus rating of “Hold.” Paycom has more consistent Buy and Overweight ratings, while PagerDuty shows more downgrades and mixed opinions. This pattern suggests that Paycom may be perceived as a slightly more stable investment option by analysts, potentially affecting investor confidence differently.
Strengths and Weaknesses
Below is a comparative overview of Paycom Software, Inc. (PAYC) and PagerDuty, Inc. (PD) across key business criteria based on the most recent data available.
| Criterion | Paycom Software, Inc. (PAYC) | PagerDuty, Inc. (PD) |
|---|---|---|
| Diversification | Moderate: Highly focused on HR/payroll software with growing recurring revenue (~$1.73B in 2024) | Limited: Primarily incident management software with no public revenue segmentation data |
| Profitability | Strong: Net margin 26.66%, ROIC 24.86%, ROE 31.85%, consistent value creation with ROIC > WACC by 17.2% | Weak: Negative net margin (-9.14%), negative ROIC (-9.66%), value destroying with ROIC below WACC by 15.5% |
| Innovation | Solid: Increasing ROIC trend (+54.4%) indicates effective capital use and competitive advantage | Moderate: Slight ROIC growth (+3.3%) but still unprofitable and struggling to generate returns |
| Global presence | Established in the US with expanding recurring revenue base but limited global footprint | Growing presence in incident management but financial metrics suggest challenges scaling profitably |
| Market Share | Leading player in HR/payroll software with strong recurring revenue growth | Niche player in IT operations, market share constrained by financial and operational inefficiencies |
Key takeaways: Paycom demonstrates a durable competitive advantage with strong profitability, efficient capital use, and a growing recurring revenue base. PagerDuty, while showing some improvement in profitability trends, remains unprofitable with a less favorable financial position and higher risk for investors. Caution is advised when considering PagerDuty, whereas Paycom presents a more stable investment opportunity.
Risk Analysis
Below is a comparative table highlighting key risks for Paycom Software, Inc. (PAYC) and PagerDuty, Inc. (PD) based on the most recent data available:
| Metric | Paycom Software, Inc. (PAYC) | PagerDuty, Inc. (PD) |
|---|---|---|
| Market Risk | Moderate (Beta 0.82) | Moderate (Beta 0.63) |
| Debt Level | Very Low (D/E 0.05) | High (D/E 3.57) |
| Regulatory Risk | Moderate (US-focused HCM SaaS) | Moderate (Global SaaS platform) |
| Operational Risk | Low (Strong profitability) | High (Negative margins) |
| Environmental Risk | Low | Low |
| Geopolitical Risk | Low (US market focus) | Moderate (International exposure) |
The most impactful risk for PagerDuty is its high debt level combined with ongoing unprofitability, placing it in a financial distress zone with higher bankruptcy risk. Paycom maintains a very strong financial position with low leverage and solid margins, minimizing financial distress but facing typical market and regulatory risks in the SaaS sector.
Which Stock to Choose?
Paycom Software, Inc. (PAYC) shows a favorable income evolution with consistent revenue and net income growth exceeding 100% over five years. Its financial ratios reveal strong profitability and low debt, supported by a very favorable rating and a durable economic moat. The Altman Z-Score places PAYC in a safe zone, indicating financial stability.
PagerDuty, Inc. (PD) exhibits favorable revenue growth but faces challenges with negative net margins and returns. Its financial ratios indicate higher leverage and weaker profitability, reflected in a slightly unfavorable economic moat and a distress-level Altman Z-Score. Despite a very favorable rating, PD’s financial health appears less robust than PAYC’s.
For investors prioritizing stability and value creation, PAYC’s durable competitive advantage and strong financial metrics might appear more favorable. Conversely, PD could appeal to those with a higher risk tolerance focused on growth potential amid financial restructuring.
Disclaimer: Investment carries a risk of loss of initial capital. The past performance is not a reliable indicator of future results. Be sure to understand risks before making an investment decision.
Go Further
I encourage you to read the complete analyses of Paycom Software, Inc. and PagerDuty, Inc. to enhance your investment decisions: