Home > Comparison > Consumer Cyclical > SW vs PKG
The strategic rivalry between Smurfit Westrock Plc and Packaging Corporation of America shapes the packaging sector’s evolution. Smurfit Westrock operates as a global, capital-intensive paper-based packaging manufacturer, while Packaging Corporation of America focuses on a more specialized U.S. market with a dual-segment model. This analysis pits broad industrial scale against focused operational efficiency to identify which trajectory offers superior risk-adjusted returns for diversified portfolios.
Table of contents
Companies Overview
Smurfit Westrock Plc and Packaging Corporation of America stand as pivotal players in the global packaging industry.
Smurfit Westrock Plc: Global Paper-Based Packaging Leader
Smurfit Westrock Plc dominates as a global manufacturer of containerboard and corrugated packaging products. Its revenue primarily flows from producing containerboard and converting it into corrugated containers and diverse paper-based packaging. In 2026, Smurfit Westrock focuses strategically on expanding sustainable packaging solutions across food, e-commerce, and retail sectors worldwide.
Packaging Corporation of America: U.S. Corrugated Packaging Specialist
Packaging Corporation of America leads in the U.S. containerboard market, offering a broad range of corrugated packaging and specialty papers. Its core revenue engine includes direct sales of shipping containers and retail display boxes. The company’s 2026 strategy centers on enhancing packaging innovation and expanding its multi-channel distribution network across industrial and consumer markets.
Strategic Collision: Similarities & Divergences
Both companies compete fiercely in the containerboard and corrugated packaging segment but diverge in scale and market scope. Smurfit Westrock pursues a global footprint with integrated paper production, while Packaging Corporation of America emphasizes U.S. market dominance and distribution agility. Their differing capital intensity and geographic focus create distinct risk and growth profiles for investors.
Income Statement Comparison
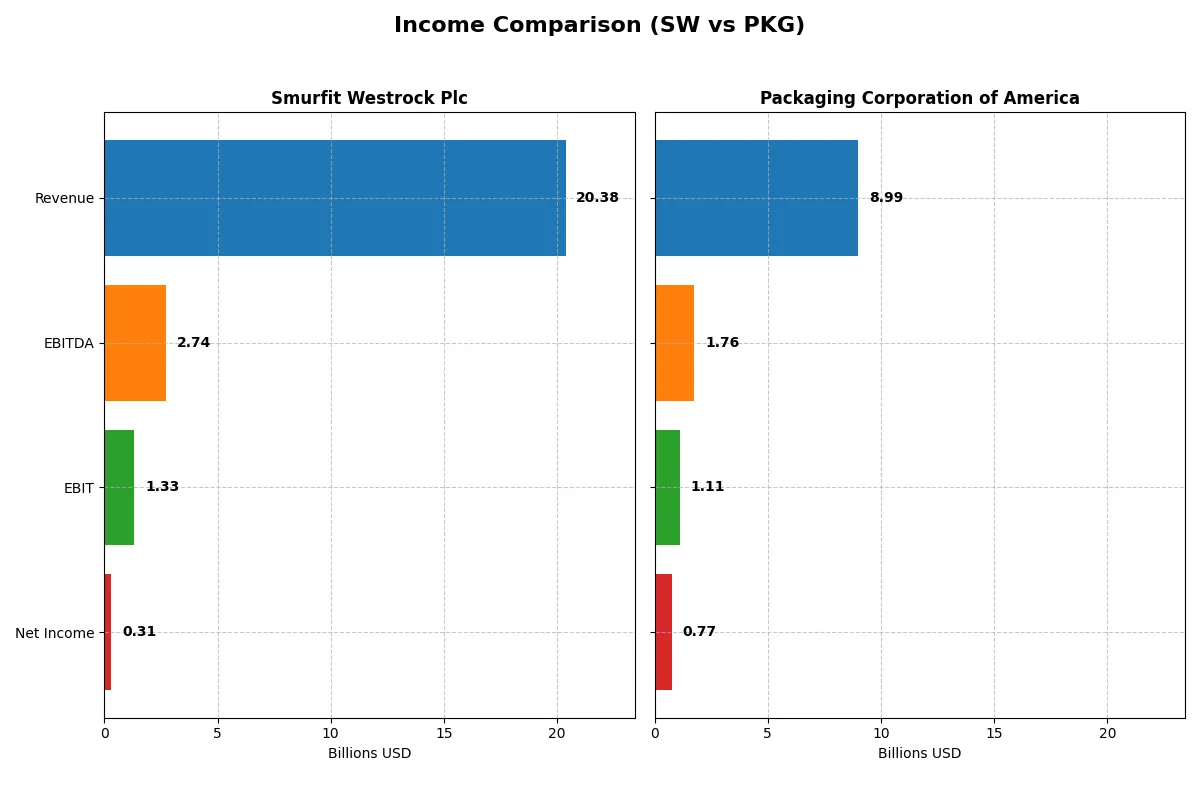
This data dissects the core profitability and scalability of both corporate engines to reveal who dominates the bottom line:
| Metric | Smurfit Westrock Plc (SW) | Packaging Corporation of America (PKG) |
|---|---|---|
| Revenue | 20.4B | 8.4B |
| Cost of Revenue | 16.3B | 6.6B |
| Operating Expenses | 3.1B | 0.7B |
| Gross Profit | 4.0B | 1.8B |
| EBITDA | 2.7B | 1.6B |
| EBIT | 1.3B | 1.1B |
| Interest Expense | 0.5B | 0.04B |
| Net Income | 0.3B | 0.8B |
| EPS | 0.8 | 8.97 |
| Fiscal Year | 2024 | 2024 |
Income Statement Analysis: The Bottom-Line Duel
This comparison exposes which company runs a more efficient and profitable business engine through their recent income statement performance.
Smurfit Westrock Plc Analysis
Smurfit Westrock posted a strong revenue surge of 86% in 2024, reaching $20.4B, but net income plummeted 78% to $308M. Its gross margin held steady near 20%, yet net margin contracted to 1.5%, signaling rising costs eroding bottom-line gains. Despite revenue momentum, the sharp decline in profitability reflects operational inefficiencies and higher expenses.
Packaging Corporation of America Analysis
Packaging Corp grew revenue modestly by 7% to $9B in 2025, while net income dipped 4% to $769M. It maintained robust gross and EBIT margins above 21% and 12%, respectively. The net margin of 8.5% remains healthy, underscoring disciplined cost control and steady earnings quality amid moderate top-line expansion.
Margin Resilience vs. Revenue Explosion
Smurfit Westrock’s explosive revenue growth contrasts with sharply deteriorating profitability, while Packaging Corp shows slower revenue gains but stronger margin preservation. Packaging’s higher net margin and EBIT efficiency make it the fundamental winner in operational discipline. Investors favor a stable, margin-focused profile over volatile revenue-driven performance.
Financial Ratios Comparison
These vital ratios act as a diagnostic tool to expose the underlying fiscal health, valuation premiums, and capital efficiency of the companies compared below:
| Ratios | Smurfit Westrock Plc (SW) | Packaging Corporation of America (PKG) |
|---|---|---|
| ROE | 1.77% | 18.28% |
| ROIC | 1.48% | 10.53% |
| P/E | 67.52 | 24.92 |
| P/B | 1.20 | 4.55 |
| Current Ratio | 1.37 | 3.23 |
| Quick Ratio | 0.89 | 2.10 |
| D/E | 0.78 | 0.63 |
| Debt-to-Assets | 31.1% | 31.4% |
| Interest Coverage | 1.92 | 26.60 |
| Asset Turnover | 0.47 | 0.95 |
| Fixed Asset Turnover | 0.90 | 1.94 |
| Payout Ratio | 211.1% | 55.7% |
| Dividend Yield | 3.13% | 2.24% |
| Fiscal Year | 2024 | 2024 |
Efficiency & Valuation Duel: The Vital Signs
Ratios act as a company’s DNA, revealing hidden risks and operational excellence that drive investment decisions with clarity and precision.
Smurfit Westrock Plc
Smurfit Westrock shows weak profitability with a 1.77% ROE and slim 1.51% net margin, signaling operational challenges. Its P/E of 67.5 marks the stock as stretched, while a modest 3.13% dividend yield offers steady shareholder returns. The firm balances reinvestment with cautious capital allocation amid neutral leverage metrics.
Packaging Corporation of America
Packaging Corp posts a neutral 8.55% net margin but zero reported ROE and ROIC raise concern over profitability quality. The 30.6 P/E suggests an expensive valuation. Strong interest coverage (13.99) and a 2.42% dividend yield highlight solid financial health and shareholder rewards, despite incomplete liquidity data clouding full assessment.
Premium Valuation vs. Operational Safety
Smurfit Westrock’s stretched valuation contrasts with its weak returns, while Packaging Corp offers better operational safety but incomplete liquidity data. Packaging’s profile suits investors prioritizing income and coverage; Smurfit Westrock’s risks may fit those chasing growth despite thin profitability.
Which one offers the Superior Shareholder Reward?
I see Smurfit Westrock Plc (SW) yields 3.13% with a high payout ratio over 210%, suggesting dividend sustainability risks. Packaging Corporation of America (PKG) offers a 2.42% yield but maintains a prudent 74% payout ratio. PKG’s buybacks are robust, driving free cash flow per share to 5.85 vs. SW’s 0.04, signaling stronger capital returns. SW’s dividend and buyback coverage are weak, risking future cuts. PKG’s balanced distribution and solid cash flow support a more sustainable, superior total shareholder return in 2026. I favor PKG for disciplined capital allocation and enduring value creation.
Comparative Score Analysis: The Strategic Profile
The radar chart reveals the fundamental DNA and trade-offs of Smurfit Westrock Plc and Packaging Corporation of America:
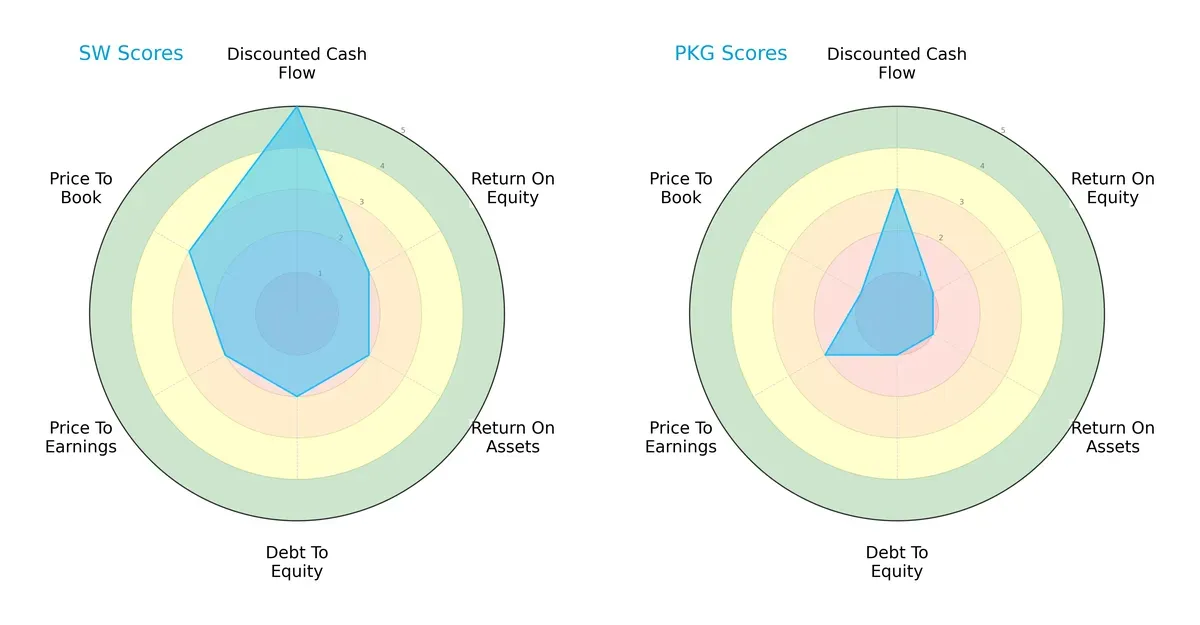
Smurfit Westrock shows a more balanced profile with strong discounted cash flow (DCF) at 5 and moderate scores across ROE (2), ROA (2), debt-to-equity (2), and valuation metrics (PE 2, PB 3). Packaging Corporation lags with generally very unfavorable scores except for moderate PE (2), relying on no clear edge but showing weaker operational efficiency and financial stability. Smurfit Westrock’s diversified strengths suggest better resilience in this sector’s cyclical environment.
Bankruptcy Risk: Solvency Showdown
The Altman Z-Score delta indicates stark differences in solvency risk:
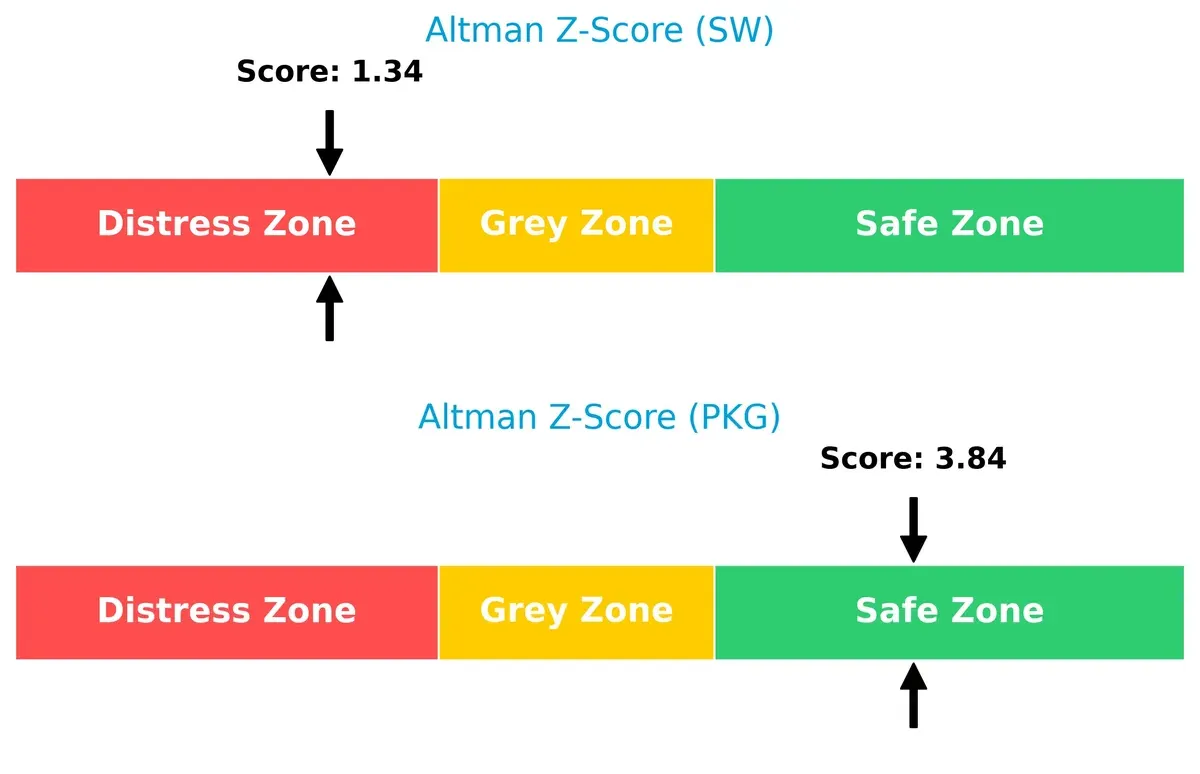
Packaging Corporation sits safely in the “safe zone” with a Z-score of 3.84, signaling low bankruptcy risk. In contrast, Smurfit Westrock’s 1.34 places it deep in the “distress zone,” raising red flags about long-term survival amid economic fluctuations. This gap demands caution for Smurfit Westrock investors despite its operational strengths.
Financial Health: Quality of Operations
Piotroski F-Scores highlight internal financial quality comparisons:
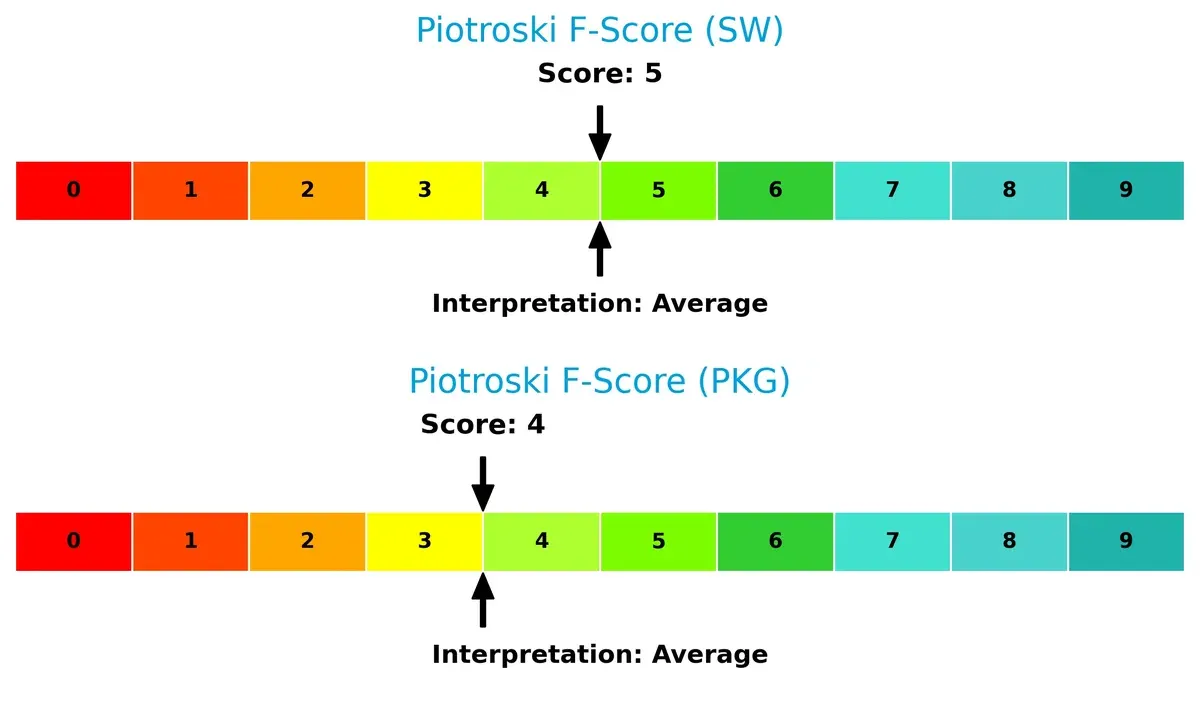
Smurfit Westrock scores 5, while Packaging Corporation scores slightly lower at 4, both indicating average financial health. Neither company exhibits peak financial strength, but Smurfit Westrock’s marginally better score suggests marginally stronger profitability and efficiency metrics. Investors should monitor these metrics closely for signs of improvement or deterioration.
How are the two companies positioned?
This section dissects the operational DNA of SW and PKG by comparing their revenue distribution by segment and internal strengths and weaknesses. The goal is to confront their economic moats and identify which model offers the most resilient competitive advantage today.
Revenue Segmentation: The Strategic Mix
This visual comparison dissects how Smurfit Westrock Plc and Packaging Corporation of America diversify their income streams and where their primary sector bets lie:
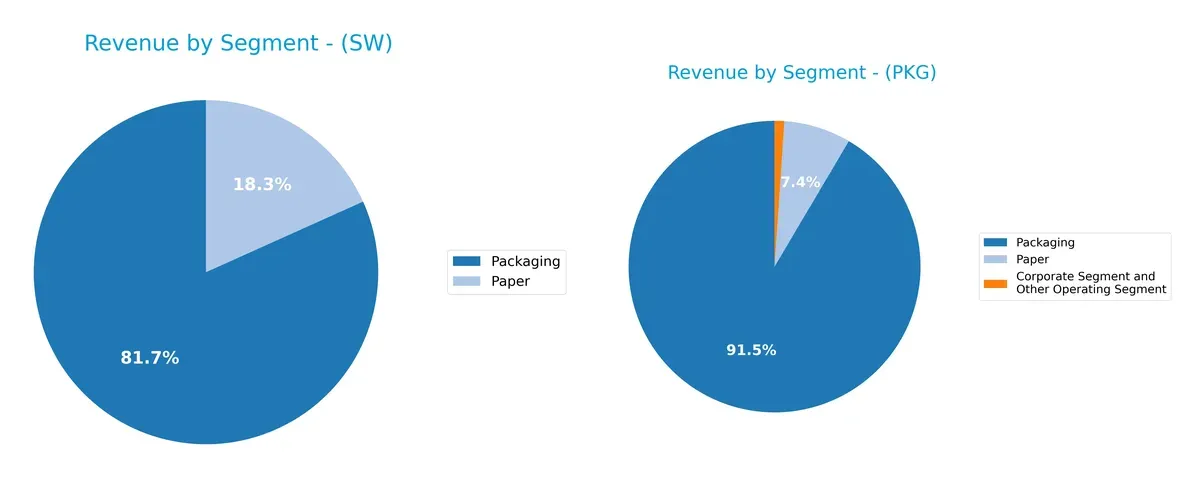
Smurfit Westrock anchors revenue heavily in Packaging with €17.25B, while Paper contributes €3.86B. Packaging Corporation of America shows a more balanced mix: Packaging at $7.69B, Paper at $625M, plus a $90M Corporate segment. Westrock’s dominance in Packaging signals ecosystem lock-in, whereas Packaging Corp’s diversified streams reduce concentration risk but lack Westrock’s scale in any single segment.
Strengths and Weaknesses Comparison
This table compares the Strengths and Weaknesses of Smurfit Westrock Plc and Packaging Corporation of America:
Smurfit Westrock Plc Strengths
- Diversified revenue across Packaging and Paper segments
- Significant global presence with strong US and European markets
- Favorable WACC and dividend yield
- Moderate debt levels and interest coverage
Packaging Corporation of America Strengths
- High net margin and favorable debt metrics
- Strong interest coverage ratio
- Favorable price-to-book ratio
- Consistent dividend yield
Smurfit Westrock Plc Weaknesses
- Low profitability ratios (net margin, ROE, ROIC)
- Unfavorable asset turnover ratios
- High P/E ratio indicating expensive valuation
Packaging Corporation of America Weaknesses
- Zero ROE and ROIC indicating weak returns
- Unavailable WACC and weak liquidity ratios
- Unfavorable asset turnover and P/E ratios
Smurfit Westrock benefits from geographic and product diversification but struggles with profitability and efficiency. Packaging Corporation shows strong profitability and balance sheet metrics but faces concerns in returns and liquidity. Both companies must address their distinct weaknesses to strengthen competitive positioning.
The Moat Duel: Analyzing Competitive Defensibility
A structural moat alone protects long-term profits from relentless competitive erosion. Let’s dissect the defensive strengths of Smurfit Westrock and Packaging Corporation of America:
Smurfit Westrock Plc: Scale and Diversified Product Moat
Smurfit Westrock leverages broad geographic reach and product diversity to maintain switching costs for clients. However, its declining ROIC signals weakening capital efficiency. Expansion into emerging markets could either deepen or strain this moat in 2026.
Packaging Corporation of America: Operational Efficiency Moat
Packaging Corp. relies on cost advantage and operational excellence, showing consistent margin superiority versus peers. While ROIC data is limited, steady revenue growth and margin stability suggest a resilient moat. Innovation in specialty packaging may fuel future gains.
Scale and Diversification vs. Operational Excellence: The Moat Verdict
Smurfit Westrock’s wide moat stems from scale but suffers from deteriorating capital returns. Packaging Corp.’s narrower but sharper cost moat drives superior margins and growth consistency. I find Packaging better positioned to defend its market share going forward.
Which stock offers better returns?
Over the past year, Smurfit Westrock Plc and Packaging Corporation of America exhibited contrasting price dynamics, with SW facing a bearish trend and PKG showing strong bullish momentum.
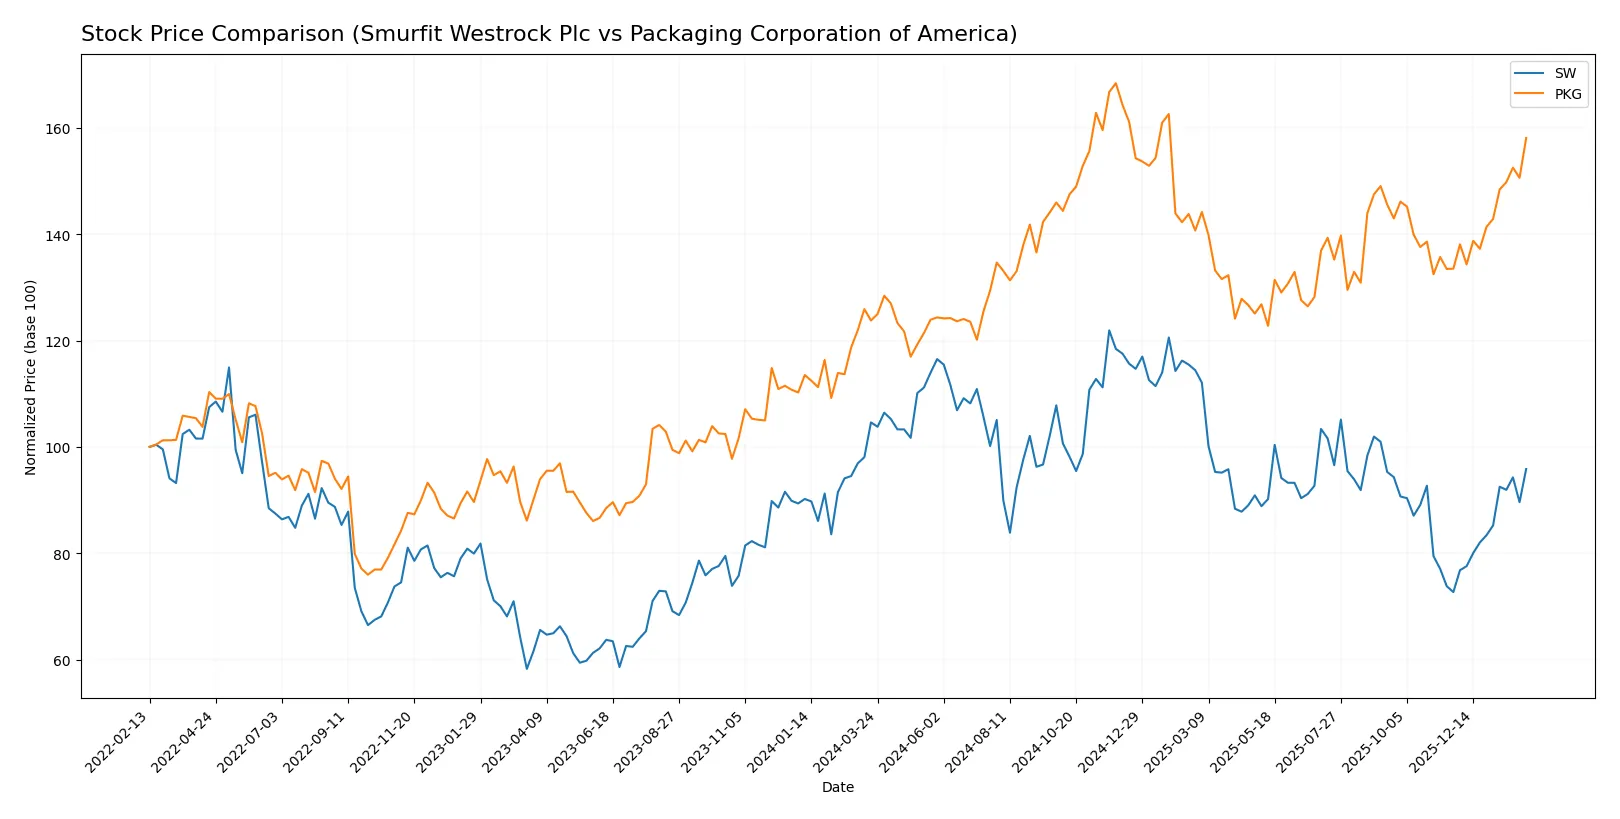
Trend Comparison
Smurfit Westrock Plc’s stock declined 8.37% over 12 months, marking a bearish trend despite accelerating price movements and a recent 31.82% rebound since November 2025.
Packaging Corporation of America’s stock rose 27.72% over the same period with accelerating gains and high volatility, supported by an 18.4% recent rally from late 2025 to early 2026.
Comparing trends, PKG delivered the highest market performance with a strong bullish return, while SW showed overall weakness despite short-term recovery.
Target Prices
Analysts show a bullish consensus for both Smurfit Westrock Plc and Packaging Corporation of America.
| Company | Target Low | Target High | Consensus |
|---|---|---|---|
| Smurfit Westrock Plc | 45 | 60 | 51 |
| Packaging Corporation of America | 233 | 270 | 246 |
The target consensus for Smurfit Westrock at $51 exceeds its current price of $44.57, implying upside potential. Packaging Corporation of America’s consensus target of $246 also surpasses its current $233.99 price, indicating positive analyst expectations.

Don’t Let Luck Decide Your Entry Point
Optimize your entry points with our advanced ProRealTime indicators. You’ll get efficient buy signals with precise price targets for maximum performance. Start outperforming now!
How do institutions grade them?
Smurfit Westrock Plc Grades
The following table shows recent grades from major financial institutions for Smurfit Westrock Plc:
| Grading Company | Action | New Grade | Date |
|---|---|---|---|
| Wells Fargo | Maintain | Overweight | 2026-01-06 |
| Truist Securities | Maintain | Buy | 2026-01-06 |
| Citigroup | Maintain | Buy | 2026-01-06 |
| Argus Research | Maintain | Buy | 2025-12-09 |
| Barclays | Maintain | Overweight | 2025-11-10 |
| Wells Fargo | Maintain | Overweight | 2025-10-30 |
| RBC Capital | Maintain | Outperform | 2025-10-30 |
| Truist Securities | Maintain | Buy | 2025-10-30 |
| Truist Securities | Maintain | Buy | 2025-10-13 |
| Wells Fargo | Upgrade | Overweight | 2025-10-07 |
Packaging Corporation of America Grades
Here are the latest grades from credible institutions for Packaging Corporation of America:
| Grading Company | Action | New Grade | Date |
|---|---|---|---|
| Wells Fargo | Maintain | Overweight | 2026-01-29 |
| Truist Securities | Maintain | Buy | 2026-01-29 |
| Citigroup | Maintain | Neutral | 2026-01-29 |
| UBS | Maintain | Neutral | 2026-01-12 |
| Truist Securities | Maintain | Buy | 2026-01-06 |
| Citigroup | Maintain | Neutral | 2026-01-06 |
| Wells Fargo | Upgrade | Overweight | 2026-01-06 |
| JP Morgan | Maintain | Overweight | 2025-12-05 |
| UBS | Maintain | Neutral | 2025-10-24 |
| UBS | Maintain | Neutral | 2025-10-16 |
Which company has the best grades?
Smurfit Westrock Plc consistently receives Buy and Overweight ratings, with an Outperform from RBC Capital. Packaging Corporation of America shows a mix of Buy, Overweight, and Neutral grades. Smurfit Westrock’s stronger consensus grades may signal higher institutional confidence, potentially influencing investor sentiment more positively.
Risks specific to each company
The following categories identify the critical pressure points and systemic threats facing both firms in the 2026 market environment:
1. Market & Competition
Smurfit Westrock Plc
- Faces intense global competition with moderate market share; margin pressure evident from low net margin and ROIC.
Packaging Corporation of America
- Operates mainly in the US with strong niche focus, but zero ROIC and ROE signal operational challenges.
2. Capital Structure & Debt
Smurfit Westrock Plc
- Moderate leverage with debt-to-equity at 0.78 and interest coverage of 2.62; manageable but watch liquidity ratios.
Packaging Corporation of America
- Debt metrics not reported but very favorable interest coverage of 13.99 suggests strong capacity to service debt.
3. Stock Volatility
Smurfit Westrock Plc
- Beta near 1.0 indicates market-level volatility; trading range moderate but elevated P/E of 67.5 adds valuation risk.
Packaging Corporation of America
- Lower beta at 0.9 implies less volatility; trading near 52-week high but P/E of 30.6 still signals stretched valuation.
4. Regulatory & Legal
Smurfit Westrock Plc
- International operations expose firm to diverse regulatory regimes, increasing compliance complexity and legal risk.
Packaging Corporation of America
- US-centric operations reduce regulatory complexity but face stringent environmental and labor regulations domestically.
5. Supply Chain & Operations
Smurfit Westrock Plc
- Global supply chain vulnerable to geopolitical disruptions; asset turnover and fixed asset turnover are weak, signaling operational inefficiency.
Packaging Corporation of America
- More localized supply chain reduces disruption risk; however, asset turnover data missing, raising transparency concerns.
6. ESG & Climate Transition
Smurfit Westrock Plc
- ESG pressures rising globally; paper-based packaging demands sustainable sourcing and carbon reduction, challenging cost structures.
Packaging Corporation of America
- Faces similar ESG demands but with stronger US regulatory push; potential for higher compliance costs impacting margins.
7. Geopolitical Exposure
Smurfit Westrock Plc
- Significant exposure to European and global markets increases risk from trade tensions and currency fluctuations.
Packaging Corporation of America
- Primarily US-focused, limiting geopolitical risks but dependent on domestic economic and policy stability.
Which company shows a better risk-adjusted profile?
Smurfit Westrock’s greatest risk lies in operational inefficiency and global regulatory complexity. Packaging Corporation of America’s key risk is poor profitability and unclear asset utilization. Despite slightly unfavorable ratings for both, Packaging’s strong balance sheet and safer Altman Z-Score indicate a better risk-adjusted profile. The stark contrast in Altman Z-Scores—1.34 (distress zone) for Smurfit Westrock versus 3.84 (safe zone) for Packaging—justifies heightened caution on Smurfit Westrock’s financial distress potential.
Final Verdict: Which stock to choose?
Smurfit Westrock Plc’s superpower lies in its operational scale and recent revenue surge, signaling potential to leverage market opportunities. Yet, its declining profitability and value destruction over time pose a point of vigilance. It fits an aggressive growth portfolio willing to weather volatility for upside potential.
Packaging Corporation of America commands a strategic moat through strong operational margins and disciplined capital allocation, offering a more stable earnings profile. Its solid balance sheet and better bankruptcy risk standing make it suitable for GARP investors seeking quality with measured growth.
If you prioritize aggressive expansion and can tolerate declining returns, Smurfit Westrock Plc presents a compelling scenario due to its scale and top-line momentum. However, for those seeking stability and capital efficiency within growth, Packaging Corporation of America offers better resilience and a stronger financial foundation, despite commanding a premium.
Disclaimer: Investment carries a risk of loss of initial capital. The past performance is not a reliable indicator of future results. Be sure to understand risks before making an investment decision.
Go Further
I encourage you to read the complete analyses of Smurfit Westrock Plc and Packaging Corporation of America to enhance your investment decisions: