Home > Comparison > Utilities > XEL vs PCG
The strategic rivalry between Xcel Energy Inc. and Pacific Gas & Electric Co. shapes the Utilities sector’s evolution in North America. Xcel operates as a diversified Regulated Electric utility across multiple states, blending traditional and renewable energy sources. In contrast, Pacific Gas & Electric focuses on California’s market with an emphasis on advanced grid technology integration. This analysis evaluates which business model delivers the superior risk-adjusted return for a balanced investment portfolio.
Table of contents
Companies Overview
Xcel Energy and Pacific Gas & Electric dominate the US regulated electric utility landscape with extensive customer bases.
Xcel Energy Inc.: Diverse Energy Producer
Xcel Energy operates as a leading regulated electric utility serving 3.7M electricity and 2.1M natural gas customers. It generates power from coal, nuclear, natural gas, hydro, solar, biomass, wind, and other sources. In 2026, the company’s strategic focus centers on expanding renewable energy investments and upgrading infrastructure across eight states in the Midwest and Southwest.
Pacific Gas & Electric Co.: California Power Giant
Pacific Gas & Electric serves northern and central California with electricity and natural gas. Its core revenue comes from generation via nuclear, hydro, fossil fuels, and photovoltaic sources, plus innovative smart grid solutions like microgrid backup systems. In 2026, the company prioritizes smart grid integration and enhancing reliability amid regulatory and environmental challenges.
Strategic Collision: Similarities & Divergences
Both companies rely on regulated utilities as their business foundation but differ in geographic focus and innovation strategies. Xcel Energy emphasizes renewable expansion in diverse regions, while PG&E focuses on smart grid technology within California’s complex market. Their competition centers on customer retention and regulatory compliance. These distinctions create unique risk-return profiles for investors seeking exposure to regulated electricity providers.
Income Statement Comparison
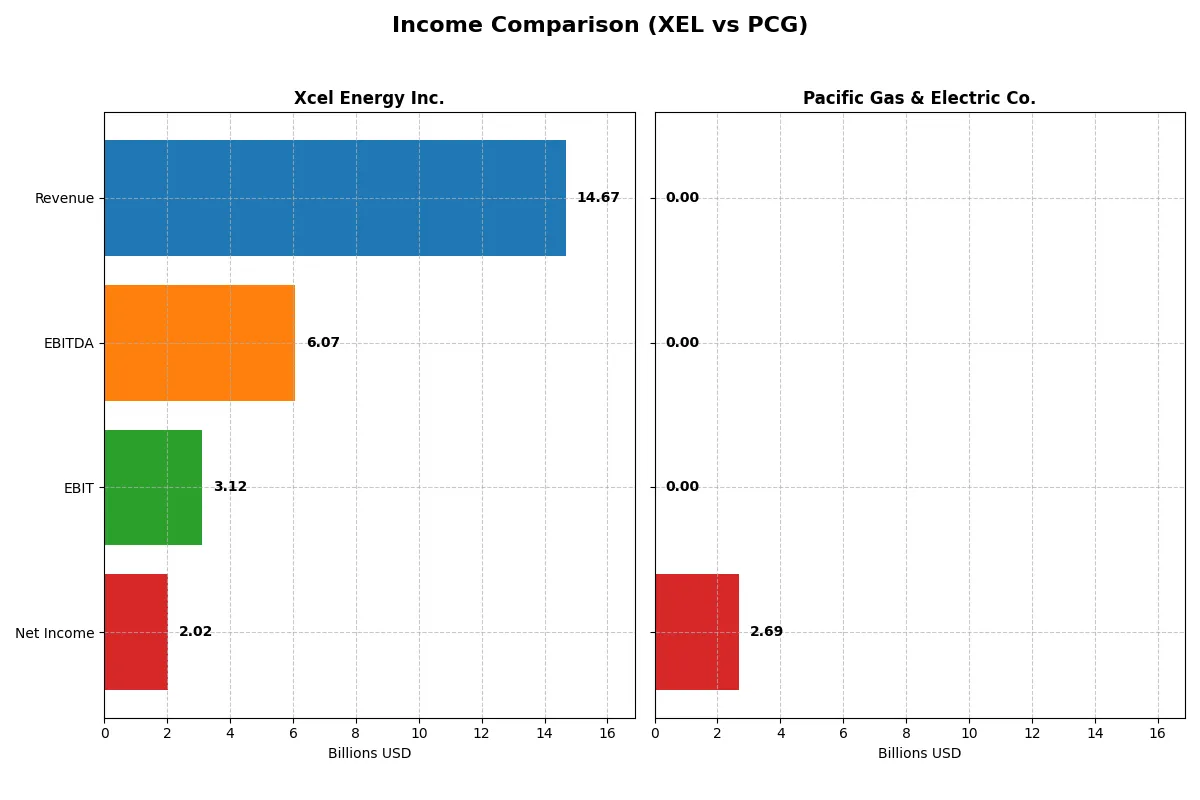
This data dissects the core profitability and scalability of both corporate engines to reveal who dominates the bottom line:
| Metric | Xcel Energy Inc. (XEL) | Pacific Gas & Electric Co. (PCG) |
|---|---|---|
| Revenue | 14.67B | 0 |
| Cost of Revenue | 11.10B | 0 |
| Operating Expenses | 686M | -207M |
| Gross Profit | 3.57B | 0 |
| EBITDA | 6.07B | 0 |
| EBIT | 3.12B | 0 |
| Interest Expense | 1.34B | -315M |
| Net Income | 2.02B | 2.69B |
| EPS | 3.44 | 1.18 |
| Fiscal Year | 2025 | 2025 |
Income Statement Analysis: The Bottom-Line Duel
This income statement comparison reveals which company operates with superior efficiency and bottom-line performance under current market conditions.
Xcel Energy Inc. Analysis
Xcel Energy steadily grows revenue, reaching $14.7B in 2025, with net income climbing to $2.0B. Its gross margin remains favorable at 24.3%, while net margin holds strong at 13.8%. Despite a slight dip in gross profit growth last year, EBIT expanded 15%, signaling robust operating momentum and efficient cost management.
Pacific Gas & Electric Co. Analysis
Pacific Gas & Electric’s 2025 revenue collapses to zero, distorting margin metrics to unfavorable levels. Yet net income surges to $2.7B, driven by non-operating factors. The sharp revenue decline contrasts with impressive EPS growth over five years. This anomaly suggests volatility and challenges in core operations, despite bottom-line improvement.
Operating Stability vs. Earnings Volatility
Xcel Energy delivers consistent revenue growth and stable margins, reflecting operational resilience. Pacific Gas & Electric shows extreme revenue volatility but achieves net income spikes via non-operational gains. For investors prioritizing steady earnings and margin health, Xcel’s profile offers clearer operational efficiency and sustainable profitability.
Financial Ratios Comparison
These vital ratios act as a diagnostic tool to expose the underlying fiscal health, valuation premiums, and capital efficiency of the companies compared below:
| Ratios | Xcel Energy Inc. (XEL) | Pacific Gas & Electric Co. (PCG) |
|---|---|---|
| ROE | 8.5% | 8.3% |
| ROIC | 3.2% | — |
| P/E | 21.5 | 13.1 |
| P/B | 1.84 | 1.08 |
| Current Ratio | 0.67 | 0.03 |
| Quick Ratio | 0.57 | 0.03 |
| D/E (Debt-to-Equity) | 1.44 | 0.27 |
| Debt-to-Assets | 37.3% | 18.8% |
| Interest Coverage | 2.14 | 0.00 |
| Asset Turnover | 0.16 | 0.00 |
| Fixed Asset Turnover | 0.00 | 0.00 |
| Payout Ratio | 82.2% | 8.2% |
| Dividend Yield | 3.83% | 0.62% |
| Fiscal Year | 2025 | 2025 |
Efficiency & Valuation Duel: The Vital Signs
Financial ratios act as a company’s DNA, uncovering hidden risks and operational excellence that guide investment decisions with precision.
Xcel Energy Inc.
Xcel Energy shows moderate profitability with an 8.55% ROE and a favorable 13.76% net margin. Its valuation appears neutral, with a P/E of 21.48 and P/B of 1.84, suggesting the stock is fairly priced. The firm rewards shareholders with a 3.83% dividend yield amid reinvestment challenges signaled by low asset turnover.
Pacific Gas & Electric Co.
Pacific Gas & Electric records a slightly lower ROE of 8.26%, but its valuation is attractive, with a P/E of 13.13 and P/B of 1.08, indicating the stock trades at a discount. However, zero net margin and weak dividend yield of 0.62% highlight operational struggles and limited shareholder returns, despite conservative leverage.
Valuation Discipline vs. Operational Performance
Pacific Gas & Electric offers a cheaper valuation but suffers from poor profitability and dividends. Xcel Energy delivers better margins and dividends but carries moderate valuation and operational inefficiencies. Investors valuing income and stability may prefer Xcel, while those seeking value at a discount might lean toward Pacific Gas & Electric.
Which one offers the Superior Shareholder Reward?
I see Xcel Energy (XEL) offers a 3.8% dividend yield with a high payout ratio near 82%, signaling aggressive income distribution but potential free cash flow strain. XEL also maintains steady buybacks, enhancing total returns. Pacific Gas & Electric (PCG) yields barely 0.6% with a very low payout ratio around 8%, reflecting minimal dividends and a reinvestment focus amid modest buyback activity. Historically, utilities like XEL sustain shareholder value better through balanced dividends and buybacks. I judge XEL’s distribution model more sustainable and rewarding for 2026 investors.
Comparative Score Analysis: The Strategic Profile
The radar chart reveals the fundamental DNA and strategic trade-offs of Xcel Energy Inc. and Pacific Gas & Electric Co.:
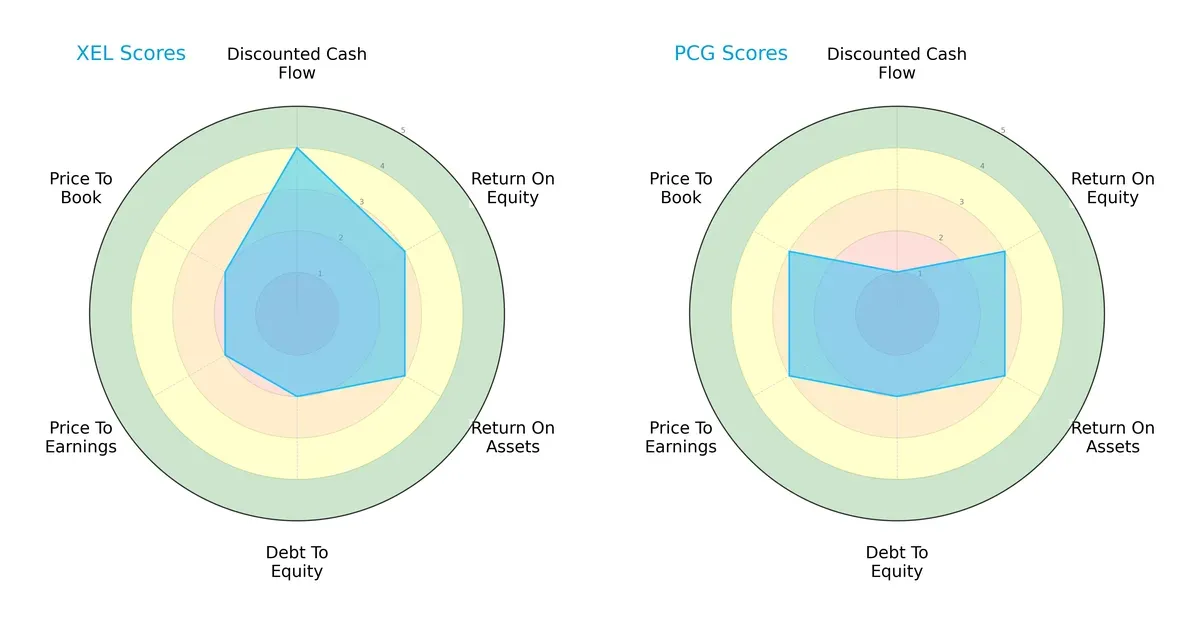
Xcel Energy shows strength in discounted cash flow (DCF) with a favorable score of 4, outperforming PG&E’s very unfavorable 1. Both firms share moderate returns on equity (ROE) and assets (ROA) at 3. Debt-to-equity and valuation metrics favor PG&E slightly, scoring moderate 3s in price-to-earnings (P/E) and price-to-book (P/B), while Xcel lags at 2 in these areas. Xcel’s profile balances DCF strength against weaker valuation scores, whereas PG&E relies on a more balanced but overall weaker cash flow outlook.
Bankruptcy Risk: Solvency Showdown
Both companies reside in the distress zone per Altman Z-Scores, indicating elevated bankruptcy risk in this cycle:
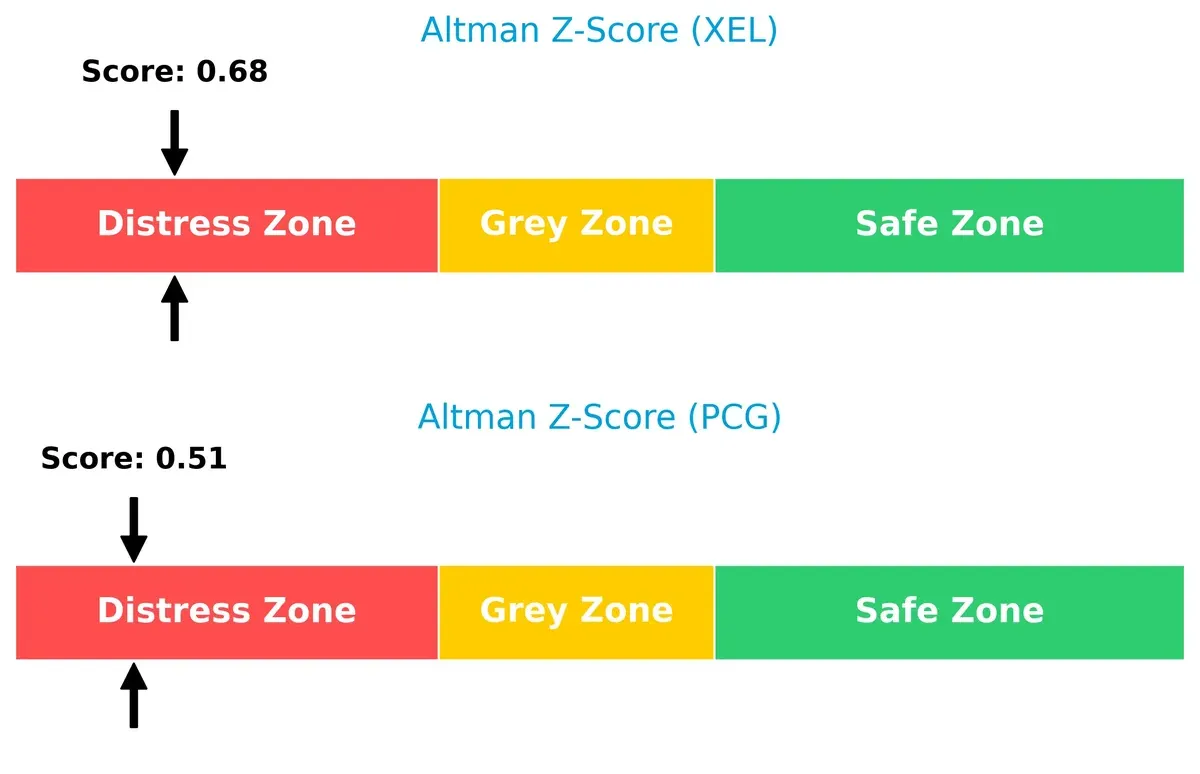
Xcel Energy’s Z-score of 0.68 slightly surpasses PG&E’s 0.51, but both fall well below the safe threshold of 3. This signals significant financial distress and challenges to long-term survival without structural improvements.
Financial Health: Quality of Operations
Piotroski F-Scores place both firms in average financial health territory:
, highlighting concerns about operational efficiency and financial robustness. Xcel’s lower score flags potential red flags in profitability or asset management compared to PG&E.
How are the two companies positioned?
This section dissects the operational DNA of XEL and PCG by comparing their revenue distribution by segment and internal dynamics. The goal is to confront their economic moats to identify which business model offers the most resilient and sustainable competitive advantage in today’s market landscape.
Revenue Segmentation: The Strategic Mix
The following visual comparison dissects how Xcel Energy Inc. and Pacific Gas & Electric Co. diversify their income streams and where their primary sector bets lie:
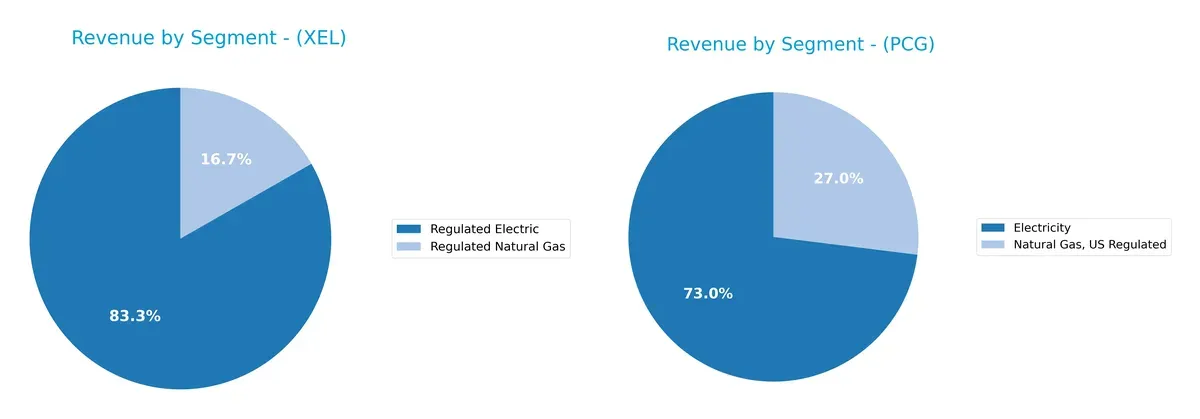
Xcel Energy leans heavily on Regulated Electric, generating $22.3B in 2024, with Regulated Natural Gas at $4.5B, showing moderate diversification. In contrast, Pacific Gas & Electric anchors its revenue around Electricity at $18.6B and Natural Gas at $6.6B, reflecting a more balanced mix. Xcel’s focus signals strong infrastructure dominance, while PG&E’s broader base mitigates concentration risk amid sector volatility.
Strengths and Weaknesses Comparison
This table compares the strengths and weaknesses of Xcel Energy Inc. (XEL) and Pacific Gas & Electric Co. (PCG):
XEL Strengths
- Higher net margin at 13.76%
- Favorable WACC at 5.07%
- Dividend yield strong at 3.83%
- Larger regulated electric revenue base with 22.3B in 2024
PCG Strengths
- Favorable WACC at 4.93%
- Lower debt-to-equity ratio at 0.27
- Favorable P/E and P/B ratios indicating market confidence
- Significant natural gas revenue of 6.76B in 2025
XEL Weaknesses
- Unfavorable ROE at 8.55% and ROIC at 3.15%
- Poor liquidity with zero current and quick ratios
- High debt-to-equity at 1.44
- Low asset turnover ratios indicating inefficiency
- Neutral interest coverage at 2.32
PCG Weaknesses
- Zero net margin and ROIC
- Negative interest coverage
- Very low dividend yield at 0.62%
- Poor liquidity with near-zero current and quick ratios
- Unfavorable asset turnover ratios signaling weak operational efficiency
XEL’s strengths lie in profitability and dividend yield, supported by a sizeable regulated electric segment. PCG benefits from stronger balance sheet metrics and market valuation but faces profitability and liquidity challenges. Both companies show operational weaknesses needing strategic focus.
The Moat Duel: Analyzing Competitive Defensibility
A structural moat is the only shield protecting long-term profits from relentless competition erosion. Here’s how Xcel Energy and Pacific Gas & Electric stack up:
Xcel Energy Inc.: Operational Scale with Regulatory Anchors
Xcel’s moat stems from regulated utility status and diverse energy sources, supporting stable margins and consistent revenue growth. Yet, declining ROIC warns of weakening capital efficiency in 2026.
Pacific Gas & Electric Co.: Emerging Profitability Amid Regulatory Challenges
PG&E’s moat lies in its growing ROIC trend despite negative excess returns, signaling improving operational discipline. Unlike Xcel, PG&E faces tougher regulatory headwinds but shows potential through innovation in smart grid tech.
Regulatory Stability vs. Operational Turnaround: The Moat Face-off
Xcel’s wider moat benefits from scale and regulated cash flows but struggles with eroding profitability. PG&E’s narrower moat is less stable but improving, positioning it better to defend market share through operational gains.
Which stock offers better returns?
The past year shows Xcel Energy’s stock surging over 56%, though recent months reveal slight deceleration. Pacific Gas & Electric gains over 10%, with accelerating momentum in late 2025 and early 2026.
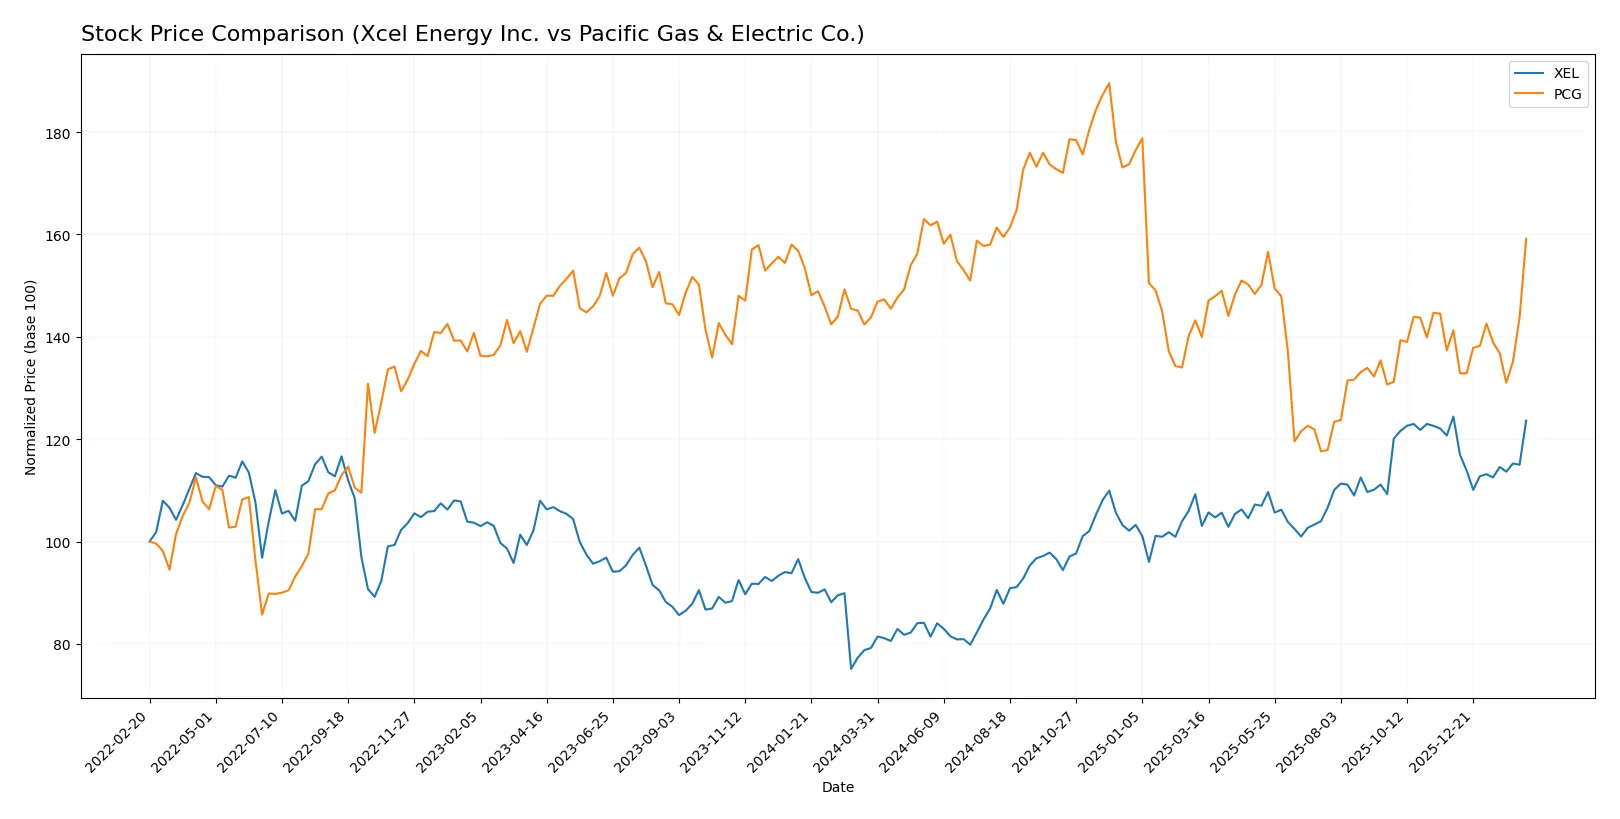
Trend Comparison
Xcel Energy (XEL) exhibits a strong bullish trend with a 56.09% price increase over 12 months. The trend shows deceleration, with a high volatility level (8.22 std deviation) and a recent slight downward shift (-0.63%).
Pacific Gas & Electric (PCG) also holds a bullish trend, rising 10.66% over the year. The trend accelerates, volatility remains low (1.96 std deviation), and recent months show a 12.66% gain with buyer dominance.
Xcel Energy’s stock outperforms Pacific Gas & Electric by a wide margin over the past year, despite recent deceleration. PCG’s accelerating trend may indicate improving momentum but with smaller overall gains.
Target Prices
Analysts present a clear consensus on target prices for Xcel Energy Inc. and Pacific Gas & Electric Co.
| Company | Target Low | Target High | Consensus |
|---|---|---|---|
| Xcel Energy Inc. | 82 | 95 | 88.8 |
| Pacific Gas & Electric Co. | 18 | 25 | 21.43 |
For Xcel Energy, the consensus target of 88.8 suggests modest upside from the current 81.59 price, signaling moderate confidence. Pacific Gas & Electric’s target consensus at 21.43 implies potential appreciation above the current 18.16, reflecting cautious optimism.

Don’t Let Luck Decide Your Entry Point
Optimize your entry points with our advanced ProRealTime indicators. You’ll get efficient buy signals with precise price targets for maximum performance. Start outperforming now!
How do institutions grade them?
Below is a summary of recent grades issued by leading financial institutions for both companies:
Xcel Energy Inc. Grades
The table shows the latest official grades from reputable grading firms for Xcel Energy Inc.:
| Grading Company | Action | New Grade | Date |
|---|---|---|---|
| UBS | Upgrade | Buy | 2026-02-13 |
| Barclays | Maintain | Overweight | 2026-01-15 |
| UBS | Maintain | Neutral | 2025-12-17 |
| Keybanc | Maintain | Overweight | 2025-12-12 |
| JP Morgan | Maintain | Overweight | 2025-12-11 |
| Barclays | Maintain | Overweight | 2025-11-05 |
| Citigroup | Maintain | Buy | 2025-11-03 |
| UBS | Maintain | Neutral | 2025-10-31 |
| Mizuho | Maintain | Outperform | 2025-10-27 |
| Jefferies | Maintain | Buy | 2025-10-16 |
Pacific Gas & Electric Co. Grades
This table summarizes the latest official grades assigned to Pacific Gas & Electric Co.:
| Grading Company | Action | New Grade | Date |
|---|---|---|---|
| Jefferies | Maintain | Buy | 2026-01-28 |
| Wells Fargo | Maintain | Overweight | 2026-01-20 |
| JP Morgan | Maintain | Overweight | 2025-12-12 |
| UBS | Maintain | Neutral | 2025-10-24 |
| Jefferies | Maintain | Buy | 2025-10-22 |
| BMO Capital | Maintain | Outperform | 2025-10-14 |
| Jefferies | Maintain | Buy | 2025-10-03 |
| Barclays | Maintain | Overweight | 2025-10-01 |
| Morgan Stanley | Maintain | Equal Weight | 2025-09-25 |
| UBS | Maintain | Neutral | 2025-09-18 |
Which company has the best grades?
Xcel Energy generally holds a slightly stronger consensus with multiple “Buy” and “Overweight” ratings and a recent upgrade by UBS. Pacific Gas & Electric also enjoys solid support but includes a few “Neutral” and “Equal Weight” grades. Investors might view Xcel Energy’s recent upgrades as a positive signal of institutional confidence.
Risks specific to each company
The following categories identify the critical pressure points and systemic threats facing both firms in the 2026 market environment:
1. Market & Competition
Xcel Energy Inc. (XEL)
- Operates in multiple states with diverse energy sources, enhancing competitive positioning.
Pacific Gas & Electric Co. (PCG)
- Concentrated in northern and central California, facing intense regulatory and market pressures.
2. Capital Structure & Debt
Xcel Energy Inc. (XEL)
- Debt-to-equity ratio at 1.44 signals higher leverage, raising financial risk.
Pacific Gas & Electric Co. (PCG)
- Low debt-to-equity of 0.27 suggests conservative leverage and stronger balance sheet stability.
3. Stock Volatility
Xcel Energy Inc. (XEL)
- Beta of 0.476 indicates moderate stock volatility, less sensitive to market swings.
Pacific Gas & Electric Co. (PCG)
- Beta of 0.374 shows even lower volatility, reducing portfolio risk exposure.
4. Regulatory & Legal
Xcel Energy Inc. (XEL)
- Faces standard utility regulations across several states, with manageable compliance risks.
Pacific Gas & Electric Co. (PCG)
- High regulatory scrutiny in California due to past wildfire liabilities increases legal risk substantially.
5. Supply Chain & Operations
Xcel Energy Inc. (XEL)
- Diverse energy mix aids operational resilience but asset turnover is weak.
Pacific Gas & Electric Co. (PCG)
- Operational efficiency challenged; zero asset turnover and negative interest coverage raise red flags.
6. ESG & Climate Transition
Xcel Energy Inc. (XEL)
- Invests in renewables and diverse power sources, supporting a stable climate transition path.
Pacific Gas & Electric Co. (PCG)
- Reliant on fossil fuels and nuclear; faces pressure to accelerate ESG improvements amid California policies.
7. Geopolitical Exposure
Xcel Energy Inc. (XEL)
- U.S.-focused with spread over multiple states, reducing localized geopolitical risks.
Pacific Gas & Electric Co. (PCG)
- Concentrated exposure to California risks including wildfire and regulatory changes.
Which company shows a better risk-adjusted profile?
Xcel Energy’s primary risk lies in its higher leverage and weak operational efficiency. Pacific Gas & Electric faces severe regulatory and legal challenges from wildfire liabilities, compounded by operational and liquidity weaknesses. Despite these risks, PCG’s lower debt and stock volatility offer some cushion. However, its distress-level Altman Z-Score and negative interest coverage amplify concerns. I see XEL as having a marginally better risk-adjusted profile due to more balanced geographic exposure and stronger ESG positioning, although its leverage remains a caution. The recent sharp regulatory pressures on PCG and its deteriorating liquidity metrics justify heightened vigilance.
Final Verdict: Which stock to choose?
Xcel Energy Inc. (XEL) stands out as a robust cash generator with solid revenue growth and a favorable income statement profile. Its main point of vigilance is the declining return on invested capital, signaling deteriorating efficiency. XEL suits investors seeking steady income with moderate growth potential in an aggressive growth portfolio.
Pacific Gas & Electric Co. (PCG) boasts a strategic moat through its improving return on invested capital trend, despite current value destruction. It carries a safer debt profile and a more attractive valuation than XEL. PCG appeals to investors looking for growth at a reasonable price with a focus on stability and capital preservation.
If you prioritize steady cash flow and income with some growth upside, XEL is the compelling choice due to its strong revenue momentum and dividend yield. However, if you seek a value-oriented investment with improving operational efficiency and lower leverage, PCG offers better stability and a discounted entry point despite its challenges.
Disclaimer: Investment carries a risk of loss of initial capital. The past performance is not a reliable indicator of future results. Be sure to understand risks before making an investment decision.
Go Further
I encourage you to read the complete analyses of Xcel Energy Inc. and Pacific Gas & Electric Co. to enhance your investment decisions: