In the evolving utilities sector, Pacific Gas & Electric Co. (PCG) and WEC Energy Group, Inc. (WEC) stand out as major players with strong regional footholds and diverse energy portfolios. Both companies operate in regulated electric markets while pursuing innovation in renewable energy and smart grid technologies. Comparing their strategies and market positions reveals key insights. Join me as we explore which company offers the most compelling opportunity for investors today.

Table of contents
Companies Overview
I will begin the comparison between Pacific Gas & Electric Co. and WEC Energy Group, Inc. by providing an overview of these two companies and their main differences.
Pacific Gas & Electric Co. Overview
Pacific Gas & Electric Co. operates in the regulated electric industry, serving northern and central California. The company generates, transmits, distributes, and sells electricity and natural gas using diverse sources including nuclear, hydroelectric, fossil fuel, and photovoltaic. It also develops innovative solutions like a microgrid backup power transfer meter integrating with its SmartMeter system. Headquartered in Oakland, CA, it employs approximately 28,410 full-time employees.
WEC Energy Group, Inc. Overview
WEC Energy Group, Inc. provides regulated natural gas, electricity, and renewable energy services across several U.S. states. Its operations span multiple segments including electric transmission and non-utility energy infrastructure. WEC generates power from coal, natural gas, hydroelectric, wind, solar, and biomass. Based in Milwaukee, WI, WEC manages extensive electric and natural gas distribution networks and employs about 7,000 people.
Key similarities and differences
Both companies operate in the regulated electric utility sector and provide electricity and natural gas services, but Pacific Gas & Electric focuses on northern and central California, while WEC Energy Group operates in multiple states including Wisconsin and Illinois. Pacific Gas & Electric has a larger workforce and emphasizes innovative metering technologies, whereas WEC has a broader energy portfolio including significant renewable and nonregulated energy segments. Their scale and geographic reach differ, reflecting distinct operational strategies within the utilities industry.
Income Statement Comparison
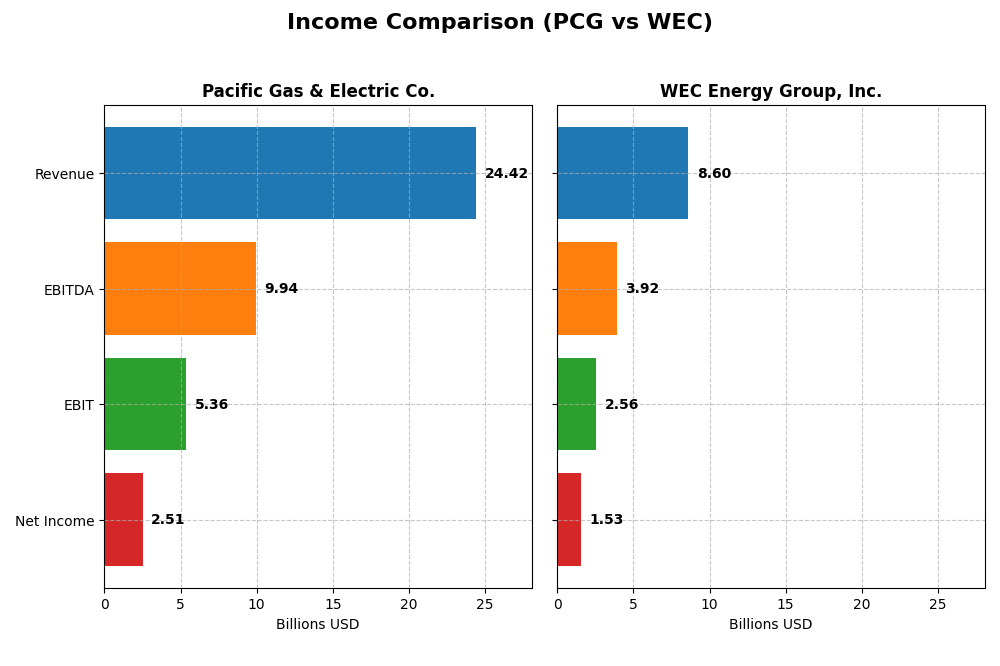
This table presents a side-by-side comparison of key income statement metrics for Pacific Gas & Electric Co. and WEC Energy Group, Inc. for the fiscal year 2024, facilitating an overview of their financial performance.
| Metric | Pacific Gas & Electric Co. (PCG) | WEC Energy Group, Inc. (WEC) |
|---|---|---|
| Market Cap | 34.8B | 33.5B |
| Revenue | 24.4B | 8.6B |
| EBITDA | 9.9B | 3.9B |
| EBIT | 5.4B | 2.6B |
| Net Income | 2.5B | 1.5B |
| EPS | 1.16 | 4.81 |
| Fiscal Year | 2024 | 2024 |
Income Statement Interpretations
Pacific Gas & Electric Co.
Pacific Gas & Electric Co. showed a revenue increase of 32.22% over 2020-2024 but experienced a slight revenue decline of 0.04% in 2024. Net income grew substantially by 292.64% overall, with a net margin improvement to 10.29%. The latest year saw strong gross profit and EBIT margin expansions, despite unfavorable interest expenses, highlighting improved operational efficiency.
WEC Energy Group, Inc.
WEC Energy Group’s revenue grew 18.76% over the five-year span but declined 3.3% in 2024. Net income increased by 27.25% overall, supporting a solid net margin of 17.77%. Recent growth included favorable gross profit and EBIT margin rises, with stable interest expenses and ongoing margin improvements, reflecting consistent profitability enhancements.
Which one has the stronger fundamentals?
Both companies present favorable income statement fundamentals with stable or improving margins and positive net income growth. Pacific Gas & Electric’s stronger revenue and net income growth contrast with WEC’s higher and more stable margins and better interest expense control. The assessment depends on prioritizing growth or margin stability, as both firms maintain favorable overall income profiles.
Financial Ratios Comparison
The following table presents the most recent financial ratios for Pacific Gas & Electric Co. (PCG) and WEC Energy Group, Inc. (WEC) as of fiscal year 2024, offering a side-by-side view of key profitability, liquidity, leverage, efficiency, and dividend metrics.
| Ratios | Pacific Gas & Electric Co. (PCG) | WEC Energy Group, Inc. (WEC) |
|---|---|---|
| ROE | 8.33% | 12.30% |
| ROIC | 3.98% | 4.14% |
| P/E | 17.2 | 19.5 |
| P/B | 1.43 | 2.39 |
| Current Ratio | 1.05 | 0.60 |
| Quick Ratio | 1.00 | 0.43 |
| D/E (Debt-to-Equity) | 1.94 | 1.64 |
| Debt-to-Assets | 43.7% | 42.9% |
| Interest Coverage | 1.46 | 2.64 |
| Asset Turnover | 0.18 | 0.18 |
| Fixed Asset Turnover | 0.28 | 0.25 |
| Payout Ratio | 3.42% | 69.10% |
| Dividend Yield | 0.20% | 3.55% |
Interpretation of the Ratios
Pacific Gas & Electric Co.
Pacific Gas & Electric Co. shows a mixed ratio profile with favorable net margin (10.29%) and WACC (4.68%), but weak return on equity (8.33%) and return on invested capital (3.98%). Debt levels and interest coverage raise concerns, while liquidity ratios are neutral to positive. Dividend yield is low at 0.2%, indicating modest shareholder returns with potential risks from leverage and coverage.
WEC Energy Group, Inc.
WEC Energy Group presents a stronger net margin (17.77%) and solid dividend yield of 3.55%, though return on invested capital is slightly unfavorable at 4.14%. Liquidity ratios are weak, and debt to equity is high, but interest coverage is neutral. Dividend payments appear sustainable with a focus on stable shareholder returns supported by cash flow.
Which one has the best ratios?
Both companies have slightly unfavorable global ratio opinions, but WEC Energy Group benefits from a higher net margin and dividend yield. Pacific Gas & Electric faces more unfavorable leverage and coverage ratios, while WEC contends with weaker liquidity. Overall, the ratio strengths and weaknesses differ, reflecting distinct financial profiles.
Strategic Positioning
This section compares the strategic positioning of Pacific Gas & Electric Co. (PCG) and WEC Energy Group, Inc. (WEC) including market position, key segments, and exposure to technological disruption:
Pacific Gas & Electric Co.
- Large regulated electric provider in northern and central California facing typical utility competition.
- Key segments include electricity generation (nuclear, hydro, fossil, photovoltaic) and regulated natural gas sales.
- Develops smart grid technologies like microgrid backup power meters integrated with existing SmartMeter systems.
WEC Energy Group, Inc.
- Regulated electric and natural gas provider with diversified regional segments across several US states.
- Operates six segments including Illinois, Wisconsin, other states, electric transmission, and non-utility energy infrastructure.
- Provides renewable and nonregulated energy services alongside traditional energy distribution, with broad infrastructure assets.
PCG vs WEC Positioning
PCG has a concentrated regional focus with diversified electricity generation technologies, while WEC operates a more geographically diversified portfolio covering multiple states and energy segments. PCG’s tech innovation contrasts with WEC’s broader infrastructure scale, reflecting different strategic emphases and operational scopes.
Which has the best competitive advantage?
Both PCG and WEC show slightly unfavorable MOAT evaluations due to ROIC below WACC, indicating value destruction, though both have growing profitability trends. Neither currently demonstrates a strong competitive advantage based on MOAT assessment.
Stock Comparison
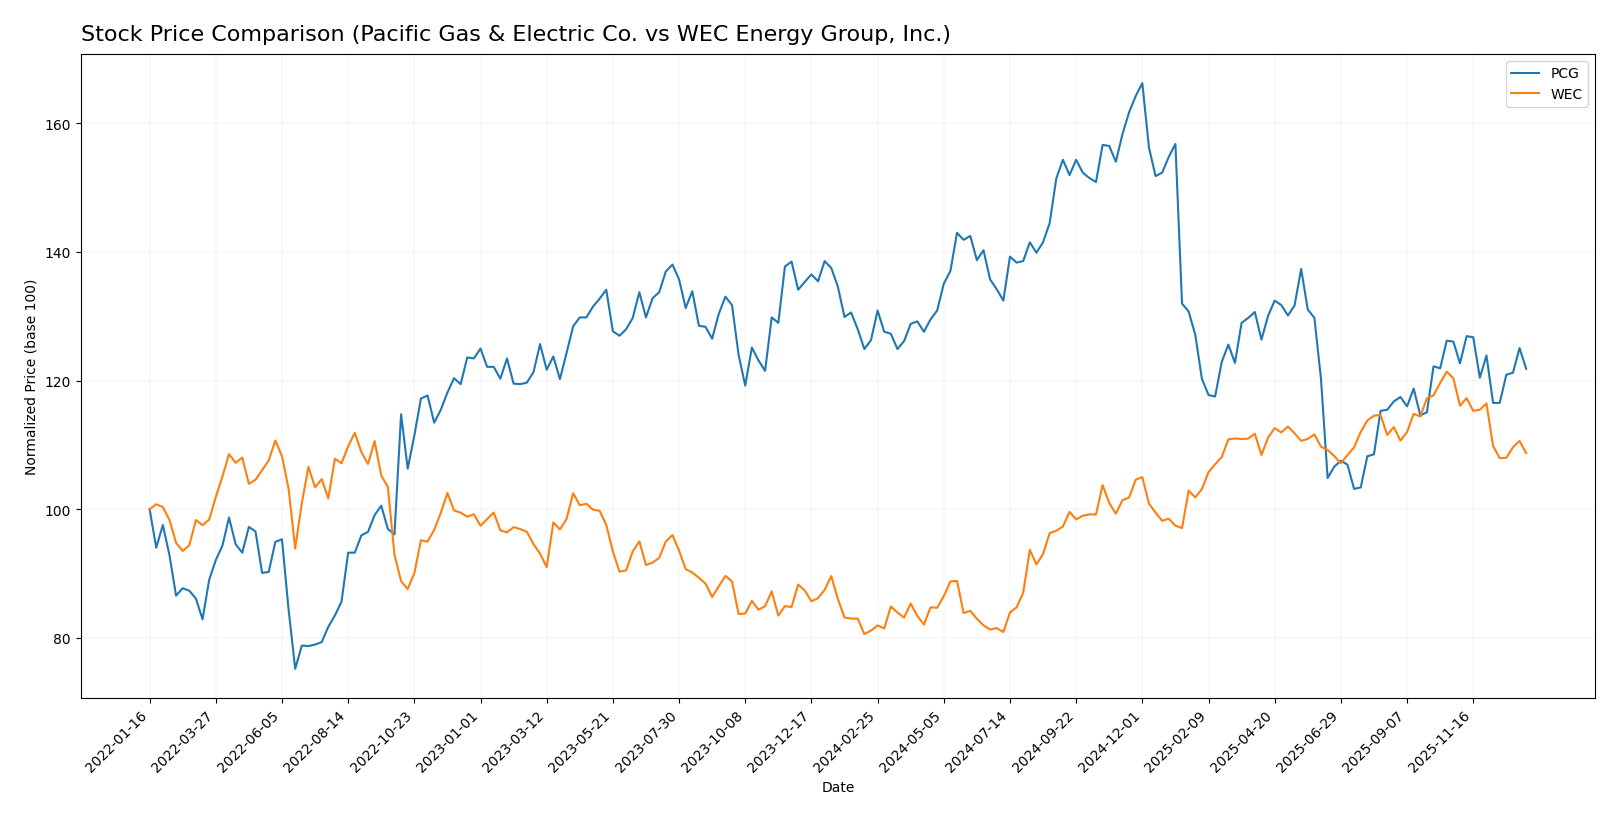
The stock prices of Pacific Gas & Electric Co. (PCG) and WEC Energy Group, Inc. (WEC) have shown contrasting trends over the past 12 months, with PCG experiencing a moderate decline and WEC delivering substantial gains despite recent downward pressure.
Trend Analysis
Pacific Gas & Electric Co. (PCG) exhibited a bearish trend over the past 12 months with a price decrease of -3.53%, showing deceleration in its decline and a relatively low volatility with a standard deviation of 1.93. The stock peaked at 21.63 and bottomed at 13.42.
WEC Energy Group, Inc. (WEC) showed a bullish trend with a 34.05% price increase over the same period, despite deceleration. It demonstrated higher volatility, reflected by a standard deviation of 11.44, with a high of 116.84 and a low of 77.85.
Comparing the two, WEC significantly outperformed PCG in market performance over the past year, with a strong overall upward trend versus PCG’s moderate decline.
Target Prices
The consensus target prices from reliable analysts indicate potential upside for both Pacific Gas & Electric Co. and WEC Energy Group, Inc.
| Company | Target High | Target Low | Consensus |
|---|---|---|---|
| Pacific Gas & Electric Co. | 25 | 18 | 21.5 |
| WEC Energy Group, Inc. | 136 | 105 | 122.67 |
Analysts expect Pacific Gas & Electric Co.’s stock to rise significantly above its current price of $15.85, while WEC Energy Group also shows a notable upside from its current $104.65 market price. Overall, the target prices suggest positive growth potential in the regulated electric sector.
Analyst Opinions Comparison
This section compares analysts’ ratings and grades for Pacific Gas & Electric Co. (PCG) and WEC Energy Group, Inc. (WEC):
Rating Comparison
PCG Rating
- Rating: B-, considered very favorable
- Discounted Cash Flow Score: 1, very unfavorable DCF valuation
- ROE Score: 3, moderate efficiency in generating profit from equity
- ROA Score: 3, moderate asset utilization
- Debt To Equity Score: 1, very unfavorable financial risk due to high leverage
- Overall Score: 3, moderate overall financial standing
WEC Rating
- Rating: B-, considered very favorable
- Discounted Cash Flow Score: 1, very unfavorable DCF valuation
- ROE Score: 4, favorable efficiency in generating profit from equity
- ROA Score: 4, favorable asset utilization
- Debt To Equity Score: 2, moderate financial risk with some leverage
- Overall Score: 3, moderate overall financial standing
Which one is the best rated?
Both PCG and WEC share the same overall rating of B- and moderate overall scores. However, WEC has stronger returns on equity and assets with more moderate financial risk, making it the better rated company based strictly on these metrics.
Scores Comparison
The comparison of Altman Z-Score and Piotroski Score for Pacific Gas & Electric Co. and WEC Energy Group, Inc. is as follows:
PCG Scores
- Altman Z-Score: 0.48, indicating financial distress.
- Piotroski Score: 5, reflecting average financial health.
WEC Scores
- Altman Z-Score: 1.14, still in distress zone.
- Piotroski Score: 6, reflecting average financial health.
Which company has the best scores?
WEC has a higher Altman Z-Score than PCG, though both remain in the distress zone. WEC’s Piotroski Score is also slightly better, indicating marginally stronger financial health based on the available data.
Grades Comparison
The recent grades from major financial institutions for Pacific Gas & Electric Co. and WEC Energy Group, Inc. are as follows:
Pacific Gas & Electric Co. Grades
This table summarizes the latest grades assigned to Pacific Gas & Electric Co. by reputable grading firms.
| Grading Company | Action | New Grade | Date |
|---|---|---|---|
| JP Morgan | Maintain | Overweight | 2025-12-12 |
| UBS | Maintain | Neutral | 2025-10-24 |
| Jefferies | Maintain | Buy | 2025-10-22 |
| BMO Capital | Maintain | Outperform | 2025-10-14 |
| Jefferies | Maintain | Buy | 2025-10-03 |
| Barclays | Maintain | Overweight | 2025-10-01 |
| Morgan Stanley | Maintain | Equal Weight | 2025-09-25 |
| Morgan Stanley | Upgrade | Equal Weight | 2025-09-18 |
| UBS | Maintain | Neutral | 2025-09-18 |
| Barclays | Maintain | Overweight | 2025-07-22 |
Overall, Pacific Gas & Electric Co. shows a predominantly positive trend with multiple “Buy,” “Overweight,” and “Outperform” ratings and few neutral stances.
WEC Energy Group, Inc. Grades
This table presents recent grades issued to WEC Energy Group, Inc. by recognized financial analysts.
| Grading Company | Action | New Grade | Date |
|---|---|---|---|
| B of A Securities | Maintain | Neutral | 2025-12-31 |
| UBS | Maintain | Neutral | 2025-12-17 |
| Barclays | Maintain | Underweight | 2025-12-16 |
| Keybanc | Maintain | Overweight | 2025-12-12 |
| JP Morgan | Maintain | Neutral | 2025-12-11 |
| Scotiabank | Maintain | Sector Outperform | 2025-10-31 |
| BMO Capital | Maintain | Market Perform | 2025-10-21 |
| Barclays | Maintain | Equal Weight | 2025-10-21 |
| Keybanc | Maintain | Overweight | 2025-10-15 |
| UBS | Maintain | Neutral | 2025-10-10 |
WEC Energy Group, Inc. displays a mixed rating profile with a balance between neutral and overweight opinions, alongside some more cautious ratings like “Underweight.”
Which company has the best grades?
Pacific Gas & Electric Co. has received a stronger consensus with more “Buy” and “Overweight” ratings compared to WEC Energy Group’s mix of “Neutral,” “Hold,” and some “Underweight” grades. This suggests investors may perceive PCG as having a more favorable outlook, potentially impacting portfolio positioning and risk considerations accordingly.
Strengths and Weaknesses
Here is a comparison of Pacific Gas & Electric Co. (PCG) and WEC Energy Group, Inc. (WEC) based on key financial and operational criteria as of 2024.
| Criterion | Pacific Gas & Electric Co. (PCG) | WEC Energy Group, Inc. (WEC) |
|---|---|---|
| Diversification | Primarily electricity (18.6B) and natural gas (6.6B) in US regulated markets | Revenue spread across Wisconsin (6.3B), Illinois (1.6B), Non-Utility Energy Infrastructure (0.7B), and other states |
| Profitability | Net margin 10.3% (favorable); ROIC 3.98% (unfavorable, below WACC 4.68%) | Net margin 17.8% (favorable); ROIC 4.14% (unfavorable, below WACC 5.3%) |
| Innovation | Moderate focus; ROIC improving but still value-destroying | Moderate focus; ROIC improving but still value-destroying |
| Global presence | Local/regional focus in California | Regional focus in Midwest US states |
| Market Share | Large utility in California; dominant in electricity and natural gas | Leading utility in Wisconsin and Illinois markets |
Key takeaways: Both companies show slightly unfavorable economic moats with ROIC below WACC, indicating value destruction, though profitability is improving. PCG has a strong presence in California with a more concentrated product line, while WEC benefits from geographic diversification across several states and segments. Investors should consider their risk tolerance given the ongoing challenges in profitability.
Risk Analysis
The table below summarizes key risk factors for Pacific Gas & Electric Co. (PCG) and WEC Energy Group, Inc. (WEC) based on their latest financial and operational data from 2024.
| Metric | Pacific Gas & Electric Co. (PCG) | WEC Energy Group, Inc. (WEC) |
|---|---|---|
| Market Risk | Low beta (0.38) implies lower volatility but limited growth potential | Moderate beta (0.57) with steady performance |
| Debt level | High debt-to-equity (1.94) and weak interest coverage (1.76) | High debt-to-equity (1.64), better interest coverage (3.14) |
| Regulatory Risk | Significant, given California’s strict utility regulations and wildfire liabilities | Moderate, operates mainly in Midwest with stable regulation |
| Operational Risk | High due to diversified energy sources and historical wildfire-related outages | Moderate, diversified energy portfolio but fewer operational disruptions |
| Environmental Risk | Elevated due to wildfire risks and reliance on fossil fuels | Moderate, increasing renewable energy investments |
| Geopolitical Risk | Low, primarily US domestic operations | Low, predominantly US focused |
PCG faces the most impactful risks related to high leverage and regulatory challenges tied to wildfire liabilities in California. WEC’s risks are more balanced but include moderate debt and operational exposure. Both companies show financial distress signals with Altman Z-scores in the distress zone, indicating caution for investors.
Which Stock to Choose?
Pacific Gas & Electric Co. (PCG) shows a favorable income statement with strong growth in net income and margins over 2020-2024, but its financial ratios are slightly unfavorable, marked by weak returns on equity and invested capital, and high debt levels. The company’s overall rating is very favorable (B-), yet it faces value destruction as ROIC remains below WACC despite a rising trend.
WEC Energy Group, Inc. (WEC) presents a favorable income statement with steady profitability and margin improvements, supported by mostly neutral to favorable financial ratios, including a better return on equity and lower debt risk compared to PCG. WEC holds a very favorable rating (B-), though it also shows value destruction with ROIC below WACC, albeit with a stable upward ROIC trend.
Considering ratings and overall financial evaluations, PCG might appeal to investors prioritizing strong income growth despite leverage concerns and slightly unfavorable ratios, whereas WEC could be more attractive for those valuing steadier profitability and somewhat better financial stability. The choice could depend on an investor’s risk tolerance and preference for growth versus financial stability.
Disclaimer: Investment carries a risk of loss of initial capital. The past performance is not a reliable indicator of future results. Be sure to understand risks before making an investment decision.
Go Further
I encourage you to read the complete analyses of Pacific Gas & Electric Co. and WEC Energy Group, Inc. to enhance your investment decisions: